• 검색 결과가 없습니다.

Properties of Non-dispersive infrared Ethanol Gas Sensors according to the Irradiation Energy

N/A
N/A
Protected

Academic year: 2021

Share "Properties of Non-dispersive infrared Ethanol Gas Sensors according to the Irradiation Energy"

Copied!
5
0
0

로드 중.... (전체 텍스트 보기)

전체 글

(1)

http://dx.doi.org/10.5369/JSST.2017.26.3.168 pISSN 1225-5475/eISSN 2093-7563

Properties of Non-dispersive infrared Ethanol Gas Sensors according to the Irradiation Energy

JinHo Kim and SeungHwan Yi

+

Abstract

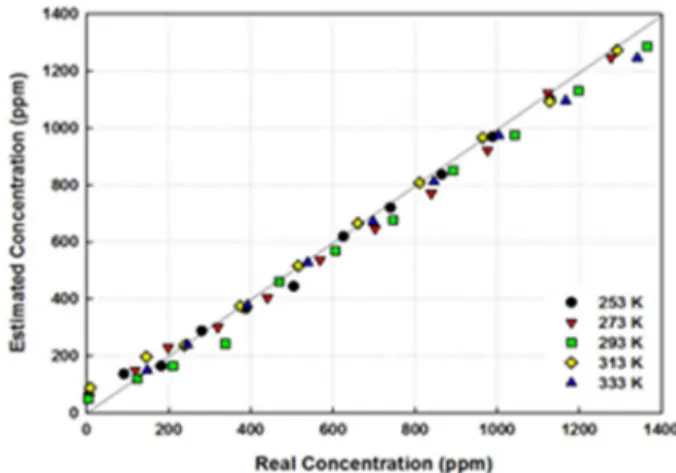
A nondispersive infrared (NDIR) ethanol gas sensor was prototyped with ASIC implemented thermopile sensor, which included a temperature sensor and two ellipsoidal waveguide structures. The temperature dependency of the two ethanol sensors (with partially blocked and intact structures) has been characterized. The two ethanol gas sensors showed linear output voltages initially when varying the ambient temperature from 253 K to 333 K. The slope of the temperature sensor presented a constant value of 15 mV/K. After tem- perature compensation, the ethanol gas sensor estimated ethanol concentrations with larger errors of 20 to 25% below 200 ppm. How- ever, the estimation errors were reduced to between −10 and +1 % from 253 K to 333 K above 200 ppm ethanol gas concentration in this research.

Keywords: Non-dispersive infrared gas sensor, ethanol gas sensor, elliptical waveguide, optical simulation, irradiation energy

1. INTRODUCTION

The measurement of ethanol gas is essential for establishing sobriety while driving and for occupational safety concerns at manufacturing sites. Thus, a small range of ethanol gas sensors are available in the market; however, they cannot measure the exact concentrations of ethanol gas and have some drawbacks.

Current research on ethanol sensors can be categorized into three types: oxide semiconductors based on SnO

2

, TiO

2

- nanotubes, and ZnO [1-3], electrochemical fuel-cells [4], and optical sensors [5,6]. L. Lindberg et al. [5] reported the first NDIR ethanol sensor for the purpose of screening driving while intoxicated (DWI). This was installed in port areas of Sweden for checking DWI. Although portable optical ethanol sensors are not available yet, one potential device is in the advanced stages of research and undergoing testing for reliability in automotive applications so far [5].

The NDIR gas detection system is smaller and more cost effective than other optical gas measurement systems [7].

Furthermore, they have some advantages compared to the electrochemical gas sensors: high reliability, fast response and recovery times (less than 10 s), high selectivity and the ability to be configured for multiple gas measurement systems [8].

NDIR gas sensors consist of three main components: an optical source and its driving circuit, an optical waveguide, and infrared (IR) detector and its signal conditioning device. The IR light source can be LEDs [9, 10], IR light bulbs [8, 11], and blackbody radiation sources [6]. The IR bulb consists of a filament and glass material to protect it. This can potentially cause unstable output voltages on the IR detector due to vibration of the filament. Contrastingly, blackbody radiators fabricated by Microelectromechanical Systems (MEMS) techniques are very robust and tolerant of external vibration and therefore is recommended for use in harsh environmental conditions such as those in vehicles.

Unique waveguide structures are required to construct NDIR gas sensors. These include; two- or three-concave [12], multiple reflection [13], and long cylindrical structures with optical lenses [14] to increase the optical path length or focus the infrared light.

In order to increase the sensitivity and enhance the signal-to-noise ratio (SNR), it is highly effective to have a large optical path length and also a light focusing structure because the sensitivity and SNR of NDIR gas sensors is affected by optical path length and the energy density of the light in the optical waveguide. For signal conditioning, thermopile detectors have good sensitivity in low target gas concentration; however, it is very difficult to Department of Mechanical Engineering, Korea National Unversity of

Transportation, 50 Daehakro, Chungjushi, Chungbuk 27469, Korea

+

Corresponding author: [email protected]

(Received: May. 25, 2017, Revised: May 27, 2017, Accepted: May 29, 2017)

This is an Open Access article distributed under the terms of the Creative Commons Attribution Non-Commercial License(http://creativecommons.org/

licenses/bync/3.0) which permits unrestricted non-commercial use, distribution,

and reproduction in any medium, provided the original work is properly cited.

(2)

achieve high sensitivity and accuracy without noise cancellation.

To overcome this, a thermopile detector with an application specific integrated circuits (ASICs) chip is implemented in the same package. This reduces the noise component and also enhances the output properties of the thermopile.

In order to enhance the performance of the NDIR gas sensor at low target concentrations and also to provide a novel, unique optical waveguide structure, the optical components have been modeled and the optical properties simulated to devise a new ethanol gas sensor. Then, temperature dependencies of ethanol gas sensor have been measured to understand the properties of the sensor module for varied irradiation energies and then the calculated ethanol concentrations are compared to known, injected ethanol concentrations.

2. SIMULATIONS, FABRICATION OF SENSOR MODULE AND EXPERIMENTS

2.1 Modeling and simulations of optical components The IR source, detector, and elliptical structure were modeled in 3-dimensions using solidworks

®

and the optical path and energy at the detector were traced with the commercially available software

package TracePro

®

. The dimensions of the IR source and detector were supplied by the manufacturers; in particular, the IR source has 1.7 × 1.7 mm

2

blackbody area, the IR detector has 1.2 × 1.2 mm

2

active area for detection, as shown in Fig. 1.

When modeling the characteristics of the IR source, the applied power was assumed to be 600 mW and the emissivity(ε) of surface was assumed as 1. In addition, the total number of rays was set to 100,000, these were irradiated from the IR source. The active area of IR detector was modeled as a perfect absorber of IR light in this simulation.

The elliptical structure has a unique property that the beam irradiated from one focal point is focused again at the second focal point of the ellipsoid as previously reported [15]. As can be seen in Fig. 1 c), the surface of one ellipsoid does not perfectly reflect light from the IR source in order to intentionally diminish the energy on the detector. The one infrared source is located at the common focal point (location A in Fig. 1 c)) of two ellipsoids and the thermopile detectors are positioned at the other two focal points (locations, B and C in Fig. 1 c)).

2.2 Fabrication of sensor module

The 3-dimensional waveguide shown in Fig. 1 c) was fabricated by insert molding of plastic material. Then the surfaces of the elliptical structures were coated with copper-gold films above 50 micron thick to achieve highly IR-reflective surfaces. One portion of ellipsoid was partially covered with the tape to reduce the reflection of IR light. The optical waveguide structure was formed by assembling the two elliptical structure. Then, the IR light source (IR-50, Hawkeyes Inc., USA) and detectors (C

2

H

5

OH sensor: HIS A21 F3.45, Reference IR: HIS A21 F3.91, Heimann GMBH, Germany) were mounted on the subsidiary PCBs (printed circuit boards). After assembling the optical components including the IR source, optical waveguide and the IR detectors, the assembly was mounted onto the main PCB as shown in Fig.

2 a). The completed device was used to test and acquire the properties of the ethanol gas sensor under varied ambient temperatures and ethanol gas concentrations.

The main PCB consisted of five components as block diagramed in Fig. 2 c): power sources (analog and digital power sources were separated to diminish the fluctuation of digital power supply voltage during the driving of IR source), the pulse generation circuitry for driving the IR light source, analog-to- digital converting circuit, micro-controller unit (MCU, F351 C8051, Silicon Labs) and peripherals, and RS 485 communication port for data communication with a computer. Pulse-on and off Fig. 1. Modeling of the optical components: a) IR source, b) IR

detector, c) optical waveguide structure.

(3)

times of 100 ms and 300 ms, respectively, were found to be optimal for the IR source and detectors used. The output voltages of IR detectors were amplified with a small offset operational amplifier (MAX 4239, Maxim integrated

TM

) to ensure that variation of output voltages due changes of ethanol concentration could be observed.

2.3 Experimental setup

After implementing the basic algorithm into the MCU, the prototyped ethanol gas sensor was installed in the gas measurement system as described in previous article. [12,15]

Then the temperature of system was increased from 253 K to 333 K in 20 K steps. Once the temperature and zero ethanol concentration had stabilized, the dry ethanol gas was injected into the gas chamber by a mass flow controller (MFC). The temperature of the gas chamber was also measured by the

temperature/humidity sensor module located inside the gas chamber, and the concentration of injected ethanol gas was analyzed by the gas monitoring system (INNOVA 1312, Netherland). The information from the prototyped ethanol gas sensor was downloaded to the main computer through the RS485 ports in order to analyze the outputs of sensors: two ethanol and temperature sensors. The output voltages of the sensors were collected for sufficient time (more than 100 s) after injecting and stabilizing ethanol gas concentrations. Then the average values of each measurement were calculated to analyze the properties of each sensor and also to derive the formulas to compensate for ambient temperature effects. Finally, the temperature compensation algorithm was implanted in the MCU and the concentrations of ethanol gas from 253 K to 333 K were estimated.

3. RESULTS AND DISCUSSIONS

Figure 3 shows the simulation of radiation energy for different waveguide structures. When the input power was 600 mW, the peak wavelength was around 3.51 μm. As can be seen in Fig. 3 a) and b), the IR light tend to be focused onto a small spot with a diameter less than 1 mm due to the property of ellipsoid, and the energies on the two detectors are similar (67.7 mW and 65.3 mW).

When the optical path was partially blocked with a perfect absorber (6 cm), the irradiated energy decreased from 64.6 mW to 27.6 mW. Under these conditions, the output voltages of two Fig. 2. Developed NDIR ethanol gas sensor module: a) photo of top-

side, b) photo of bottom-side, c) block diagram of signal con- ditioning circuit.

Fig. 3. Simulation results of irradiation energy at the detectors

according to the waveguide structures: a) and b) intact optical

path, c) and d) with partially blocked (6 cm) optical path.

(4)

ethanol detectors would be dependent on the irradiation energy at the active areas of each detector.

Figure 4 shows the output voltages of two ethanol sensors and a temperature sensor at 0 ppm ethanol in ambient temperatures from 253 K to 333 K. All output voltages show linear temperature dependencies with determination coefficients, R

2

> 0.993: the intact ethanol sensor showed , partially blocked ethanol sensor was fitted to , and the slope of temperature sensor was 15 mV/K.

The output voltages of ethanol gas sensors are shown in Fig. 5 as a function of ethanol concentrations from 253 K to 333 K. The output voltages of the partially blocked sensor are roughly seven times smaller than that of the intact structure. However, the output voltages showed exponential decays as the concentration of ethanol gas increased. As the output voltage is sensitive to the ethanol concentration, this can be used to determine the ethanol gas concentration as shown in the previous article [6]. In this device, the measured concentration of ethanol gas is given by the mean value of two separated estimations of ethanol gas concentrations from each sensor.

The mean estimated concentrations of ethanol gas are shown in Fig. 6 from 253 K to 333 K. Below 200 ppm ethanol concentration, the estimation errors are roughly 20 to 25%, however, the errors above 200 ppm decreased to within -10 to 1%

of the real ethanol concentration from 253 K to 333 K ambient temperature. It means that the estimation of ethanol concentration predicted slightly high values at low ethanol concentrations even though the estimations at high ethanol concentrations were lower than the real concentration. As a result, more detailed compensation methods should be devised to enhance the performance of unique ethanol gas sensor developments. As two

identical detectors are used to determine the ethanol concentration, the voltage ratio between the intact structure and the blocked structure gives some advantages: compensation for the ageing of the IR source and large values for digitizing it as a function of ethanol concentrations.

y = 0.1677 7.3 10 + ×

3

T y = 0.1518 8 10 + ×

4

T Fig. 4. Output voltages of two ethanol gas detectors (partially

blocked and intact structures) and temperature sensor at 0 ppm ethanol concentration.

Fig. 5. Temperature dependencies of output voltages of ethanol gas sensors as a function of ethanol gas concentrations: a) par- tially blocked (6 cm) sensor, b) intact ethanol sensor.

Fig. 6. Estimated vs. real ethanol gas concentrations from 253K to

333K temperature variations.

(5)

4. CONCLUSION

In this research, a unique ethanol gas sensor with an elliptical waveguide structure has been simulated to understand the optical properties. Based upon the simulation results, two identical ethanol detectors were used to measure the variations of output voltages in order to estimate the concentration of ethanol gas. By averaging the two estimations, the concentrations of ethanol gas were well estimated under ambient temperatures from 253 K to 333 K with −10 to +1% estimation errors. The accuracy of the sensor at low concentrations could be enhanced by using the voltage ratio to predict the estimated concentration.

ACKNOWLEDGEMENT

This research was supported by the R&D Center for Green Patrol Technologies through the R&D for Global Top Environmental Technologies funded by Ministry of Environment, Republic of Korea (MOE). This research was supported by Korea National University of Transportation in 2016 also and the authors would like to thank Mr. Sang-Ho Shin for the modeling of sensor structures.

REFERENCES

[1] S.E. Moon, H.K. Lee, N.J. Choi, J. Lee, C.A. Choi, W.S.

Yang, J. Kim, J.J. Jong, and D.J. Yoo, “Low power con- sumption micro C

2

H

5

OH gas sensor based on micro-heater and screen printing technique”, Sens. Actuators B-Chem., Vol. 187, pp. 598-603, 2013.

[2] Y. Kwon, H. Kim, S. Lee, I.J. Chin, T.Y. Seong, W.I. Lee, and C. Lee, “Enhanced ethanol sensing properties of TiO

2

nanotube sensors”, Sens. Actuators B-Chem., Vol. 173, pp.

441-446, 2012.

[3] X. L. Cheng, Z. Rong, X.F. Zhang, Y.M. Xu, S. Gao, H.

Zhao, and L.H. Huo, “In situ assembled ZnO flower sensors based on porous nanofibers for rapid ethanol sensing”, Sens.

Actuators B-Chem., Vol. 188, pp.425-432, 2013.

[4] A. Modjtahedi, A. Amirfazli, and S. Farhad, “Low catalyst loaded ethanol gas fuel cell sensor”, Sens. Actuators B- Chem., Vol. 234, pp. 70-79, 2016.

[5] B. Hök, H. Petterson, A.K. Andersson, S. Hassl, and P.

Åkerlund,, “Breath analyzer for alcoholocks and screening devices”, IEEE Sens., J., Vol. 10, pp. 10-15, 2010.

[6] J.H. Kim, K.H. Lee, and S.H. Yi “NDIR ethanol gas sensor with two elliptical optical structures”, Procedia Eng., Vol.

168, pp. 359-362, 2016.

[7] C. Hummelgård, I. Bryntse, M. Bryzgalov, J. Henning, H.

Martin, M. Norén, and H. Rödjegård, “Low-cost NDIR based sensor platform for sub-ppm gas detection”, Urban Climate, Vol. 14, pp. 342-350, 2015.

[8] R. Rubio, J. Santander, L. Fonseca, N. Sabaté, I. Gràcia, C.

Cané, S. Udina, and S. Marco, “Non-selective NDIR array for gas detection”, Sens. Actuators B-Chem., Vol. 127, pp.

69-73, 2007.

[9] H. Kudo, M. Sawai, Y. Suzuki, X. Wang, T. Gessei, D.

Takahashi, T. Arakawa, and K. Mitsubayashi, “Fiber-optic bio-sniffer (biochemical gas sensor) for high-selective mon- itoring of ethanol vapor using 335 nm UV-LED”, Sens.

Actuators B-Chem., Vol. 147, pp. 676-680, 2010.

[10] B.A. Matveev, G.A. Gavrilov, V.V. Evstropov, N.V. Zotova, S.A. Karandashov, G. Yu. Sotnikova, N.M. Stus, G.N. Talal- akin, and Mainen, “Mid-infraed (3-5µm) LEDs as sources for gas and liquid sensors”, Sens. Actuators B-Chem., Vol.

39, pp. 339-343, 1997.

[11] J. Hodgkinson, R. Smith, W.O. Ho, J.R. Saffell, and R. P.

Tatam, “Non-dispersive infrared (NDIR) measure-ment of carbon dioxide at 4.2 µm in a compact and optically effi- cient sensor”, Sens. Actuators B-Chem., Vol. 186, pp. 580- 588, 2013.

[12] J.S. Park and S.H. Yi, “Non-dispersive infrared ray CH

4

gas sensor using focused infrared beam structures”, Sens.

Mater., Vol. 23, pp. 147-158, 2011.

[13] H.G.E. Martin, U.S. Patent 6,194,735 B1, 2001.

[14] H.S. Lim, T.Y. Kim and J.S. Lee, Korea Patent 1009596110000, 2010.

[15] S.H. Yi, “Temperature compensation methods of non-dis-

persive infrared CO

2

gas sensor with dual ellipsoidal optical

waveguide”, Sens. Mater., Vol. 29, pp. 243-252, 2017.

수치

Fig. 3. Simulation results of irradiation energy at the detectors according to the waveguide structures: a) and b) intact optical path, c) and d) with partially blocked (6 cm) optical path.
Fig. 6. Estimated vs. real ethanol gas concentrations from 253K to 333K temperature variations.

참조

관련 문서

웹 표준을 지원하는 플랫폼에서 큰 수정없이 실행 가능함 패키징을 통해 다양한 기기를 위한 앱을 작성할 수 있음 네이티브 앱과

_____ culture appears to be attractive (도시의) to the

At high temperature. During gas molecular collisions, kinetic energy is temporarily converted into potential energy. As the average intermolecular distance increases, the

– A collection of molecules (or atoms) in continuous random motion – Average speeds increases as T is raised.. – The molecules of a gas are widely separated (negligible

- quadriceps tendon 이 슬개골 하연에서 tibial tuberocity에 부착.

In the chapters of Journey of Renewal that describe the Mission Accountability Framework there will be flashbacks to the story of Richmond Corps, showing clearly how

The “Asset Allocation” portfolio assumes the following weights: 25% in the S&P 500, 10% in the Russell 2000, 15% in the MSCI EAFE, 5% in the MSCI EME, 25% in the

1 John Owen, Justification by Faith Alone, in The Works of John Owen, ed. John Bolt, trans. Scott Clark, "Do This and Live: Christ's Active Obedience as the