Anti-Obesity Effects of Artemisia annua Extract in Zucker Fatty Rats and High-Fat Diet Sprague Dawley Rats through Upregulation of Uncoupling Protein 1
Eun-Yong Choi
1, Chan Young Park
1, Seong Hyun Ho
2, Su-Jin Park
2, Donghyun Kim
3,4, Byoungduck Han
5,*, Seon-Hee Kim
1,*
1
Sungkyun Biotech Co., Ltd., Suwon;
2G&P Bioscience Co. LTD., Goyang; Departments of
3Biomedical Sciences and
4Microbiology and Immunology, Seoul National University College of Medicine, Seoul;
5Department of Family Medicine, Korea University Guro Hospital, Korea University College of Medicine, Seoul, Korea
Background: Obesity is a widespread disease and is caused mainly by excessive adipocyte differentiation and fat accumulation. Peroxisome proliferation-activated receptor γ (PPARγ) and CCAAT/enhancer-binding proteins (C/EBP) are major components for regulating adipocyte differentiation. Uncoupling protein 1 (UCP1) is a trans- membrane protein that can convert white fat to brown adipose tissue. Artemisia annua L. has long been used in East Asia as an herbal drug for anti-oxidant, anti-bacterial, and anti-obesity purposes.
Methods: We investigated the effects of water extracts of A. annua (WEAA) in C3H10T1/2, a mesenchymal stem cell line, by measuring the level of intracellular fat accumulation and the expression of genes associated with adipocyte differentiation. We also evaluated anti-obesity effects of WEAA in Zucker rats, a genetic model for the study of obesity, and in Sprague Dawley rats with high-fat diet (HFD)-induced obesity.
Results: In this study, WEAA reduced the expression levels of PPARγ and C/EBPα in C3H10T1/2 cells, as well as the expression of enzymes that regulate fatty acid metabolism. In the Zucker fatty rat model and the HFD-induced obesity rat model, WEAA significantly decreased adipogenic differentiation and white fat accumulation between the scapulae, in contrast to the brown fat that remained unchanged between the groups. A. annua suppressed the expression of the adipocyte differentiation-promoting genes, while increasing the expression of UCP1.
Conclusion: These results indicated that WEAA could reduce adipocyte differentiation and fat accumulation in in vitro and in vivo model systems, resulting in suppression of obesity and the occurrence of fatty liver due to a HFD.
Key words: Artemisia annua, Obesity, Adipogenesis, Uncoupling protein 1, Non-alcoholic fatty liver diseases
Received September 18, 2020 Reviewed October 30, 2020 Accepted December 2, 2020
* Corresponding author Seon-Hee Kim
https://orcid.org/0000-0003-4079-2594 Sungkyun Biotech Co., Ltd.,
142-10 Saneop-ro 156beon-gil, Gwonseon-gu, Suwon 16648, Korea Tel: +82-31-299-4811
Fax: +82-31-739-5852
E-mail: [email protected]
* Co-Corresponding author Byoungduck Han
https://orcid.org/0000-0003-2830-1174 Department of Family Medicine, Korea University Guro Hospital, Korea University College of Medicine, 148 Gurodong-ro, Guro-gu, Seoul 08308, Korea Tel: +82-2-2626-1547 Fax: +82-2-837-3966 E-mail: [email protected]
Copyright © 2021 Korean Society for the Study of Obesity
This is an Open Access article distributed under the terms of the Creative Commons Attribution Non-Commercial License (https://creativecommons.org/licenses/by-nc/4.0/) which permits unrestricted non-commercial use, distribution, and reproduction in any medium, provided the original work is properly cited.
eISSN 2508-7576
2017-03-16 https://crossmark-cdn.crossref.org/widget/v2.0/logos/CROSSMARK_Color_square.svg
Original Article
INTRODUCTION
Obesity, a medical condition that involves accumulation of ex- cessive body fat, is a widespread disease all over the world and re- mains one of the largest issues in health care.
1Diverse medical dis-
eases are associated with obesity, such as hyperlipidemia, type 2 di-
abetes, atherosclerosis, hypertension, and cardiovascular disease.
2-5Obesity is caused by an increase in adipocyte size (hypertrophy)
and production of new adipocytes (hyperplasia).
6Understanding
the regulation of adipocytes can provide strategies for treating obe-
Anti-Obesity Effects of Artemisia annua Extract in Zucker Fatty Rats and High-Fat Diet Sprague Dawley Rats through Upregulation of Uncoupling Protein 1
Eun-Yong Choi
1, Chan Young Park
1, Seong Hyun Ho
2, Su-Jin Park
2, Donghyun Kim
3,4, Byoungduck Han
5,*, Seon-Hee Kim
1,*
1
Sungkyun Biotech Co., Ltd., Suwon;
2G&P Bioscience Co. LTD., Goyang; Departments of
3Biomedical Sciences and
4Microbiology and Immunology, Seoul National University College of Medicine, Seoul;
5Department of Family Medicine, Korea University Guro Hospital, Korea University College of Medicine, Seoul, Korea
Background: Obesity is a widespread disease and is caused mainly by excessive adipocyte differentiation and fat accumulation. Peroxisome proliferation-activated receptor γ (PPARγ) and CCAAT/enhancer-binding proteins (C/EBP) are major components for regulating adipocyte differentiation. Uncoupling protein 1 (UCP1) is a trans- membrane protein that can convert white fat to brown adipose tissue. Artemisia annua L. has long been used in East Asia as an herbal drug for anti-oxidant, anti-bacterial, and anti-obesity purposes.
Methods: We investigated the effects of water extracts of A. annua (WEAA) in C3H10T1/2, a mesenchymal stem cell line, by measuring the level of intracellular fat accumulation and the expression of genes associated with adipocyte differentiation. We also evaluated anti-obesity effects of WEAA in Zucker rats, a genetic model for the study of obesity, and in Sprague Dawley rats with high-fat diet (HFD)-induced obesity.
Results: In this study, WEAA reduced the expression levels of PPARγ and C/EBPα in C3H10T1/2 cells, as well as the expression of enzymes that regulate fatty acid metabolism. In the Zucker fatty rat model and the HFD-induced obesity rat model, WEAA significantly decreased adipogenic differentiation and white fat accumulation between the scapulae, in contrast to the brown fat that remained unchanged between the groups. A. annua suppressed the expression of the adipocyte differentiation-promoting genes, while increasing the expression of UCP1.
Conclusion: These results indicated that WEAA could reduce adipocyte differentiation and fat accumulation in in vitro and in vivo model systems, resulting in suppression of obesity and the occurrence of fatty liver due to a HFD.
Key words: Artemisia annua, Obesity, Adipogenesis, Uncoupling protein 1, Non-alcoholic fatty liver diseases
Received September 18, 2020 Reviewed October 30, 2020 Accepted December 2, 2020
* Corresponding author Seon-Hee Kim
https://orcid.org/0000-0003-4079-2594 Sungkyun Biotech Co., Ltd.,
142-10 Saneop-ro 156beon-gil, Gwonseon-gu, Suwon 16648, Korea Tel: +82-31-299-4811
Fax: +82-31-739-5852
E-mail: [email protected]
* Co-Corresponding author Byoungduck Han
https://orcid.org/0000-0003-2830-1174 Department of Family Medicine, Korea University Guro Hospital, Korea University College of Medicine, 148 Gurodong-ro, Guro-gu, Seoul 08308, Korea Tel: +82-2-2626-1547 Fax: +82-2-837-3966 E-mail: [email protected]
sity and obesity-related diseases.
Adipocyte differentiation is a process of cell differentiation in which preadipocytes become adipocytes.
7Differentiation is regu- lated by diverse intracellular proteins, including adipogenic and lip- ogenic-related proteins and other metabolic signal transduction proteins.
8,9Peroxisome proliferation-activated receptor γ (PPARγ) and CCAAT/enhancer-binding proteins (C/EBPα, -β, and δ) are major components that work cooperatively to control adipocyte differentiation.
10,11Uncoupling protein 1 (UCP1), also called ther- mogenin, is a transmembrane protein found in the mitochondria of brown adipose tissue and is associated with heat generation by non-shivering thermogenesis.
12,13Increased UCP1 expression is closely related to anti-obesity properties in mice
14,15and can be a useful defense mechanism against obesity by stimulating intracellu- lar energy consumption and regulating adipocyte differentiation.
Artemisia annua, also known as annual mugwort, sweet worm- wood, or sweet annie, is an annual herb belonging to the family As- teraceae and is commonly found in parts of Asia, including China and Korea. Traditionally, A. annua has been used to treat heat and chills in China.
16Artemisinin and its derivatives, which are compo- nents of A. annua, have been widely used as anti-malarial drugs and are effective anti-cancer and anti-viral agents.
17,18Artemisinic acid, isolated from A. annua, inhibits adipocyte differentiation in human adipose tissue-derived mesenchymal stem cells
19while essential oil from A. annua has anti-adipocyte differentiation effects in 3T3-L1 cells.
20However, the anti-obesity effects of A. annua are unknown in C3H10T1/2 cells and transgenic animal models. In this study, we investigated the effects of water extracts of A. annua (WEAA) in C3H10T1/2 cells by measuring the level of intracellular fat accu- mulation and the expression of genes associated with adipocyte differentiation. We also evaluated anti-obesity effects in Zucker rats, a genetic model for the study of obesity, and in Sprague Dawley (SD) rats with high-fat diet (HFD)-induced obesity.
METHODS
Preparation of A. annua extracts and Garcinia cambogia extracts
A. annua was purchased from the Korean commercial market.
Chopped A. annua was extracted with water for 4 hours at 85°C and filtered through filter paper (Whatman 3; GE Healthcare, Chi- cago, IL, USA). The filtrate was concentrated to 50 brix at a tem- perature below 60°C, and this concentrate was used for the in vitro assay. For the in vivo experiment, the concentrate was mixed with 30% dextrin and then powdered with a spray dryer. The A. annua content, which was used in in vitro and in vivo experiments, was cal- culated based on 100% total solids.
Cell culture and adipocyte differentiation
The murine mesenchymal stem cell line, C3H10T1/2, was ob- tained from the American Type Culture Collection. Cells were cul- tured in Dulbecco’s modified Eagle’s medium (Hyclone, Marlbor- ough, MA, USA) supplemented with 10% fetal bovine serum (Hy- clone) and 1% penicillin-streptomycin solution (Hyclone) at 37°C in a humidified 5% CO
2incubator.
To induce adipocyte differentiation, C3H10T1/2 cells were seed- ed at a density of 5× 10
4cells/well in 6-well plates and were grown in differentiation-inducing media containing 1 μM dexamethasone (Sigma, St. Louis, MO, USA), 0.5 mM 3-isobutyl-1-methylxanthine (Sigma), 5 μg/mL insulin (Sigma), and 10 μM troglitazone (Sigma) for the first 2 days. Then, the medium was replaced with medium containing only 5 μg/mL insulin (Sigma) and 10 μM troglitazone (Sigma), which was replaced every 2 days for 6–7 days.
Cell viability assay
C3H10T1/2 cells were exposed to serial concentrations of WEAA during adipocyte differentiation for 7 days. For the viability test, MTT (AppliChem, Darmstadt, Germany) solution was pre- pared at a final concentration of 0.5 mg/mL in the media. After 4 hours, the media was removed and 100 μL of dimethyl sulfoxide were added to dissolve the formazan. Next, the absorbance was measured at 540 nm using a SpectraMax M2/M2e Microplate Reader (Molecular Devices, San Jose, CA , USA).
Oil red O staining
To measure lipid content in the cells, cells were fixed with 4%
formaldehyde (Sigma) for 1 hour, stained with 0.5% Oil red O so-
lution for 30 minutes on a shaker, and then washed with water
three times. The stained cells were dissolved in 1 mL 100% isopro-
pyl alcohol to quantify the lipid content, and the absorbance of the solution was measured at 520 nm using a SpectraMax M2/M2e Microplate Reader (Molecular Devices).
Quantitative real-time polymerase chain reaction (PCR)
Total RNA from C3H10T1/2 cells was isolated with NucleoZOL (Macherey-Nagel, Düren, Germany) according to the manufactur- er’s protocols. cDNA was synthesized using 0.5 μg total RNA with a ReverTra Ace qPCR RT Master Mix kit (Toyobo, Osaka, Japan).
Synthesized cDNA was amplified with the target gene primers and THUNDERBIRD SYBR qPCR Mix (Toyobo) using the Quant- Studio 3 Real-Time PCR System (Applied Biosystems, Foster City, CA, USA). Relative gene expression data were normalized to 36B4 gene expression. Primer sequences are as listed below: acidic ribo- somal phosphoprotein P0 (36B4), forward 5´-AGATGCAGCA- GATCCGCAT-3´ and reverse 5´-GTTCTTGCCCATCAGCA- CC-3´; C/EBP-α, forward 5´-GTGTGCACGTCTATGCTAAAC- CA-3´ and reverse 5´-GCCGTTAGTGAAGAGTCTCAGTTTG-3´;
adipocyte binding protein 2 (aP2), forward 5´-CACCGCAGAC- GACAGGAA-3´ and reverse 5´-GCACCTGCACCAGGGC-3´;
cluster of differentiation 36 (CD36), forward 5´-GGCCAAGC- TATTGCGACAT-3´ and reverse 5´-CAGATCCGAACACAGC- GTA-3´; adiponectin, forward 5´-CCGGAACCCCTGGCA-3´ and reverse 5´-CTGAACGCTGAGCGATACACA-3´; PPARγ, forward 5´-TTCGCTGATGCACTGCCTA-3´ and reverse 5´-GGAATGC- GAGTGGTCTTCCA-3´; acetyl-CoA carboxylase (ACC), forward 5´-GCCTCAGGAGGATTTGCTGT-3´ and reverse 5´-AGGAT- CTACCCAGGCCACAT-3´; fatty acid synthase (FAS), forward 5´-CAAGTGTCCACCAACAAGCG-3´ and reverse 5´-GGAGC- GCAGGATAGACTCAC-3´; stearoyl-CoA desaturase-1 (SCD-1), forward 5´-AGGTTTCCAAGCGCAGTTCC-3´ and reverse 5´- CTGGAAGCTCACCTCTTGGAGC-3´; UCP-1, forward 5´- AAGCGTACCAAGCTGTGC-3´ and reverse 5´-AGAAAAGAA- GCCACAAAG-3´.
Western blot
Harvested C3H10T1/2 cells were lysed with radioimmunopre- cipitation assay buffer (Thermo Scientific, Waltham, MA, USA) containing protease and phosphatase inhibitor cocktail (Thermo Scientific). Proteins (20 μg/well) were separated by 10%–15% so-
dium dodecyl sulfate-polyacrylamide gel electrophoresis, trans- ferred to a nitrocellulose membrane (GE Healthcare, Boston, MA, USA), and then blocked with 5% bovine serum albumin for aP2 antibody (Cell Signaling Technology, Danvers, MA, USA; #2120) or with 5% skim milk for the PPARγ (Santa Cruz Biotechnology, Santa Cruz, CA, USA; #sc-7273), C/EBPα (Cell Signaling Tech- nology, #2295), and UCP1 (Abcam, Cambridge, MA, USA;
ab10983) antibodies. Primary antibodies were incubated on the membrane overnight at 4°C. The membrane was then washed with Tris-buffered saline-Tween 20 (TBST) three times, incubated in the secondary antibody in 5% skim milk at room temperature for 2 hours, and then washed with TBST five times. Protein activities were detected with enhanced chemiluminescence (ECL; Amersh- am ECL Prime Western Blotting Detection Reagent; GE Health- care) and protein levels were quantified with ImageJ version 1.8.0 (National Institutes of Health, Bethesda, MD, USA).
Animals and experimental groups
Zucker lean rats (Lean fa/+) and Zucker fatty (ZF) rats (fa/fa) (male, 5 weeks) were purchased from RaonBio (Yongin, Korea).
The experimental groups were as follows: (1) a Zucker lean vehicle group (ZL, n= 5); (2) a ZF vehicle group (ZF, n= 5); and (3) a ZF+50 mg/kg WEAA group (ZF+WEAA, n= 5). Food (Teklad certified global 18% protein rodent diet 2918C; Teklad, Envigo, Indianapolis, IN, USA) and water were provided ad libitum. Oral administration of vehicle or WEAA was started on the day after separation into groups and regularly performed once a day for 11 weeks. Body weight and food intake were checked once a week.
Body fat mass was measured using dual energy X-ray absorptiome- try (InAlyzer; Medikors, Hovedstaden, Denmark) after the animals were anesthetized with isoflurane. Fat in tissue was calculated as follows.
Fat in tissue (%)= fat mass/(total body mass–bone mineral con- tent)× 100
In addition, the organs were extracted and their weights were measured. This study was performed with approval by the Animal Research Ethics Committee of KPClab (approval No. P182016).
SD rats (male, 5 weeks old) were purchased from Orientbio
(Seongnam, Korea). After 1 week of acclimation, SD rats were ran-
domly divided into three groups (n= 9) in individual cages. The
experimental groups were as follows: (1) a SD vehicle group with a normal diet (ND+water, n=9); (2) SD vehicle group with a HFD+
water, (n= 9); and (3) SD rats with a high fat diet+200 mg/kg ex- tract of A. annua group (HFD+WEAA, n=9). Water and either a normal diet (Laboratory Animal Feed; Cargill Agri Purina, Minne- apolis, MN, USA) or HFD (60% fat; Research diet, New Brunswick, NJ, USA) were provided ad libitum. Oral administration was per- formed once a day for 7 weeks, and body weights and food intake were measured weekly. This study was performed with a protocol approved by the Animal Research Ethics Committee of Knotus (approval No. 18-KE-253).
Micro-computed tomography analysis
Before sacrifice, micro-computed tomography (CT; vivaCT 80, Scanco Medical, Brüttisellen , Switzerland) was performed to mea- sure total fat, which exists in the space between the origin of the second lumbar vertebrae and the fifth lumbar vertebrae. The fat volume was estimated using micro-CT software.
Biochemical analysis
After the animal was anesthetized with isoflurane, blood was col- lected and centrifuged at 3,000 rpm for 10 minutes. Serum was an- alyzed for high-density lipoprotein (HDL) cholesterol, low-density lipoprotein (LDL) cholesterol, and total cholesterol (TC), as well as triglyceride (TG), alanine aminotransferase (ALT), and aspar- tate aminotransferase (AST) using a blood biochemical analyzer (7180; Hitachi, Tokyo, Japan).
Histological analysis
Abdominal adipose tissues were examined for histopathological evaluation. The fixed tissues were subjected to general histological processes, such as dehydration, paraffin embedding, and cutting.
Hematoxylin and eosin staining was performed, and histopatho- logical changes were evaluated by observation using an optical mi- croscope (Olympus BX53, Tokyo, Japan).
Statistical analysis
All experimental results are expressed as the mean± standard de- viation, and Student t-tests were performed using GraphPad Prism software version 5.01 (GraphPad Software, San Diego, CA, USA).
One-way analysis of variance (ANOVA) and Dunnett post-test were performed to identify significant differences between animal groups, and two-way ANOVA and Bonferroni post-tests were per- formed for statistical analyses. A P<0.05 was considered statistical- ly significant.
RESULTS
Effect of WEAA on lipid accumulation in C3H10T1/2 cells
To examine how WEAA affected lipid deposition during adipo- cyte differentiation in C3H10T1/2 cells, we treated cells with vari- ous concentrations of WEAA for 6 days with adipocyte differentia- tion-inducing reagent. We confirmed that the red color of lipid drop- lets stained with Oil red O faded in a WEAA dose-dependent man- ner, suggesting that WEAA treatment remarkably inhibited lipid accumulation in C3H10T1/2 cells (Fig. 1A). To quantify the amount of intracellular lipids, stained lipid droplets were dissolved in 100%
isopropanol to measure the absorbance, and the results were com- pared to the untreated group. The lipid content in each group was estimated to be 91.95%± 0.32% (500 μg/mL WEAA), 79.68%±
0.57% (750 μg/mL WEAA), and 33.26%± 0.15% (1,000 μg/mL WEAA), respectively (Fig. 1B). To confirm whether the reduction of lipid accumulation was caused by WEAA cytotoxicity, a cell via- bility assay was conducted using various WEAA concentrations.
After growing cells to confluence, WEAA and adipocyte differenti- ation-inducing reagents were added to the cells for 6 days and a thi- azolyl blue tetrazolium bromide (MTT) assay was performed. When compared with the untreated group, the cell survival rate increased in all WEAA-treated groups, and it was confirmed that WEAA treat- ment did not induce cell death (Fig. 1C). These findings suggested that WEAA attenuated adipocyte differentiation, possibly resulting in anti-obesity effects.
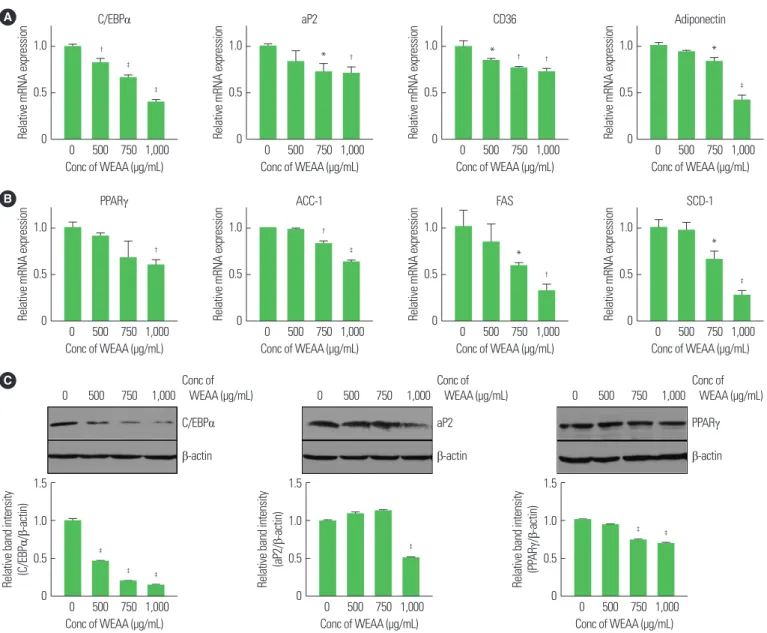
Effect of WEAA on mRNA and protein expression of adipogenic and lipogenic genes
As shown in Fig. 1, adipocyte differentiation and lipid accumula-
tion were inhibited by WEAA. More specifically, we investigated
whether the expression of genes related to adipocyte differentiation
was affected by WEAA. The mRNA expression of genes relating to
early/late adipocyte differentiation (PPARγ, C/EBPα, aP2, and CD36) and of the adipokine produced primarily from adipocytes (adiponectin) were investigated with or without WEAA treatment during adipocyte differentiation. C/EBPα, aP2, CD36, and adipo- nectin mRNA expression was increased in C3H10T1/2 cells with- out WEAA treatment. However, with WEAA treatment, the mRNA levels of these genes decreased in a dose-dependent manner (Fig.
2A, B). Similarly, the mRNA expression of the lipogenic-related genes ACC-1, FAS, and SCD-1 also declined with WEAA treatment (Fig.
2B). To examine the protein expression of adipogenesis-related genes during differentiation, western blotting was performed to evaluate the protein levels of C/EBPα, aP2, and PPARγ in C3H10T1/2 cells.
PPARγ expression was slightly decreased depending on WEAA concentrations, and aP2 was predominantly reduced at the highest concentration of WEAA (a decrease of 54.32% band intensity in contrast to WEAA-untreated cells). C/EBPα expression was dra- matically decreased at all concentrations compared to cells without WEAA (Fig. 2C).
Effect of WEAA on UCP1 mRNA and protein expression
mRNA levels of UCP1 were increased in a concentration-depen- dent manner when WEAA was added to C3H10T1/2 cells during adipocyte differentiation. In particular, the two WEAA treatment groups showed a significant increase in UCP1 mRNA expression (2.15-fold with 750 μg/mL WEAA and 2.85-fold with 1,000 μg/mL WEAA) compared to the WEAA-untreated control group (Fig. 3A).
We also assessed the protein expression patterns of UCP1 during
C3H10T1/2 differentiation, and found that the protein levels were slightly increased depending on the WEAA concentration (Fig. 3B).
Taken together, the data in Fig. 3 suggest that increasing the expres- sion of UCP1 might be beneficial for cells to consume intracellular energy and to defend against obesity.
Effect of WEAA on the suppression of weight gain and reduction of fat mass in ZF rats
Having confirmed the anti-obesity effects of WEAA in the afore- mentioned in vitro experiments, ZF rats were used as an obesity model to evaluate the effects of WEAA. Zucker lean and fatty rats were administered the test substance described in the Methods once a day for 11 weeks and weighed once a week. The body weights of all experimental groups increased continuously after administra- tion. At 8 weeks, the body weight of the ZF+WEAA group (555.09±
27.55 g) was significantly lower than that of the ZF vehicle control group (593.08± 15.13 g, P=0.027). The significant weight loss of the ZF+WEAA group continued until the end of the experiment.
Body weights measured at 11 weeks showed weight loss rates of 8.44% in the ZF+WEAA group compared to the ZF vehicle con- trol group (P=0.010) (Fig. 4A). Body fat mass was measured at a 77-day follow-up after administration using dual energy X-ray ab- sorptiometry. The body fat mass of the ZF+WEAA group (325.38±
15.95 g) was significantly lower than the ZF vehicle control group (372.34±34.31 g) (P=0.026). In addition, lean mass was decreased in the WEAA group compared with the ZF vehicle control group, but the change was not statistically significant (Fig. 4B). We also Figure 1. Water extract of Artemisia annua (WEAA) inhibits lipid accumulation in C3H10T1/2 cells. (A) Lipid levels estimated by Oil Red O staining in C3H10T1/2 cells ex- posed to different concentrations of WEAA during adipocyte differentiation. (B) Intracellular lipid contents of stained lipid droplets in C3H10T1/2 cells dissolved in 100%
isopropyl alcohol. The absorbance of the solution was measured at 520 nm. (C) Cytotoxicity of WEAA, as evaluated using a thiazolyl blue tetrazolium bromide (MTT) assay.
Results are expressed relative to the WEAA-untreated positive controls. The indicated images are representative of at least three independent experiments. Values are presented as mean± standard deviation and are significantly different from the WEAA-untreated positive controls, *P< 0.05;
†P< 0.01;
‡P< 0.001. Conc, concentration.
A Conc of WEAA (μg/mL)
0 500 750 1,000
C 150
100
50
0
% Cell viability
0 500 750 1,000
*
†
*
Conc of WEAA (μg/mL) B
‡
‡
‡
120 100 80 60 40 20 Optical density of Oil Red O (% of control) 0
250 500 750 1,000
Conc of WEAA (μg/mL)
analyzed the relative weight of fat tissue to confirm the effects of WEAA on anatomical aspects. Relative interscapular brown fat was increased in the ZF+WEAA (1.26-fold) groups compared to that in the ZF vehicle group (Fig. 4C). Moreover, it was confirmed that the amount of fat in the tissue of the ZF+WEAA group was lower than that in the ZF vehicle control group (Fig. 4D).
Effect of WEAA on body weight gain, fat tissue weight, and adipocyte size in HFD-induced obesity SD rats
We also investigated the effects of WEAA on a HFD-induced obesity model. SD rats were fed a 60% HFD for 49 days to induce obesity. The body weights of all HFD-induced obesity groups were significantly higher than that of the normal diet group from the start date of the test to the end of the test (P<0.001). The HFD+
Figure 2. Water extract of Artemisia annua (WEAA) suppresses mRNA and protein expression of adipogenic and lipogenic factors. C3H10T1/2 cells were treated with the indicated concentration of WEAA upon adipocyte differentiation. (A, B) mRNA expression of adipogenic and lipogenic genes, as evaluated by real time polymerase chain reaction. Relative mRNA expression was normalized to 36B4 gene expression. (C) CCAAT/enhancer-binding proteins (C/EBPα), adipocyte binding protein (aP2), and peroxi- some proliferation-activated receptor (PPARγ) protein expression, as detected by Western blotting. Proteins were isolated using radioimmunoprecipitation assay buffer containing protease and phosphatase inhibitor cocktail. β-actin was used as a loading control. Band intensity was calculated using ImageJ software (data not shown). The results are representative of at least three independent experiments. Values are presented as mean± standard deviation and are significantly different from the WEAA-un- treated positive controls, *P< 0.05;
†P< 0.01;
‡P< 0.001. Conc, concentration; CD36, cluster of differentiation 36; ACC, acetyl;-CoA carboxylase; FAS, fatty acid synthase;
SCD-1, stearoyl-CoA desaturase-1.
A 1.0
0.5
Relative mRNA expression 0
0 500 750 1,000
†
‡
‡
Conc of WEAA (μg/mL) C/EBPα
1.0
0.5
Relative mRNA expression 0
0 500 750 1,000
*
‡
Conc of WEAA (μg/mL) Adiponectin 1.0
0.5
Relative mRNA expression 0
0 500 750 1,000
*
†Conc of WEAA (μg/mL) aP2
Conc of WEAA (μg/mL) 1.0
0.5
Relative mRNA expression 0
0 500 750 1,000
*
† †CD36
B 1.0
0.5
Relative mRNA expression 0
0 500 750 1,000
†
Conc of WEAA (μg/mL) PPARγ
1.0
0.5
Relative mRNA expression 0
0 500 750 1,000
*
‡
Conc of WEAA (μg/mL) SCD-1 1.0
0.5
Relative mRNA expression 0
0 500 750 1,000
†
‡
Conc of WEAA (μg/mL) ACC-1
1.0
0.5
Relative mRNA expression 0
0 500 750 1,000
*
†
Conc of WEAA (μg/mL) FAS
C
C/EBPα β-actin Conc of WEAA (μg/mL) 0 500 750 1,000
1.5
1.0
0.5
Relative band intensity (C/EBP α/ β-actin) 0
0 500 750 1,000
‡
Conc of WEAA (μg/mL)
‡
‡
1.5
1.0
0.5
Relative band intensity (PP AR γ/ β-actin) 0
0 500 750 1,000
‡
Conc of WEAA (μg/mL) PPARγ β-actin Conc of WEAA (μg/mL) 0 500 750 1,000
‡
1.5
1.0
0.5
Relative band intensity (aP2/ β-actin) 0
0 500 750 1,000
‡
Conc of WEAA (μg/mL)
aP2
β-actin
Conc of
WEAA (μg/mL)
0 500 750 1,000
B
UCP1 β-actin
Conc of WEAA (μg/mL) 0 500 750 1,000
1.5
1.0
0.5
Relative band intensity (UCP1/ β-actin) 0
0 500 750 1,000
†
Conc of WEAA (μg/mL)
†
†
A 4
3
2
1
0
Relative mRNA expression (UCP1/36B4)
0 500 750 1,000
*
Conc of WEAA (μg/mL)
*
Figure 3. Water extract of Artemisia annua (WEAA) increases uncoupling protein 1 (UCP1) mRNA and protein expression in C3H10T1/2 cells. (A) UCP1 gene expression, as evaluated by real-time polymerase chain reaction. Relative mRNA expression was normalized to 36B4 gene expression. (B) UCP1 protein expression, as detected by Western blotting. β-actin was used as a loading control. Band intensity was calculated using ImageJ software. The results are representative of at least three independent experiments. Values are presented as mean± standard deviation and are significantly different from the WEAA-untreated positive controls, *P< 0.05;
†P< 0.001. Conc, concentration.
Figure 4. Water extract of Artemisia annua (WEAA) reduces body weight gain in Zucker fatty (ZF) rats. Zucker lean (ZL) and ZF rats were orally administered WEAA (50 mg/kg) or water once a day for 11 weeks. (A) Body weight, measured weekly. (B) Body fat mass, as measured using dual energy X-ray absorptiometry after inhalation an- esthesia with isoflurane. (C) Relative interscapular brown fat, calculated as the percent of organ weight/body weight. (D) Fat in tissue, calculated by the fat mass divided by the subtraction of the bone mineral content from the total body mass. The experimental groups are as follows: ZL+water, ZF+water, and ZF+WEAA (50 mg/kg). Values are presented as mean± standard deviation (n= 5). All statistical analyses are calculated compared to the ZF+water group. (A, B) Two-way analysis of variance (ANOVA) followed by the Bonferroni post-test was used; (C, D) one-way ANOVA followed by the Dunnett post-test was used. *P< 0.05;
†P< 0.01;
‡P< 0.001.
B 500
400 300 200 100 0
Body mass (g)
Fat Lean
‡
†
ZL+water ZF+water ZF+WEAA
‡ ‡ ‡ ‡ ‡ ‡ ‡ ‡ ‡ ‡ ‡ ‡
† ‡
* * A 800
700 600 500 400 300 200
Body weight (g)
0 2 4 6 8 10 Time (wk)
ZL+water ZF+water ZF+WEAA
D 80
60
40
20
0
Fat in tissue (%)
ZL+water ZF+water ZF+WEAA
‡
C 0.5
0.4 0.3 0.2 0.1 Relative interscapular brown fat (%) 0
ZL+water ZF+water ZF+WEAA
*
WEAA group tended to lose weight compared to the HFD vehicle group during the entire experimental period, although there was no significant difference (Fig. 5A). In the micro-CT images, in-
creased abdominal fat was observed in the HFD group compared to the normal diet group, whereas abdominal fat was decreased in the HFD+WEAA group compared to the HFD vehicle group (Fig.
Figure 5. Water extract of Artemisia annua (WEAA) suppresses body weight gain and decreases fat tissue weight and adipocyte size in Sprague Dawley (SD) rats with high-fat diet (HFD)-induced obesity. SD rats were orally administered WEAA (200 mg/kg) or water once a day for 7 weeks. SD rats were fed a normal diet or a 60% HFD during the experimental period. (A) Body weight, measured weekly. The experi- mental groups are as follows: (1) SD vehicle group with a normal diet (ND+water, n= 9), (2) SD vehicle group with a HFD (HFD+water, n= 9), and (3) SD rats with a HFD+200 mg/kg WEAA group (HFD+WEAA, n= 9).
(B, C) The micro-computed tomography (CT) image is representative of each experimental group and fat volume was calculated using the micro- CT software. (D) Relative organ weight, calculated as percent of organ weight/body weight. (E) Adipocyte diameter, calculated by measuring at least five adipocyte globules in each abdominal tissue of the experimen- tal group. H&E images are representative of each group (× 100). Scale bars indicate 50 μm. Values are presented as mean± standard deviation (n = 9). All statistical analyses are calculated compared to the HFD+water group. (A, C) Two-way analysis of variance (ANOVA) fol- lowed by the Bonferroni post-test was used; (D, E) One-way ANOVA fol- lowed by Dunnett post-test was used. *P< 0.05;
†P< 0.01;
‡P< 0.001.
C 60,000
40,000
20,000
0 Fat volume (mm
3)
Total fat Abdominal fat
‡
‡
‡
†
ND+water HFD+water HFD+WEAA A 900
800 700 600 Body weight (g) 500
0 2 4 6 Time (wk)
ND+water HFD+water HFD+WEAA
‡ ‡ ‡ ‡ ‡ ‡ ‡ ‡
B ND+water HFD+water HFD+WEAA
D Interscapular brown fat
Relative organ weight (%)
0.20 0.15 0.10 0.05 0
water ND+ HFD+
HFD+ WEAA water
†
Mesenteric fat
Relative organ weight (%)
2.5 2.0 1.5 1.0 0.5 0
water ND+ HFD+
HFD+ WEAA water
‡
*
Epididymal fat
Relative organ weight (%)
2.0 1.5 1.0 0.5 0
water ND+ HFD+
HFD+ WEAA water
‡
*
Retroperitoneal fat
Relative organ weight (%)
4 3 2 1 0
water ND+ HFD+
HFD+ WEAA water
‡
*
ND+water HFD+water HFD+WEAA
E
Adipocyte diameter (μm)
200 150 100 50 0
ND+water HFD+water HFD+WEAA
‡
5B). The total fat volume of all HFD groups was significantly high- er than that of the normal diet group, and the total fat volume of the WEAA group was significantly lower than that of the HFD group (P<0.001). In the same manner, abdominal fat volume was increased in both of the HFD groups compared to the normal diet group, but was reduced in the HFD+WEAA group compared to the HFD vehicle group (P<0.01) (Fig. 5C). We also examined the effects of WEAA on adipose tissue and found that the weights of mesenteric, epididymal, and retroperitoneal fat significantly de- creased in the HFD+WEAA group compared to the HFD vehicle group (P<0.05) (Fig. 5D). In contrast to the white fat tissue, the weight of interscapular brown fat in the WEAA administration group was similar to the brown fat of the HFD vehicle group. His- tological analysis could determine the change in adipocyte cell size depending on the substrate treatment. Compared to the normal diet group, the abdominal adipocyte size of the HFD vehicle group increased by 49.95 μm. In the WEAA-treated group, adipocyte di- ameter decreased by 10.02 μm (Fig. 5E) compared to the HFD ve- hicle group. Images in Fig. 5E show reduced adipocyte size with WEAA administration compared to the HFD vehicle group.
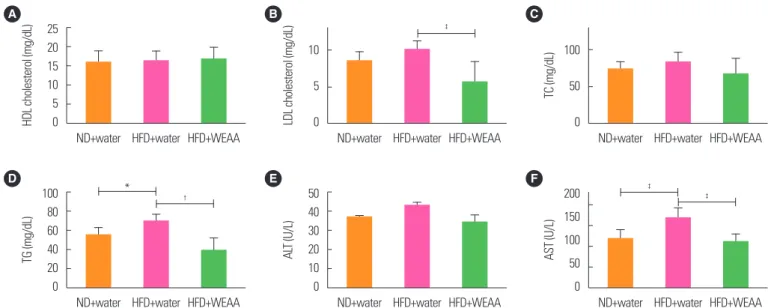
Effect of WEAA on blood serum biochemical factors in HFD-induced obesity SD rats
Biochemical analysis of blood serum revealed that HDL choles- terol levels in the HFD+WEAA group were slightly greater (16.73±
3.33 mg/dL) than in the HFD vehicle group (16.19±2.79 mg/dL), but there was no significant difference (Fig. 6A). LDL cholesterol (Fig. 6B), TC (Fig. 6C), and TG (Fig. 6D) levels were lower in the HFD+WEAA group than in the HFD vehicle group. In particular, LDL cholesterol, and TG levels in the HFD+WEAA group were significantly reduced by 44.3% and 44.8%, respectively (P<0.01, P<0.001). Even though there was no statistical difference, the TC level was decreased by 19.24% in the HFD+WEAA group. Addi- tionally, ALT (Fig. 6E) and aspartate AST (Fig. 6F) levels were in- creased in the HFD group compared to the normal diet group.
WEAA treatment of the HFD group caused considerable reduc- tion of ALT (33.9± 12.4 U/L) and AST (110.6± 17.5 U/L) when compared to the HFD vehicle group (ALT, 42.6± 5.8 U/L; AST, 167.3± 25.2 U/L). Administration of WEAA in HFD-induced obese rats restored ALT and AST serum levels to those of normal rats without HFD administration.
Figure 6. Water extract of Artemisia annua (WEAA) affects the biochemical index of high-fat diet (HFD)-induced obesity in Sprague Dawley (SD) rats. SD rats were orally administered WEAA (200 mg/kg) or water once a day for 7 weeks. SD rats were fed a normal diet or a 60% HFD during the experimental period. The experimental groups are as follows: (1) SD vehicle group with a normal diet (ND+water, n= 9); (2) SD vehicle group with a HFD (HFD+water, n= 9); and (3) SD rats with a HFD+200 mg/kg WEAA group (HFD+WEAA, n= 9). After the animal was anesthetized with isoflurane, blood was collected and centrifuged at 3,000 rpm for 10 minutes. Serum was analyzed for (A) high-density lipoprotein (HDL) cholesterol, (B) low-density lipoprotein (LDL) cholesterol, and (C) total cholesterol (TC), as well as (D) triglyceride (TG), (E) alanine aminotrans- ferase (ALT), and (F) aspartate aminotransferase (AST). Values are presented as mean± standard deviation. One-way analysis of variance followed by Dunnett post-test was performed for statistical analysis. *P< 0.05;
†P< 0.01;
‡P< 0.001.
HDL cholesterol (mg/dL)
25 20 15 10 5 0
ND+water HFD+water HFD+WEAA A
TC (mg/dL)
100
50
0
ND+water HFD+water HFD+WEAA C
LDL cholesterol (mg/dL)
10
5
0
ND+water HFD+water HFD+WEAA B
‡
*
†TG (mg/dL)
100 80 60 40 20 0
ND+water HFD+water HFD+WEAA D
AL T (U/L)
50 40 30 20 10 0
ND+water HFD+water HFD+WEAA E
AST (U/L)
200 150 100 50 0
ND+water HFD+water HFD+WEAA F
‡
‡