www.labmedonline.org 37 eISSN 2093-6338
[3-6]. New clinical applications continue to be reported. The evi- dence to date has provided a compelling demonstration of the analytical validity, clinical validity, and clinical utility of NGS [5-8].
There have been several important milestones for clinical NGS implementation. The United States Food and Drug Administration (FDA) approved the MiSeqDx instrument along with two cystic fi- brosis assays (Illumina, San Diego, CA, USA) and the Ion PGM Dx (ThermoFisher Scientific, Waltham, MA, USA) and Sentosa SQ301 (Vela Diagnostics, Fairfield, NJ, USA) in vitro diagnostic (IVD) tests (https://www.accessdata.fda.gov/scripts/cdrh/cfdocs/cfRL/
rl.cfm?lid=427645&lpcd=PFF and https://www.accessdata.fda.
gov/scripts/cdrh/cfdocs/cfRL/rl.cfm?lid=430009&lpcd=PFF). Sev- eral recommendations and guidelines to the implementation, vali- dation, and reporting of NGS testing have been provided from professional organizations, including the American College of Medical Genetics and Genomics, Association for Molecular Pa- thology, Clinical and Laboratory Standardization Institute (CLSI), and federal agencies like the FDA and the US Centers for Disease Control and Prevention (CDC). Current Procedural Terminology medical code for NGS has been introduced into health care infra- structures worldwide. Proficiency testing (PT)/external quality as- sessment (EQA) programs for NGS have been implemented by ac- creditation bodies, such as the College of American Pathologists,
INTRODUCTION
Over the past decade, next-generation sequencing (NGS), also known as massively parallel sequencing, has evolved at an aston- ishing pace and has revolutionized clinical medicine as well as genomics research [1, 2]. The now-global use of NGS has expanded the understanding regarding the mechanisms of pathogenesis of a variety of diseases, and has revealed a number of genetic altera- tions with diagnostic, prognostic, and therapeutic implications.
Several examples include noninvasive prenatal test, newborn screening, Mendelian diseases, some heritable diseases, oncol- ogy, pharmacogenomics, infectious diseases, and metagenomics
임상유전체분석법의 도입을 위한 필수 요소
Essential Elements for Establishing Clinical Next-generation Sequencing Testing
박경진1·이우창2·전사일2·민원기2
Kyoung-Jin Park, M.D.1, Woochang Lee, M.D.2, Sail Chun, M.D.2, Won-Ki Min, M.D.2
양산부산대학교병원 진단검사의학과1, 서울아산병원 진단검사의학과2
Department of Laboratory Medicine and Biomedical Research Institute1, Pusan National University Yangsan Hospital, Yangsan; Department of Laboratory Medicine2, Asan Medical Center, University of Ulsan College of Medicine, Seoul, Korea
Vol. 9, No. 2: 37-44, April 2019
https://doi.org/10.3343/lmo.2019.9.2.37 진단유전학
Corresponding author: Woochang Lee, M.D., Ph.D.
https://orcid.org/0000-0003-3956-6397
Department of Laboratory Medicine, Asan Medical Center, University of Ulsan College of Medicine, 88 Olympic-ro 43-gil, Songpa-gu, Seoul 05505, Korea Tel: +82-2-3010-4516, Fax: +82-2-478-0884, E-mail: wlee1@amc.seoul.kr Received: April 3, 2018
Revision received: July 8, 2018 Accepted: July 23, 2018
This article is available from http://www.labmedonline.org 2019, Laboratory Medicine Online
This is an Open Access article distributed under the terms of the Creative Commons Attribution Non-Commercial License (http://creativecommons.org/licenses/by-nc/4.0/) which permits unrestricted non-commercial use, distribution, and reproduction in any medium, provided the original work is properly cited.
Over the past decade, next-generation sequencing (NGS) has evolved at an astonishing pace and has revolutionized clinical medicine as well as genomics research. The rapid advancements in NGS technologies have been accompanied by accumulating evidence of the analytical and clinical validity, and clinical utility of NGS. NGS is used worldwide. This review provides medical technicians and laboratory physicians with the essential el- ements for establishing clinical NGS testing. Here the authors briefly describe the advantages and drawbacks of currently available NGS plat- forms, potential sources of error in NGS workflow, and reference materials.
Key Words: Next-generation sequencing (NGS), Quality control (QC), Reference material (RM)
2017-03-16 https://crossmark-cdn.crossref.org/widget/v2.0/logos/CROSSMARK_Color_square.svg
https://doi.org/10.3343/lmo.2019.9.2.37 38 www.labmedonline.org
European Molecular Genetics Quality Network, Korean Associa- tion of External Quality Assessment Service, and other professional organizations. The use of NGS by clinical laboratories worldwide continues to burgeon.
This review provides the essential elements for establishing clin- ical NGS testing, which will be helpful to medical technicians and laboratory physicians in the clinical laboratory setting. We discuss the advantages and drawbacks of currently available NGS platforms and focus on the potential error sources at each step throughout the clinical NGS workflow. Finally, quality control (QC) and refer- ence materials (RMs) for NGS are described. QC aspects through PT/EQA programs have been addressed elsewhere [9, 10].
OVERVIEW OF NGS TECHNOLOGIES
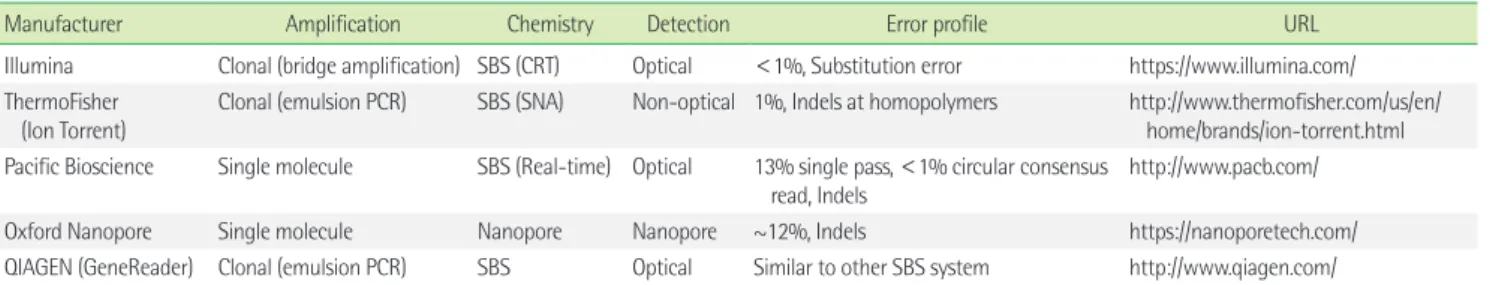
It has been 13 years since NGS technologies appeared on the market. Compared to Sanger sequencing, which is considered the first-generation sequencing, NGS is characterized by multiple short reads generated from thousands-to-millions of sequencing reac- tions in parallel [1, 2]. Improvements in NGS technologies have in- creased the throughput and read length, and have reduced the cost and run time [1, 2]. Readers interested in the technological landscape and evolution of NGS platforms are directed to some previous reviews [1, 2]. This review briefly focuses on the differ- ences between the platforms and platform-specific error profile (Table 1).
The current NGS platforms can be categorized according to three axes (Table 1). The first is cluster generation, which is the amplification vs. single molecule. The second is sequencing chem- istry, which concerns the sequencing by synthesis (SBS, polymerase based) vs. sequencing by ligation (SBL) vs. nanopore. The third is
detection method (optical detection vs. non-optical detection).
When categorized by throughput, the NGS platforms can be cate- gorized as high throughput systems, which include the HiSeq se- ries and the NovaSeq series (Illumina), and benchtop systems, in- cluding MiSeq (Illumina), Ion Torrent Personal Genome Machine/
Proton/S5 (ThermoFisher Scientific), and 454 GS Junior post-com- mercial platform (Roche, Branford, CT, USA). Each platform varies in terms of throughput, cost, read length, and run time.
Understanding the differences between these sequencing plat- forms is important, because some errors are specific to particular NGS platforms. For instance, the pH change in the Ion Torrent system or luminescence signal is imperfectly proportional to the number of nucleotides in case of homopolymer stretches (Table 1). The characteristics frequently result in homopolymer errors in semiconductor sequencing (e.g., Ion Torrent) and pyrosequenc- ing. On the other hand, substitution error occurs more in Illumina platforms, because of sequence-specific interference [11].
While some errors are platform-specific, others, such as short read misalignment and amplification biases, are part of the shared error profile in most NGS methods. GC-rich or GC-poor regions are prone to be poorly amplified and are subject to false positive or false negative results and uneven coverage [11, 12]. In particu- lar, for repeat or pseudogenes, short reads can be misaligned, which can reduce the number of on-target reads. In addition, short reads can lead to significant challenges in analyzing structural variations (SV) or copy number variations (CNVs) and complex RNA splicing patterns. Efforts to overcome these limitations prompted the de- velopment of the Illumina synthetic long-read sequencing plat- form (formerly known as Moleculo) and third-generation sequenc- ing technologies, including those of Pacific Biosciences or the sin- gle molecule real-time sequencing technology (SMRT) of Oxford
Table 1. Summary of major next-generation sequencing
Manufacturer Amplification Chemistry Detection Error profile URL
Illumina Clonal (bridge amplification) SBS (CRT) Optical <1%, Substitution error https://www.illumina.com/
ThermoFisher (Ion Torrent)
Clonal (emulsion PCR) SBS (SNA) Non-optical 1%, Indels at homopolymers http://www.thermofisher.com/us/en/
home/brands/ion-torrent.html Pacific Bioscience Single molecule SBS (Real-time) Optical 13% single pass, <1% circular consensus
read, Indels http://www.pacb.com/
Oxford Nanopore Single molecule Nanopore Nanopore ~12%, Indels https://nanoporetech.com/
QIAGEN (GeneReader) Clonal (emulsion PCR) SBS Optical Similar to other SBS system http://www.qiagen.com/
Abbreviations: PCR, polymerase chain reaction; SBS, sequencing by synthesis; CRT, cyclic reversible termination; SNA, single nucleotide addition; SBL, sequencing by ligation;
indel, insertion/deletion.
Manufacturer’s data is directed to the URL.
https://doi.org/10.3343/lmo.2019.9.2.37 www.labmedonline.org 39 Nanopore [1, 2]. Although SMRT sequencing is less accurate than
other platforms, the long reads that are obtained are advantageous for de novo assembly [1, 2]. Understanding the pros and cons of each sequencing platform is the first consideration before poten- tial error sources and quality metrics are reviewed.
NGS WORKFLOW, SOURCES OF ERRORS, AND QUALITY CONTROL
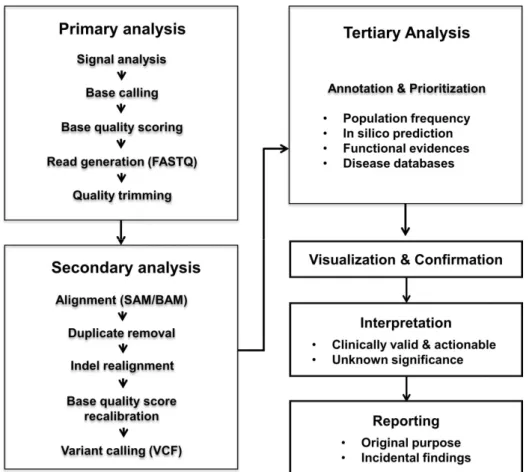
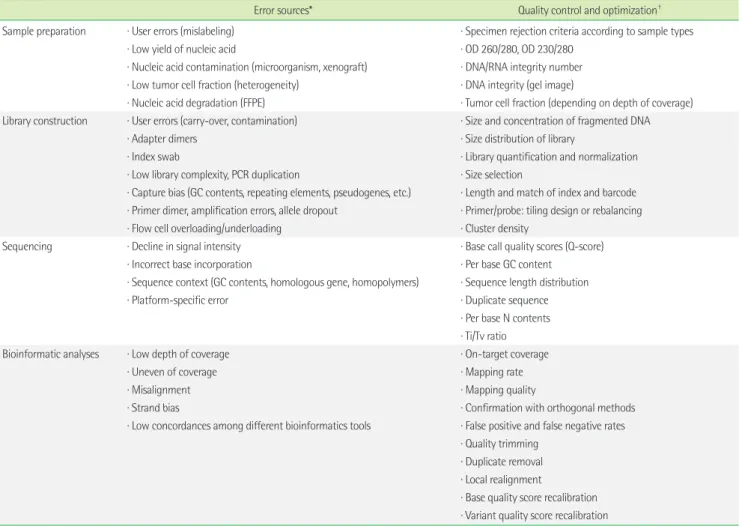
Clinical NGS implementations require quality management at multiple stages throughout the whole workflow. Most NGS testing workflows include sample preparation, library and template prep- aration, sequencing, data analysis, confirmation, clinical interpre- tation, and reporting (Fig. 1). Errors can occur at any level, and even low error rates in precedent stage could lead to fatal errors in the final results (Table 2). Early recognition and detection of er- rors is essential to avoid risk for delayed turnaround time and, more importantly, to exclude false positive and false negative results and misdiagnosis. Expected sources of errors, QC metrics, and
optimization in NGS testing are summarized in Table 2.
1. Sample preparation
The performance of the NGS testing depends on the purity and concentration of the nucleic acids, which widely vary according to specimen types, which include formalin-fixed paraffin-embed- ded (FFPE) tissues, fresh tissues, blood, bone marrow, and cell- free DNA. At this stage, nucleic acid degradation, presence of in- hibitors, contamination (e.g., microorganisms), and carry-over could be important sources of error [13, 14]. It is also important to avoid clerical errors from mislabeling. Furthermore, in case of tu- mor samples, tumor burden, sequencing of matched-normal sam- ples, and formalin preparation should be considered [13]. The tu- mor cell fraction could influence detection sensitivity of, in partic- ular, CNVs and estimation of rare mutant allele frequencies (AF).
Tumor-only sequencing is prone to lead to numerous false posi- tive and false negative results [15]. FFPE tissues are problematic due to artifactual sequence changes (formaldehyde-induced cross- links, extensive DNA fragmentation, abasic sites, and deamina-
20
Fig. 1. Overall workflow of next-generation sequencing.
Fig. 1. Overall workflow of next-generation sequencing.
https://doi.org/10.3343/lmo.2019.9.2.37 40 www.labmedonline.org
Table 2. Potential sources of error and quality control
Error sources* Quality control and optimization†
Sample preparation ∙ User errors (mislabeling) ∙ Specimen rejection criteria according to sample types
∙ Low yield of nucleic acid ∙ OD 260/280, OD 230/280
∙ Nucleic acid contamination (microorganism, xenograft) ∙ DNA/RNA integrity number
∙ Low tumor cell fraction (heterogeneity) ∙ DNA integrity (gel image)
∙ Nucleic acid degradation (FFPE) ∙ Tumor cell fraction (depending on depth of coverage) Library construction ∙ User errors (carry-over, contamination) ∙ Size and concentration of fragmented DNA
∙ Adapter dimers ∙ Size distribution of library
∙ Index swab ∙ Library quantification and normalization
∙ Low library complexity, PCR duplication ∙ Size selection
∙ Capture bias (GC contents, repeating elements, pseudogenes, etc.) ∙ Length and match of index and barcode
∙ Primer dimer, amplification errors, allele dropout ∙ Primer/probe: tiling design or rebalancing
∙ Flow cell overloading/underloading ∙ Cluster density
Sequencing ∙ Decline in signal intensity ∙ Base call quality scores (Q-score)
∙ Incorrect base incorporation ∙ Per base GC content
∙ Sequence context (GC contents, homologous gene, homopolymers) ∙ Sequence length distribution
∙ Platform-specific error ∙ Duplicate sequence
∙ Per base N contents
∙ Ti/Tv ratio
Bioinformatic analyses ∙ Low depth of coverage ∙ On-target coverage
∙ Uneven of coverage ∙ Mapping rate
∙ Misalignment ∙ Mapping quality
∙ Strand bias ∙ Confirmation with orthogonal methods
∙ Low concordances among different bioinformatics tools ∙ False positive and false negative rates
∙ Quality trimming
∙ Duplicate removal
∙ Local realignment
∙ Base quality score recalibration
∙ Variant quality score recalibration
* Some errors are often connected between precedent steps and subsequent steps; †Considering the inherent differences among NGS platforms, wet experiments, and bioin- formatics pipelines, threshold or cutoff of quality metrics cannot be specifically defined.
Abbreviations: FFPE, formalin-fixed paraffin-embedded; OD, optical density; Ti/Tv, transition/transversion.
tion of cytosine bases) [13, 14]. Therefore, acceptance and rejec- tion criteria, which include the absorbance ratio at 260/280 nm, DNA/RNA integrity number, and tumor burden, for specimens should be determined in clinical laboratories (Table 2).
2. Library and template preparation
Library construction for current NGS involves fragmentation, adapter ligation, enrichment, and clonal generation. DNA frag- mentation can be obtained by mechanical methods, such as neb- ulization and sonication, or by enzymatic digestion. After the end repair of fragmented DNA, one or more platform-specific adapt- ers are ligated to the fragmented DNA. Adapters provide sequences for binding to primers as well as index sequences for multiplex- ing. Enrichment is then performed by target amplification or tar- get capture by hybridization in targeted resequencing (Table 3).
Lastly, DNA templates are clonally amplified on beads (e.g., emul- sion PCR, ePCR) and on a solid surface (e.g., bridge amplification) in parallel, and millions of clonal clusters are created [1, 2].
There are several important sources of errors to occur during li- brary construction. First, DNA fragmentation is not actually com- pletely random and varies according to the GC content or genomic location. This could promote preferential amplification and intro- duce coverage biases. Second, adapter dimers and index swap re- sult in decreased data volume and contamination of datasets, re- spectively. When there is a lack of barcode diversity for sample multiplexing, false positive calls can be incorrectly assigned to different samples due to index swap. The swap rate could be in- creased when shorter index sequences are used and index mis- matches are allowed during demultiplexing. Third, primer biases and PCR-mediated errors such as PCR stochasticity, polymerase
https://doi.org/10.3343/lmo.2019.9.2.37 www.labmedonline.org 41 errors, and PCR template switches could occur [14, 16]. Sequenc-
ing results would be confounded by allele dropout in case with variants in primer binding sites. Potential error sources (disadvan- tages) of target amplification and capture by hybridization are de- scribed in Table 3. Lastly, overclustering in bridge ampli cation leads to loss of focus in image analyses and decreases in data quality [17]. In contrast, underclustering results in lower output.
Similarly, an inappropriate bead-to-fragment ratio in ePCR might lead to multi-clonal generation.
To identify the error source at this level, distribution of library size should be checked to determine whether there are fragments with the expected size. Sometimes, there may be abnormal peaks due to adapter dimer. Accurate quantification of the library is criti- cal for optimal cluster density and monoclonal amplification (Ta- ble 2).
3. Sequence generation
The sequences are determined by SBS, SBL, and nanopore. Con- sidering the current market share of the platforms, this review fo- cuses on SBS methodology. SBS consists of cyclic reversible ter- mination (CRT), single nucleotide addition (SNA), and real-time sequencing. In CRT approaches, a mixture of all four labeled nu- cleotides is added. Sequencing involves the incorporation of each fluorescently labeled reversible terminator nucleotide per cycle (e.g. Illumina system and Qiagen GeneReader system) [1, 2]. On the other hand, in SNA, each of the four nucleotides is added, and sequencing involve cyclic incorporation of unlabeled nucleotides
(ThermoFisher Scientific Ion Torrent/Proton/S5 system) [1, 2]. Un- like CRT, SNA does not require terminator nucleotide, because the absence of the nucleotides prevents DNA strand elongation.
One source of error at this level involves nucleotide incorpora- tion by polymerase. Uniformity of the sequencing signal, number of bases sequenced, and sequencing accuracy can be determined by the performance of polymerase. Another error can arise from artifacts of the fluorophores used as the detection signal. Poor qual- ity fluorophore is related to background noises and overlapping signals, which leads to incorrect base calls. As stated above, in- herent technical limitations include interferences due to homolo- gous sequences, high or low GC contents, and homopolymer er- rors.
Considering the size of the genomic data, even the lowest error rate could give rise to thousands of false positive variants. The ac- curacy or error rate of the sequence data is presented as the Q- score, which is a logarithmic value of the probability of an incor- rect base call. The Q-score differs depending on the sequence context and the platforms. For instance, Q-scores tend to decrease near homopolymer stretches or indels in reads. Reported error rates for the NGS platforms differ considerably, because different NGS platforms calculate Q-scores using different algorithms (Ta- ble 1). The Q-scores from sequencer-derived raw data are often nonlinear and subject to overestimation. Thus, the Q-score should be recalculated by the process of base quality recalibration con- sidering the position of the base in a read (sequencing cycle), the preceding sequence, and the error rate of the sequencer. Before Table 3. Comparison of target enrichment methods
Advantage Disadvantage
Amplification ∙ Faster than hybridization ∙ High cost
∙ Lower input DNA required ∙ Low throughput
∙ Limited to a small number of targets
∙ SNPs may interfere with primer binding (allele dropout)
∙ Primer dimers
∙ Non-specific amplification products
∙ PCR amplification errors
∙ Low library complexity
Hybridization ∙ More even coverage ∙ Higher input DNA requirements
∙ Good reproducibility ∙ Regions with high GC or AT content: not captured optimally
∙ Ability to detect some structural variants (fusion) ∙ Repetitive DNA elements: overrepresented
∙ Large sections of DNA and large numbers of genes. ∙ Off-target capture
∙ Accurate determination of depth of coverage and allele frequency by removal of PCR duplication
Characteristics are compared to each other.
https://doi.org/10.3343/lmo.2019.9.2.37 42 www.labmedonline.org
data analysis, it is important to review quality metrics of raw data including Q-scores, per base GC contents, per base N content, and sequence duplication levels as well as basic statistics (Table 2).
4. Data analysis
NGS data analyses requires substantial computational infra- structure due to the large amounts of data generated and short reads. Although the bioinformatics pipeline varies according to the application, it generally consists of three steps (Fig. 1): pri- mary, secondary, and tertiary analysis. Primary analysis begins with the generation of base calls from fluorescent image or elec- trical current signals and generates a FASTQ file. Secondary anal- ysis is the process of mapping to a reference sequence or de novo assembly and variant calling. The file formats of read alignment and variant calling are sequence alignment/Map (SAM)/Binary alignment/MAP (BAM) and variant call format, respectively. Fi- nally, tertiary analysis involves the variant annotation and prioriti- zation. A variety of bioinformatics tools have been reported, and the number of tools is still expanding [18-20]. Unfortunately, anal- yses results using different tools still have poor concordance [18].
Readers interested in the collection of bioinformatics tools are re- ferred to previous reviews [18-20].
Sequencing errors can be also observed at any level of the bio- informatics analyses. Quality trimming is the starting point of bio- informatics analyses that aims to improve the accuracy of the re- sults. Although quality trimming can lead to marked decrease in coverage, in particular exome data, this process could improve the mappability of short reads. As stated above, short reads can result in misalignment and inaccurate variant calls. Choice of map- ping software and completeness of reference genome can influ- ence the accuracy of the read mapping. In addition, for a read containing multiple variants, a read that spans a deletion or dupli- cation, or for a sequence that is not present in the reference ge- nome, a read cannot map to reference genome [21]. Conversely, there is a situation where reads map to multiple locations because reads are derived from highly homologous regions [21, 22]. Thus, homologous sequences including pseudogenes may result in false positive or false negative results. Erroneous calls can often arise from the alignment of indel-containing reads, because an indel can increase the number of mismatches [13, 21]. This error can be corrected by an additional process, such as ‘local realignment’
around a set of known indels [13, 19].
In addition to mapping quality, erroneous calls can arise from strand bias (imbalance of the number of forward and reverse reads), excessive duplicate reads, or low depth of coverage. Duplicate reads, which generally result from amplification, can bias the de- termination of AF. Moreover, it is difficult to distinguish true vari- ants with low AF and erroneous calls, while low level variants may not be detected under a low depth of coverage [22, 23]. Thus, NGS data analyses may create errors depending on the underly- ing sequence context and experimental design, as well as the bio- informatics tools. However, considering the inherent differences among NGS platforms, wet experiments, and bioinformatics pipe- lines, the threshold or cutoff of quality metrics cannot be specifi- cally defined (Table 2).
REFERENCE MATERIALS FOR NGS
Considering the potential error sources in NGS testing, the use of reference materials (RMs) is essential to implement and validate NGS testing. Some errors can be mitigated by increasing the depth of coverage, supplementing with dual indexed barcoding, and us- ing replicates [14, 23, 24]. However, systematic errors due to se- quencing artifacts or misalignment cannot be corrected without RM [14, 23]. In addition, well-characterized RM can be useful for performance evaluation, validation of analytic pipeline, internal QC, PT/ETQ program, and calibration of quantitative measure- ments, such as AF, CNV, or expression abundance.
As stated above, NGS testing consists of a multifaceted work- flow and produces a huge number of variants and potential errors in different genomic contexts. Unlike RM in other genetic testing, one pitfall in RM for NGS is the requirement for materials that con- tain the full spectrum of variants (SNV, indels CNV, and SV) and a variety of variant AF in different genomic contexts. To address this issue, the Genome in a Bottle Consortium was hosted by National Institute of Standards and Technology (NIST) in 2012. Subsequently, in 2015, NIST released the first human genome RM 8398, which is genomic DNA (NA12878) derived from the Coriell cell line GM12878.
Reference values for RM8398 consist of single nucleotide polymor- phisms, small indels, and homozygous reference genotypes for approximately 77% of the genome. In 2016, three additional hu- man RMs, including RM 8391 (GM24385, male of Eastern Euro- pean Ashkenazic Jewish), RM 8392 (GM24149, GM24143, trio of Eastern European Ashkenazic Jewish), and RM 8393 (GM24631,
https://doi.org/10.3343/lmo.2019.9.2.37 www.labmedonline.org 43 male of East Asian) became available (http://jimb.stanford.edu/
giab/).
RMs for NGS can be classified into three types [23]. The first is a well-characterized cell line, such as NIST RM. The second is a syn- thetic RM, such as plasmid spike in the genome and a single mix of multiple synthetic oligo. The third is in silico RM. Genomic ma- terials from cell lines are easily accessible and inexpensive sources, which are commutable with patient samples. However, these can- not represent all clinically relevant variants and cannot be directly added into samples. As an alternative, engineered cell lines from Horizon Diagnostics have recently been commercialized (https://
www.horizondiscovery.com/). These contain target mutations in the context of the complete genome, while there is also the possi- bility of the presence of off-target mutations. Second, unlike bio- logical materials, a spike-in control is directly added to samples and can act as an internal control [25, 26]. For example, the PhiX control is routinely used to increase library complexity and deter- mine error rate in Illumina sequencing runs [27]. However, the main limitation of the spike-in control is non-commutability to patient samples. In silico RM can be a readily available raw FASTQ file or files obtained through in silico mutagenesis [28, 29].
Although it can be designed to contain the mutations of interest, it is only used to evaluate the bioinformatics pipeline of NGS testing [28, 29]. Each type of RM has different strengths and weaknesses.
It is important to understand the relative advantages and limita- tions of selected RM to ensure the quality of the NGS testing.
CLOSING REMARKS
Although advances in NGS technology have revolutionized med- icine, significant errors can still occur. The review has outlined advantages and drawbacks of NGS platforms, the range of error sources throughout the NGS workflow, and RMs for NGS. The is- sues described here, combined with other validation guidelines from professional societies, can be helpful for medical technicians and laboratory physicians who implement and validate NGS test- ing in clinical laboratories.
요 약
지난 10년 사이 차세대염기서열분석법은 급격한 속도로 발전하 였고, 유전체학 연구 분야뿐만 아니라 임상의학 분야의 혁명을 일
으켰다. 차세대염기서열분석법의 발전과 더불어, 분석적 타당도, 임상적 타당도, 임상적 유용성에 대한 근거들이 지속적으로 보고 되고 있다. 현재 전 세계적으로 차세대염기서열분석법이 전면적으 로 적용되고 있다. 본 종설에서는 진단검사의학과 의사와 임상병 리사에게 필요한 임상유전체검사법의 도입을 위한 필수요소에 대 한 리뷰를 제공하고자 한다. 먼저 현재 상용화된 차세대유전체검 사장비의 장점 및 단점에 대해 간단히 리뷰하고, 임상유전체검사 검사과정 각 단계에서 발생할 수 있는 잠재적 오류 요인, 표준물질 에 대해 논의하였다.
AUTHORS’ DISCLOSURES OF POTENTIAL CONFLICTS OF INTEREST
No potential conflicts of interest relevant to this article were re- ported.
REFERENCES
1. Levy SE and Myers RM. Advancements in next-generation sequencing.
Annu Rev Genomics Hum Genet 2016;17:95-115.
2. Goodwin S, McPherson JD, McCombie WR. Coming of age: ten years of next-generation sequencing technologies. Nat Rev Genet 2016;17:
333-51.
3. Minear MA, Alessi S, Allyse M, Michie M, Chandrasekharan S. Nonin- vasive prenatal genetic testing: current and emerging ethical, legal, and social issues. Annu Rev Genomics Hum Genet 2015;16:369-98.
4. Park KJ, Park S, Lee E, Park JH, Park JH, Park HD, et al. A population- based genomic study of inherited metabolic diseases detected through newborn screening. Ann Lab Med 2016;36:561-72.
5. Bodian DL, Klein E, Iyer RK, Wong WS, Kothiyal P, Stauffer D, et al.
Utility of whole-genome sequencing for detection of newborn screen- ing disorders in a population cohort of 1,696 neonates. Genet Med 2016;18:221-30.
6. Pritchard CC, Salipante SJ, Koehler K, Smith C, Scroggins S, Wood B, et al. Validation and implementation of targeted capture and sequenc- ing for the detection of actionable mutation, copy number variation, and gene rearrangement in clinical cancer specimens. J Mol Diagn 2014;16:56-67.
7. Lih CJ, Sims DJ, Harrington RD, Polley EC, Zhao Y, Mehaffey MG, et al.
Analytical validation and application of a targeted next-generation se- quencing mutation-detection assay for use in treatment assignment in the NCI-MPACT trial. J Mol Diagn 2016;18:51-67.
https://doi.org/10.3343/lmo.2019.9.2.37 44 www.labmedonline.org
8. Saunders CJ, Miller NA, Soden SE, Dinwiddie DL, Noll A, Alnadi NA, et al. Rapid whole-genome sequencing for genetic disease diagnosis in neonatal intensive care units. Sci Transl Med 2012;4:154ra135.
9. Segal JP. Next-generation proficiency testing. J Mol Diagn 2016;18:469- 70.
10. Aziz N, Zhao Q, Bry L, Driscoll DK, Funke B, Gibson JS, et al. College of American Pathologists’ laboratory standards for next-generation se- quencing clinical tests. Arch Pathol Lab Med 2015;139:481-93.
11. Aird D, Ross MG, Chen WS, Danielsson M, Fennell T, Russ C, et al. An- alyzing and minimizing PCR amplification bias in Illumina sequencing libraries. Genome Biol 2011;12:R18.
12. Benjamini Y and Speed TP. Summarizing and correcting the GC con- tent bias in high-throughput sequencing. Nucleic Acids Res 2012;40:e72.
13. Jennings LJ, Arcila ME, Corless C, Kamel-Reid S, Lubin IM, Pfeifer J, et al. Guidelines for validation of next-generation sequencing-based on- cology panels: a joint consensus recommendation of the Association for Molecular Pathology and College of American Pathologists. J Mol Diagn 2017;19:341-65.
14. Robasky K, Lewis NE, Church GM. The role of replicates for error miti- gation in next-generation sequencing. Nat Rev Genet 2014;15:56-62.
15. Jones S, Anagnostou V, Lytle K, Parpart-Li S, Nesselbush M, Riley DR, et al. Personalized genomic analyses for cancer mutation discovery and interpretation. Sci Transl Med 2015;7:283ra53.
16. Kebschull JM and Zador AM. Sources of PCR-induced distortions in high-throughput sequencing data sets. Nucleic Acids Res 2015;43:e143.
17. Illumina. https://support.illumina.com/content/dam/illumina-market- ing/documents/products/other/miseq-overclustering-primer-770-2014- 038.pdf (updated on August 2017).
18. Pabinger S, Dander A, Fischer M, Snajder R, Sperk M, Efremova M, et al. A survey of tools for variant analysis of next-generation genome se- quencing data. Brief Bioinform 2014;15:256-78.
19. Oliver GR, Hart SN, Klee EW. Bioinformatics for clinical next genera- tion sequencing. Clin Chem 2015;61:124-35.
20. Chiara M and Pavesi G. Evaluation of quality assessment protocols for high throughput genome resequencing data. Front Genet 2017;8:94.
21. Gargis AS, Kalman L, Bick DP, da Silva C, Dimmock DP, Funke BH, et al. Good laboratory practice for clinical next-generation sequencing informatics pipelines. Nat Biotechnol 2015;33:689-93.
22. Santani A, Murrell J, Funke B, Yu Z, Hegde M, Mao R, et al. Develop- ment and validation of targeted next-generation sequencing panels for detection of germline variants in inherited diseases. Arch Pathol Lab Med 2017;141:787-97.
23. Hardwick SA, Deveson IW, Mercer TR. Reference standards for next- generation sequencing. Nat Rev Genet 2017;18:473-84.
24. Schmitt MW, Kennedy SR, Salk JJ, Fox EJ, Hiatt JB, Loeb LA. Detection of ultra-rare mutations by next-generation sequencing. Proc Natl Acad Sci U S A 2012;109:14508-13.
25. Sims DJ, Harrington RD, Polley EC, Forbes TD, Mehaffey MG, McGregor PM 3rd, et al. Plasmid-based materials as multiplex quality controls and calibrators for clinical next-generation sequencing assays. J Mol Diagn 2016;18:336-49.
26. Kudalkar EM, Almontashiri NA, Huang C, Anekella B, Bowser M, Hynes E, et al. Multiplexed reference materials as controls for diagnostic next- generation sequencing: a pilot investigating applications for hypertro- phic cardiomyopathy. J Mol Diagn 2016;18:882-9.
27. Illumina. https://www.illumina.com/content/dam/illumina-market- ing/documents/products/technotes/hiseq-phix-control-v3-technical- note.pdf (updated on August 2017).
28. Duncavage EJ, Abel HJ, Merker JD, Bodner JB, Zhao Q, Voelkerding KV, et al. A model study of in silico proficiency testing for clinical next- generation sequencing. Arch Pathol Lab Med 2016;140:1085-91.
29. Davies KD, Farooqi MS, Gruidl M, Hill CE, Woolworth-Hirschhorn J, Jones H, et al. Multi-institutional FASTQ file exchange as a means of proficiency testing for next-generation sequencing bioinformatics and variant interpretation. J Mol Diagn 2016;18:572-9.