© 2019 The Korean Ophthalmological Society
This is an Open Access article distributed under the terms of the Creative Commons Attribution Non-Commercial License (http://creativecommons.org/licenses /by-nc/3.0/) which permits unrestricted non-commercial use, distribution, and reproduction in any medium, provided the original work is properly cited.
Original Article
Analysis of Changes in Retinal Photoreceptors Using Optical Coherence Tomography in a Feline Model of Iodoacetic Acid-induced
Retinal Degeneration
Gwang Myeong Noh1, Jae Wan Lim2, Myung Shin Lee3,Seung Uk Lee1, Sang Joon Lee1
1Department of Ophthalmology, Kosin University College of Medicine, Busan, Korea
2Yangsan-si Dong-myeon Local Public Health Clinic, Busan, Korea
3Department of Ophthalmology, Haeundae Paik Hospital, Inje University College of Medicine, Busan, Korea
Retinitis pigmentosa (RP) is a typical photoreceptor-de- stroying retinal degenerative disease [1]. The worldwide
prevalence of RP is about 1 in 4,000, affecting more than one million individuals worldwide [2]. RP includes a di- verse group of genetic disorders characterized by the de- generation of rod and cone cells [3,4]. Symptoms include night blindness and decreased peripheral vision, eventually causing the loss of central vision [1,2]. Until now, no defin- itive treatments have been available. New treatment meth- ods have been explored using various animal models based
Received: July 13, 2019 Final revision: August 27, 2019 Accepted: September 6, 2019
Corresponding Author: Sang Joon Lee, MD, PhD. Department of Oph- thalmology, Kosin University College of Medicine, 262 Gamcheon-ro, Seo-gu, Busan 49267, Korea. Tel: 82-51-990-6140, Fax: 82-51-990-3026, E-mail: [email protected]
Purpose: We investigated structural changes in the retina by using optical coherence tomography (OCT) in a feline model of retinal degeneration using iodoacetic acid (IAA).
Methods: We examined 22 eyes of 11 felines over 2 years of age. The felines had fasted for 12 hours and were intravenously injected with IAA 20 mg/kg of body weight. OCT (Spectralis OCT) was performed at the point where the ends of the retinal vessels collected in the lateral direction from the optic nerve head and area centralis. Similarly, OCT was performed four times at 1-week intervals following injections, at which point the felines were sacrificed and histologic examinations were performed. Using OCT, the thickness of each layer of the retina was measured.
Results: The average body weight of the three male and eight female felines investigated in this study was 1.61 ± 0.19 kg. The mean total retinal thickness of the felines before injection was 221.32 ± 9.82 μm, with a significant decrease in the retinal thickness at 2, 3, and 4 weeks following injections of 186.41 ± 35.42, 174.56
± 31.94, and 175.35 ± 33.84 μm, respectively (p = 0.028, 0.027, and 0.027, respectively). The thickness of the outer nuclear layer was 57.49 ± 8.03 μm before injection and 29.26 ± 17.87, 25.62 ± 13.88, and 31.60 ± 18.38 μm at 2, 3, and 4 weeks, respectively, after injection (p = 0.028, 0.028, 0.046, respectively).
Conclusions: In a feline model of retinal degeneration using IAA, the total retinal thickness and the thickness of the outer nuclear layer were shown to decrease significantly on OCT.
Key Words: Angiography, Feline, Iodoacetic acid, Optical coherence tomography, Retinal degeneration
on the natural history of the disease [2].
Various animal models have been used to study retinal degeneration such as RP [5-8]. Among animal models, the eyes of felines and swine have a central region (comprised partly of photoreceptors) comparable to the human macu- la, with similar distributions of rod and cone cells in the central and peripheral retina [9]. Therefore, using iodoace- tic acid (IAA), such animals have been designated as mod- els of retinal degeneration [10-15]. IAA reacts with the sulfhydryl groups of glyceraldehyde 3-phosphate dehydro- genase (GADPH) in cells of various organs, including the eye, and inhibits anaerobic glycolysis [16-21]. Based on this mechanism, an optimal IAA concentration can selectively damage photoreceptors in the retina, which are most sus- ceptible to hypoxia in our body. In this process, the inner retina is preserved and shows histological features that ap- pear early in human RP [22]. Based on these characteristic findings of retinal degeneration, an animal model of IAA-induced retinal degeneration has been designed to ex- plore effective treatment of RP disease in human eyes [10,12,14].
The genetics of retinal degeneration have been investi- gated in large animal models. The results of retinal degen- eration using a Bengal feline model are yet to be reported.
RP is inherited as an autosomal recessive disease. Degen- eration occurs within one year of birth, with progressive genetic retinal atrophy [23]. Unfortunately, animal models are not easy to breed or to cultivate for the long term. Nev- ertheless, the development of a feline model of retinal de- generation using IAA has been reported [10]. Retinal de- generation has been successfully induced with adequate IAA [10]. In that research, however, the time of induction of retinal degeneration before and after IAA injection or changes in photoreceptor cells were not confirmed histo- logically.
Optical coherence tomography (OCT), which is widely used in ophthalmology, is a noninvasive, non-contact tech- nique for acquisition of images of the retina and the optic nerve through the pupil. It provides a high-resolution cross-sectional image [15]. Despite attempts to analyze ret- inal degeneration in animal models with OCT, studies in- volving models of feline retinal degeneration have yet to be reported [12,24]. In the present study, we evaluate whether structural changes in the retina observed with OCT correlate chronologically with histological examina- tion following IAA induction.
Materials and Methods
Animal subjects
This study is based on a total of 22 eyes from 11 adult felines (three males and eight females) of at least 2 years of age. Experimental groups included a normal control group of four eyes (one male and one female) and a group of 18 eyes (two males and seven females) showing retinal degen- eration. Felines were acquired after quarantine at Gyeong- sang National University College of Veterinary Medicine, and in accordance with the guidelines for animal experi- ments as prescribed by the Association for Research in Vi- sion and Ophthalmology (ARVO). The animals were housed in an animal laboratory operated by our medical school. The above experiment was carried out after formal approval from the Animal Experimental Ethics Committee (Kosin 13-15). We minimized pain and discomfort in the animal subjects according to the guidelines of the ARVO Statement for the Use of Animals in Ophthalmic and Vi- sion Research.
Induction of retinal degeneration by iodine acetic acid injection
IAA (Sigma-Aldrich, Buchs, Switzerland) was dissolved in 10 milliliters (mL) of phosphate-buffered saline (Lonza, Walkersville, MD, USA), and the pH was adjusted to 7.4.
The solution was then passed through a 0.2-μm filter (Minisart, Sartorius Stedim, Biotech, Germany). A 20-mg/
kg dose of IAA was slowly injected into the femoral veins of subjects using a 24-gauge needle over the course of 5 minutes.
Measurement of body weight, axial length, and fasting blood glucose
The felines were injected with 3.5 mg/kg of tiletamine hydrochloride, 10 mg/kg of Zoletil 50 (Virbac SA, Carros Cedex, France), and 3.5 mg/kg of hydrochloric acid xyla- zine (Rompun, Bayer, Leverkusen, Germany) for anesthe- sia. After anesthesia was administered, body weight and axial length were measured.
Weights were measured with an electronic balance (En- tris5201, Sartorius, Göttingen, Germany). The axial length, from the anterior surface of the cornea to the retinal pig-
ment epithelium, was measured using A-scan ultrasound biometry (A-scan) (Quantel Medical, France). The axial length was measured 10 times, and the mean value was obtained without pressing the central cornea under anes- thesia. Blood glucose was measured after fasting for 12 hours (Accu-Chek, Roche Diagnostics, Mannheim, Ger- many).
Fluorescein angiography
Using Heidelberg Spectralis retinal angiography (Hei- delberg Engineering, Heidelberg, Germany), fundus angi- ographies were twice performed, once before IAA injec- tion and again 4 weeks later. A fluorescent agent (10 mg/kg body weight; Fluorescite, Alcon, Tokyo, Japan) was inject- ed through the femoral veins of anesthetized felines, fol- lowed eventually by retinal angiography. Angiography was started shortly after injection and lasted about 7 to 8 min- utes.
Retinal thickness using OCT
The retina was photographed using an OCT machine.
The felines were treated with 0.5% tropicamide and 0.5%
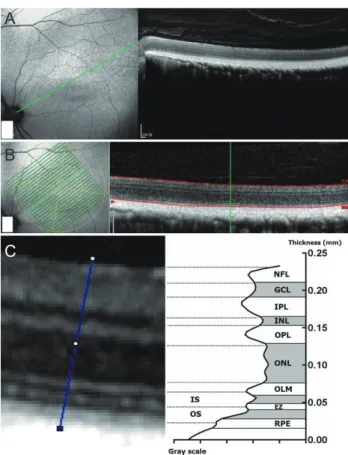
phenylephrine eye drops (Mydrin-P, Santen, Japan) four times at 10-minute intervals for mydriasis. OCT was per- formed using the Spectralis OCT (Heidelberg Engineer- ing) before IAA injection and again after 1, 2, 3, and 4 weeks. The observed central region spanned from the optic disc head laterally to the retinal vascular arcade (Fig. 1A- 1C). The imaging speed of OCT was 40,000 A-scan per second. The volume scan consisted of a linear scan (8.9 mm in width and 1.9 mm in depth). A total of 25 such lin- ear scans, each 6 mm in width and 1.9 mm in depth, were performed. Using an automated real-time function for eye tracking, the retina was always photographed in the same position. All the scans with a signal strength of 80 frames or more were included in the results to obtain a good im- age. Recorded OCT images were stored in a JPG file of maximum image quality using Heidelberg Eye Explorer vers. 1.8.6 (Heidelberg Engineering).
Using these image files, the gray value graph was ob- tained using the Plot Profile function of the ImageJ pro- gram ver. 1.47 (National Institutes of Health, Bethesda, MD, USA). Photoreceptor thicknesses were determined according to the gray scale values of the retinal pigment
epithelium, the photoreceptor inner and outer segments, and the external limiting membrane. The boundaries be- tween the outer nuclear layer, the outer plexiform layer, the inner nuclear layer, the inner plexiform layer, the gan- glion cell layer, and the nerve fiber layer showed the maxi- mum change in graph slope (Fig. 1C). The thickness of each layer was determined as the average of three mea- surements. Fig. 1C is a reconstruction of a gray value graph obtained from the ImageJ program with GraphPad Prism ver. 7.02 (GraphPad Software, La Jolla, CA, USA).
Central retinal thickness was measured using the macular thickness map function embedded in Heidelberg Eye Ex-
A
B
C
Fig. 1. Optical coherence tomography imaging. Spectralis opti- cal coherence tomography was used to image the area centralis, where the vessel ends meet. (A) Linear scan. (B) Volume scan.
Early Treatment for Diabetic Retinopathy Study circle shown in yellow line. (C) Measuring each retinal layer thickness. The thickness of each retinal layer was measured using ImageJ gray- scale. The above graph was obtained using GraphPad Prism program ver. 7.02. NFL = nerve fiber layer; GCL = ganglion cell layer; IPL = inner plexiform layer; INL = inner nuclear layer;
OPL = outer plexiform layer; ONL = outer nuclear layer; OLM = outer limiting membrane; IS = inner segment layer; OS = outer segment layer; EZ = ellipsoid zone; RPE = retinal pigmented epi- thelium.
plorer ver. 1.8.6 (Heidelberg Engineering). Retinal thick- ness was measured in a single retinal section using the Im- ageJ program described above.
Histologic evaluation using hematoxylin and eosin stain
Each feline was sacrificed using carbon dioxide, and the eyeballs were removed. Each cornea, iris, lens, and vitre- ous body were separated without incurring retinal damage following a circular incision along the corneal limbus. The optic nerve was placed on the floor and a horizontal inci- sion was made along the tapetum lucidum border and the inferior margin of the optic nerve. A vertical incision of 90˚ including the medial margin of the optic nerve was performed based on this line. Tissue samples measuring 6 mm × 6 mm with the full thickness of neurosensory retina to sclera, including the optic nerve, were obtained. The tis- sue was fixed in 10% formalin (Formaldehyde, GoldenBio- tech Co., Seoul, Korea) solution for 48 hours. Fixed tissues were paraffin-embedded, serially sectioned with a paraf- fin-embedded microtome (Leica RM2235, Nussloch, Baden-Württemberg, Germany) to obtain 4-μm-thick slic- es, and tissue slides were prepared.
Paraffin-embedded tissue specimens on slides were twice treated with xylene for 5 minutes (a process of depa- raffinization). The sections were twice treated with 100%
ethanol for 5 minutes and were treated once, for 5 minutes each, with 95%, 80%, and 70% ethanol. The sections were washed for 5 minutes with phosphate-buffered saline. Sec- tions were dyed with hematoxylin (Poly Scientific, Cleve- land Avenue, NY, USA) for 5 minutes, and with eosin (Poly Scientific) for 3 minutes. The slides were treated with 70%, 80%, and 95% ethanol once for 2 minutes each, twice with 100% ethanol for 2 minutes each, and twice with xylene for 5 minutes each. The tissues were examined with an optical microscope (Eclipse 80i, Nikon, Kawasaki, Japan). The thickness of the outer nuclear layer was mea- sured at 2,000 μm temporal from the optic disc.
Statistical analysis
Thicknesses of each retinal layer at injection and at 1, 2, 3, and 4 weeks after injection were compared using Wil- coxon signed-rank tests. The thickness of the outer granu- lar layer of histologic examination, the area of the rod cells
under the immunochemical stain, and the number of cells per unit length of cone cells were measured using PASW Statistics ver. 18.0 (SPSS Inc., Chicago, IL, USA). Based on Wilcoxon signed-rank tests, a value of p < 0.05 was con- sidered statistically significant.
Results
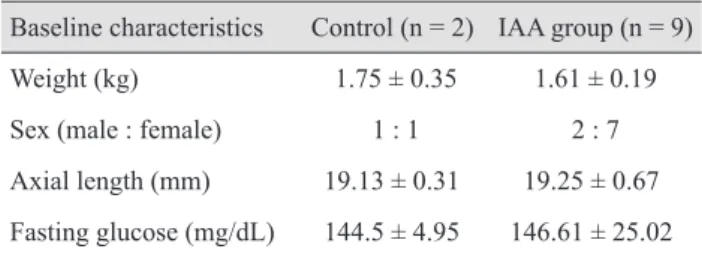
Weight, axial length, and fasting blood glucose results The average weight of the felines was 1.61 ± 0.19 kg, the mean axial length was 19.25 ± 0.67 mm, and the mean fasting blood glucose before IAA injection was 146.61 ± 25.02 mg/dL (Table 1).
Fluorescein angiography
Fluorescein angiography performed before IAA injec- tion and at 4 weeks after injection revealed only a delayed leak around the blood vessels after injection in feline num- ber 4. Following injection of fluorescein in the fundus pri- or to IAA injection, the arterial, arteriovenous, and venous phases were gradually attenuated. The latency time was approximately 9 ± 0.82 seconds. The retinal arterial phase started at 10 ± 0.81 seconds after fluorescein dye adminis- tration. The retinal arteriovenous phase started at 14 ± 0.96 seconds, and the retinal venous phase started at 17.25 ± 1.26 seconds after administration. The same pattern was ob- served after injection (Fig. 2A-2D). No differences were observed before and after injection in any of the other fe- lines. However, multiple hyperfluorescent dots were ob- served in the late phase in feline number 4 injected with IAA (Fig. 2B).
Table 1. Baseline characteristics of felines
Baseline characteristics Control (n = 2) IAA group (n = 9)
Weight (kg) 1.75 ± 0.35 1.61 ± 0.19
Sex (male : female) 1 : 1 2 : 7
Axial length (mm) 19.13 ± 0.31 19.25 ± 0.67 Fasting glucose (mg/dL) 144.5 ± 4.95 146.61 ± 25.02 Values are presented as mean ± standard deviation or number.
IAA = iodoacetic acid.
Retinal degeneration findings based on OCT
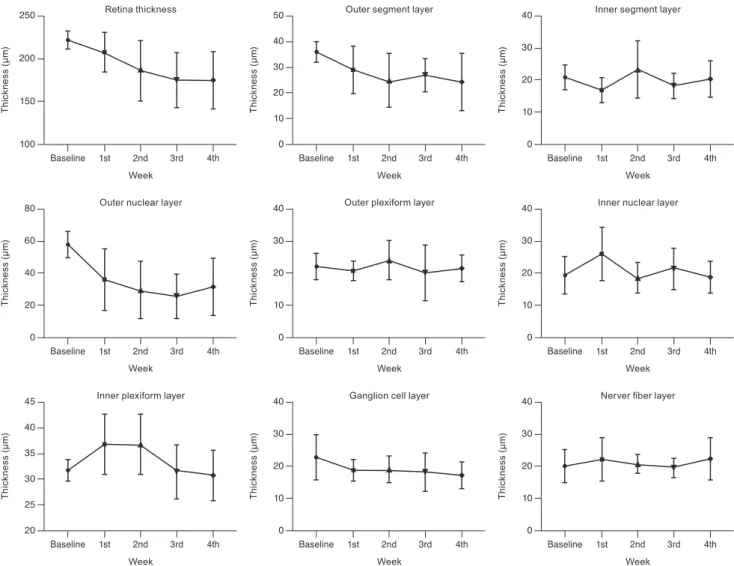
Structures corresponding to the retinal nerve fiber layer, ganglion cell layer, inner plexiform layer, inner nuclear layer, outer plexiform layer, outer nuclear layer, external limiting membrane, and junction of the inner and outer photoreceptor segments were observed prior to IAA injec- tion (Fig. 3A). Mean thicknesses of the outer nuclear layer before and at 1, 2, 3, and 4 weeks after IAA injection were 57.49 ± 8.03, 36.12 ± 18.91, 29.26 ± 17.87, 25.62 ± 13.88, and 31.60 ± 18.38 µm, respectively. The thickness of the outer nuclear layer decreased significantly at 1, 2, 3, and 4 weeks after IAA injection compared to pre-injection levels in this group (p = 0.075, p = 0.028, p = 0.028, and p = 0.046, re- spectively) (Fig. 3B-3E).
Analysis of changes in retinal thickness by OCT
The mean retinal thickness of the felines measured by OCT was 221.32 ± 9.82 μm, and retinal thicknesses at 1, 2, 3, and 4 weeks after injection were 207.34 ± 23.36, 186.41 ± 35.42, 174.56 ± 31.94, and 175.35 ± 33.84 μm, respectively.
The retinal thickness was significantly decreased at 2, 3, and 4 weeks (p = 0.028, 0.027, and 0.027, respectively). The central retinal thickness was 227.65 ± 13.36 μm before in- jection and 211.33 ± 18.26, 181.03 ± 21.33, 165.32 ± 14.21, and 168.72 ± 18.74 μm when measured at 1, 2, 3, and 4 weeks, respectively, following injection (p = 0.031, 0.016, and 0.024, respectively). The thickness of the outer nuclear layer was 57.49 ± 8.03 μm before injection, and 29.26 ±
17.87, 25.62 ± 13.88, and 31.60 ± 18.38 μm at 2, 3, and 4 weeks after injection, respectively (p = 0.028, 0.028, and 0.046, respectively) (Table 2 and Fig. 4).
Histologic evaluation
Optical microscopy revealed that the thickness of the outer nuclear layer was markedly reduced, and inner seg- ment/outer segment junctions were obscured by degenera- tion of the photoreceptors (Fig. 5A, 5B). The thickness of each retinal layer in IAA-treated feline retinas varied as follows. The mean total retinal thickness was 175.23 ± 33.73 µm. Thicknesses of the outer segment layer, the inner segment layer, the outer nuclear layer, the outer plexiform layer, the inner nuclear layer, the inner plexiform layer, the ganglion cell layer, and the nerve fiber layer were 24.07 ± 11.06, 20.06 ± 5.67, 31.43 ± 18.19, 21.40 ± 4.14, 18.72 ± 4.85, 30.76 ± 4.85, 17.38 ± 4.14, and 22.07 ± 6.59 µm, respectively.
The total retinal thickness in the normal group was 207.07
± 1.29 µm. The thicknesses of different retinal layers in the normal control group were as follows: outer segment layer, 30.38 ± 0.81 µm; inner segment layer, 21.31 ± 0.64 µm;
outer nuclear layer, 51.32 ± 7.26 µm; outer plexiform layer, 21.73 ± 0.73 µm; inner nuclear layer, 19.55 ± 0.15 µm; inner plexiform layer, 34.14 ± 1.86 µm; ganglion cell layer,19.74 ± A
B
C
D
Fig. 2. (A,B) Fluorescein angiography results from feline 4. (A) No abnormalities of the retina before iodoacetic acid (IAA) injec- tion at 2:49, 2:26 seconds. (B) Delayed leak around the central and peripheral retina after IAA injection at 6:12, 7:08 seconds. (C,D) Fluorescein angiography results from feline 5. (C) No retinal ab- normalities before IAA injection (at 3:12, 1:00 seconds after fluo- rescein injection). (D) No interval changes after IAA injection (at 1:09, 5:22 seconds after fluorescein injection).
A
Fig. 3. Retinal changes obtained with optical coherence tomog- raphy after iodoacetic acid injection. (A) Baseline. (B) First week after injection. (C) Second week after injection. (D) Third week after injection. (E) Fourth week after injection. Note that the out- er nuclear layer was substantially reduced and the photoreceptor layer was degenerated.
B C
D E
2.98 µm; and nerve fiber layer, 21.15 ± 1.37 µm. Compared to the macular area in a normal feline, the total retinal thickness and the thickness of the outer nuclear layers were significantly lower.
Discussion
This study developed a retinal degeneration model using IAA in felines with binocular vision. Degeneration find- ings were confirmed with OCT and histology. IAA-in- duced felines represent large animal models of retinal de- generation. Large animals exhibit a retinal structure similar to that of humans. The distribution of rods and cones in the central and peripheral retina, where photore- ceptors are concentrated, is also similar to that of humans [9,24,25]. Therefore, several investigators are currently
working toward developing larger animal models.
Genetic and chemically-induced models of retinal de- generation are available [23,26,27]. Ofri et al. [23] devel- oped a model of progressive retinal atrophy inherited as an autosomal recessive disease that manifests degeneration within one year of birth. Graymore and Tansley [26] devel- oped a rat model by intravenously injecting IAA. Rosch et al. [27] induced retinal degeneration in mice via IAA in- jection. Additionally, that research characterizes the effects of intravitreal IAA injections compared to systemic appli- cation (intraperitoneal vs. intravenous) to induce retinal degeneration. Scott et al. [11] reported that intravenous in- jection of IAA into swine models at 5, 7.5, 10, and 12 mg/
kg reduced the length of photoreceptors and decreased the thickness of the outer nuclear layer in a dose-dependent manner. Large genetic models are associated with several disadvantages, such as difficulty of breeding, high experi- Table 2. Changes in thickness of each retinal layer after iodoacetic acid injection measured with optical coherence tomography imaging (n = 18)
Retinal layer (μm) Baseline 1st week* 2nd week* 3rd week* 4th week*
Central retina thickness† 227.65 ± 13.36 211.11 ± 18.26
(p = 0.215) 181.03 ± 21.33
(p = 0.031) 165.32 ± 14.21
(p = 0.016) 168.72 ± 18.74 (p = 0.024) Total retinal thickness‡ 221.32 ± 9.82 207.34 ± 23.36
(p = 0.223) 186.41 ± 35.42
(p = 0.028) 174.46 ± 31.94
(p = 0.027) 175.35 ± 33.84 (p = 0.027)
OS‡ 31.48 ± 4.17 28.90 ± 9.12
(p = 0.126) 24.73 ± 10.55
(p = 0.079) 27.68 ± 6.49
(p = 0.134) 24.17 ± 11.14 (p = 0.069)
IS‡ 20.86 ± 3.98 16.76 ± 4.07
(p = 0.116) 21.23 ± 9.06
(p = 0.192) 18.21 ± 4.34
(p = 0.211) 20.44 ± 5.96 (p = 0.723)
ONL‡ 57.49 ± 8.03 36.12 ± 18.91
(p = 0.075) 29.26 ± 17.87
(p = 0.028) 25.62 ± 13.88
(p = 0.028) 31.60 ± 18.38 (p = 0.046)
OPL‡ 22.22 ± 4.11 20.75 ± 2.87
(p = 0.465) 24.25 ± 6.19
(p = 0.501) 20.21 ± 8.99
(p = 0.686) 21.54 ± 4.24 (p = 0.674)
INL‡ 19.51 ± 5.90 26.26 ± 8.34
(p = 0.116) 18.77 ± 5.00
(p = 0.511) 21.56 ± 6.35
(p = 0.587) 18.85 ± 5.09 (p = 0.686)
IPL‡ 35.45 ± 5.07 36.82 ± 5.90
(p = 0.475) 37.23 ± 5.82
(p = 0.317) 35.58 ± 5.29
(p = 0.362) 30.93 ± 4.94 (p = 0.527)
GCL‡ 22.97 ± 7.08 18.88 ± 3.45
(p = 0.138) 17.62 ± 4.18
(p = 0.087) 18.10 ± 6.25
(p = 0.345) 17.57 ± 4.23 (p = 0.108)
NFL‡ 20.19 ± 4.97 22.11 ± 6.50
(p = 0.463) 20.78 ± 2.94
(p = 0.715) 19.49 ± 3.08
(p = 0.715) 22.25 ± 6.50 (p = 0.345) Values are presented as mean ± standard deviation.
OS = outer segment layer; IS = inner segment layer; ONL = outer nuclear layer; OPL = outer plexiform layer; INL = inner nuclear layer;
IPL = inner plexiform layer; GCL = ganglion cell layer; NFL = nerve fiber layer.
*Comparison between baseline and each week. The p-value was based on Wilcoxon signed-rank tests; †Central retinal thickness was mea- sured with Heidelberg Eye Explorer ver. 1.8.6; ‡Total retinal thickness and thickness of each retinal layer were measured via the ImageJ program ver. 1.47.
mental cost, and varying patterns of inheritance. The short lifespan of mouse and rat models limits our ability to pre- dict the degree of retinal degeneration during survival pe- riods following drug administration [26-28]. Chemical models developed via chemical injection into the vitreous have been shown to locally affect all the layers of neuro- sensory retina, and are therefore not useful in studies in- vestigating outer retinal degeneration [26-28]. Further, drug doses may vary between experimental animals, along with the degree of retinal degeneration in each eye [29]. To overcome the limitations of previous retinal degeneration models, large animal models of retinal degeneration that are readily available and monitored using in vivo biometry techniques, such as OCT, are needed.
In the past, retinal degeneration was mainly confirmed Fig. 4. Changes in retinal layer thickness after iodoacetic acid injection. *p < 0.05 versus baseline. Using methods shown in Fig. 1 and 2, retinal thicknesses were measured with optical coherence tomography and represented as a line graph.
Thickness (µm)
Baseline 1st 2nd 3rd 4th 100
150 250 200
Retina thickness
Week
Thickness (µm)
Baseline 1st 2nd 3rd 4th 0
20 10 50 40 30
Outer segment layer
Week
Thickness (µm)
Baseline 1st 2nd 3rd 4th 0
20 10 40 30
Inner segment layer
Week
Thickness (µm)
Baseline 1st 2nd 3rd 4th 0
40 20 80 60
Outer nuclear layer
Week
Thickness (µm)
Baseline 1st 2nd 3rd 4th 0
20 10 40 30
Outer plexiform layer
Week
Thickness (µm)
Baseline 1st 2nd 3rd 4th 0
20 10 40 30
Inner nuclear layer
Week
Thickness (µm)
Baseline 1st 2nd 3rd 4th 20
30 25 45 40 35
Inner plexiform layer
Week
Thickness (µm)
Baseline 1st 2nd 3rd 4th 0
20 10 40 30
Ganglion cell layer
Week
Thickness (µm)
Baseline 1st 2nd 3rd 4th 0
20 10 40 30
Nerver fiber layer
Week
B
Fig. 5. Sections of normal and iodoacetic acid-treated feline retinas. A standard hematoxylin-eosin-stained retinal section matched the optical coherence tomography image. (A) Normal control. (B) An iodoacetic acid-treated feline retinal section. Out- er nuclear layer thickness was reduced and outer segment/inner segment virtually disappeared. NFL = nerve fiber layer; GCL
= ganglion cell layer; IPL = inner plexiform layer; INL = inner nuclear layer; OPL = outer plexiform layer; ONL = outer nuclear layer; IS = inner segment layer; OS = outer segment layer; RPE = retinal pigmented epithelium.
A
by histological examination. Studies investigating retinal degeneration have used electron microscopy, immunohis- tochemistry, electroretinography, and OCT [10,22,26].
OCT is performed using infrared interference with a wavelength of about 830 nm, which is generated using a super luminescent diode. This image is directly related to histological findings and is referred to as in vivo microsco- py [30,31]. The junction between inner and outer segments of photoreceptors corresponds to the ellipsoid zone, while the outer end of the cone cell corresponds to the interdigi- tation zone surrounded by apical protrusions of the retinal pigment epithelium in human OCT findings [32]. In terms of the retina of felines, the cone sheath of a feline differs from that of a human [33]. Therefore, a third high reflec- tion line is typically not observed. In a study of dogs and pigs using OCT, three high-reflectance lines were detected outside the outer nuclear layer [34,35]. In contrast, four highly reflective lines have been observed in some birds [36]. A bird has a central fovea and cone cells similar to a human, but the retinal structure varies depending on the bird species. It is difficult to conclude that this finding is consistent with each retinal layer observed in human OCT findings. The current study demonstrates the correlation between histologic evaluation sections and OCT in feline retinal layers. In the feline macula, the third hyper-reflec- tive line was absent, but other layers such as the ellipsoidal zone, the retinal pigment epithelium, the outer plexiform layer, the inner plexiform layer, and the nerve fiber layer were observed and used to measure retinal degeneration.
Compared with previous studies, the greatest advantage of our study is that the retinal degeneration model was de- veloped with IAA using a large animal with binocular vi- sion, and that these changes were periodically observed through OCT. In the feline model of retinal degeneration using IAA herein, OCT showed a significant decrease in total retinal thickness and outer nuclear layer thickness.
The total retinal thickness and the thickness of the outer nuclear layer decreased during the first 3 weeks after IAA injection, and then increased slightly at 4 weeks after IAA injection.
Fluorescein angiography was performed before injection and 4 weeks after injection. Local leakage at depigmented spots has been reported in a rodent model of retinal degen- eration using fluorescein angiography [24]. A different study in Japan compared findings from indocyanine green angiography and fluorescein angiography in normal cats
[37]. Compared to human values, these outcomes were shown to be relatively slow to appear [37]. In our study, fluorescein angiography was performed prior to IAA in- jection and 4 weeks following injection, without any dif- ference between pre-injection and post-injection outcomes in all but one of the felines. Only a single feline (number 4) out of nine felines displayed multiple hyperfluorescent dots around the blood vessels during the post-injection late phase. The starting time of each phase after administration of fluorescein dye was determined. Compared with hu- mans, there was no significant difference in time between circulating phases. Data related to fundus angiography in felines showing retinal degeneration represent a novel finding, but further research is needed.
In a study of an IAA-induced swine model of retinal de- generation by Wang et al. [12], the number of rod cells de- creased after 2 weeks post-injection, whereas the number of cone cells remained unchanged at 5 weeks. The rod cells had died, but it was presumed that the disappearance of IAA caused cone cell glycolysis, which led to cone cell re- covery [10]. The recovery of retinal thickness at 4 weeks was also induced by selectively damaging the rod cells in this study. Wang et al. [12] proposed two mechanisms for these findings. First, glyceraldehyde GAPDH may have been re-synthesized when the concentrations in the body declined. Second, GAPDH may have been restored by sug- ar storage [11].
In patients with RP, the outer photoreceptor layer disap- pears initially, followed by the inner layer and nuclei [26,28]. Histological findings of IAA-induced retinal de- generation are similar to those of RP. Hartong et al. [2] re- ported that degeneration of rod cells precedes degeneration of cone cells in patients with RP. Menghini et al. [38] mea- sured the density of cone cells in patients with RP and healthy subjects using adaptive optics scanning laser oph- thalmoscopy. Adaptive optics scanning laser ophthalmos- copy findings have shown a significant positive correlation between the density of cone cells and the thickness of the outer nuclear layer in normal eyes and in eyes with RP [38]. The degree of reduction in the outer nuclear layer re- flects retinal degeneration, which is confirmed by our study and consistent with actual histological changes.
At a dose of 20 mg/kg IAA, the total retinal thickness, and the thickness of the outer nuclear layer were signifi- cantly decreased on OCT at 2, 3, and 4 weeks, which was confirmed histologically. IAA modifies and inhibits GAP-
DH, thereby blocking glycolysis [29]. Neurons depend on glycolysis for adenosine triphosphate production, and pho- toreceptors are particularly sensitive to IAA because of their high metabolic rate [22]. This phenomenon explains why, as observed herein, the outer nuclear layer, which contains nuclei of photoreceptor neurons, lost cells while the inner retinal neurons were unaffected by IAA. Fur- thermore, exposure to IAA shortened the outer segment layers. The results suggest that IAA treatment specifically eliminates photoreceptors in the retina.
One limitation of this study is that it does not compare OCT outcomes and histologic findings at 1, 2, and 3 weeks after injection because the felines were sacrificed at 4 weeks. OCT shows the structure of the retina, but shows limited differentiation of rod and cone cells. Studies, in- cluding electrophysiological examination of felines, are needed to analyze the function of each photoreceptor cell.
In this experiment, the number of controls was also a lim- itation. Nevertheless, unlike genetic models of retinal de- generation, the primary strength of this study is the rela- tively short period of time required to develop a model of retinal degeneration. The model is expected to serve as a large animal model of retinal degeneration.
In summary, using this model in other studies may facil- itate the investigation of retinal degeneration by OCT without sacrificing experimental animals for histological examination. For example, in an experiment to determine the efficacy of a therapeutic agent, the model may be used to study retinal changes before and after treatment. This model has the potential to be used to generate basic data for retinal degeneration research. The findings of photore- ceptor degeneration in felines, as confirmed by this study, will be useful for treatment and research in retinal degen- eration going forward.
Conflict of Interest
No potential conflict of interest relevant to this article was reported.
Acknowledgements
This study was supported by the Basic Research Pro- gram through the National Research Foundation of Korea
(NRF) funded by the Ministry of Science, ICT & Future Planning (2017R1A2B4004664).
References
1. Berson EL. Retinitis pigmentosa. The Friedenwald lecture.
Invest Ophthalmol Vis Sci 1993;34:1659-76.
2. Hartong DT, Berson EL, Dryja TP. Retinitis pigmentosa.
Lancet 2006;368:1795-809.
3. Birch DG, Anderson JL, Fish GE. Yearly rates of rod and cone functional loss in retinitis pigmentosa and cone-rod dystrophy. Ophthalmology 1999;106:258-68.
4. Clarke G, Collins RA, Leavitt BR, et al. A one-hit model of cell death in inherited neuronal degenerations. Nature 2000;406:195-9.
5. Cheng YP, Ke CY, Kuo CC, Lee YJ. Effect of a complex lutein formula in an animal model for light-induced retinal degeneration. Chin J Physiol 2016;59:202-9.
6. Taylor L, Arner K, Ghosh F. N-methyl-N-nitrosourea-in- duced neuronal cell death in a large animal model of retinal degeneration in vitro. Exp Eye Res 2016;148:55-64.
7. Nagar S, Krishnamoorthy V, Cherukuri P, et al. Early re- modeling in an inducible animal model of retinal degenera- tion. Neuroscience 2009;160:517-29.
8. Yamauchi Y, Agawa T, Tsukahara R, et al. Correlation be- tween high-resolution optical coherence tomography (OCT) images and histopathology in an iodoacetic acid-induced model of retinal degeneration in rabbits. Br J Ophthalmol 2011;95:1157-60.
9. Rapaport DH, Stone J. The area centralis of the retina in the cat and other mammals: focal point for function and devel- opment of the visual system. Neuroscience 1984;11:289-301.
10. Nan Y, Zhang Q, Ren C, et al. Functional evaluation of io- doacetic acid induced photoreceptor degeneration in the cat. Sci China Life Sci 2013;56:524-30.
11. Scott PA, Kaplan HJ, Sandell JH. Anatomical evidence of photoreceptor degeneration induced by iodoacetic acid in the porcine eye. Exp Eye Res 2011;93:513-27.
12. Wang W, Fernandez de Castro J, Vukmanic E, et al. Selec- tive rod degeneration and partial cone inactivation charac- terize an iodoacetic acid model of Swine retinal degenera- tion. Invest Ophthalmol Vis Sci 2011;52:7917-23.
13. Noel JM, Fernandez de Castro JP, Demarco PJ Jr, et al. Io- doacetic acid, but not sodium iodate, creates an inducible swine model of photoreceptor damage. Exp Eye Res
2012;97:137-47.
14. Wang Y, Zhao L, Lu F, et al. Retinoprotective effects of bilberry anthocyanins via antioxidant, anti-inflammatory, and anti-apoptotic mechanisms in a visible light-induced retinal degeneration model in pigmented rabbits. Molecules 2015;20:22395-410.
15. Aplin FP, Luu CD, Vessey KA, et al. ATP-induced photo- receptor death in a feline model of retinal degeneration. In- vest Ophthalmol Vis Sci 2014;55:8319-29.
16. Cibis PA, Noell WK. Cataract induced by iodoacetic acid;
a preliminary report. Am J Ophthalmol 1955;40:379-82.
17. Orzalesi N, Calabria GA, Grignolo A. Experimental degen- eration of the rabbit retina induced by iodoacetic acid: a study of the ultrastructure, the rhodopsin cycle and the up- take of 14C-labeled iodoacetic acid. Exp Eye Res 1970;9:246- 53.
18. Toda N. Calcium independent contraction induced by iodo- acetic acid in isolated cerebral arteries. Stroke 1984;15:475- 80.
19. Suna H, Arai M, Tsubotani Y, et al. Dysideamine, a new sesquiterpene aminoquinone, protects hippocampal neuro- nal cells against iodoacetic acid-induced cell death. Bioorg Med Chem 2009;17:3968-72.
20. Zhou X, Zhu L, Wang L, et al. Protective effect of edara- vone in primary cerebellar granule neurons against iodo- acetic acid-induced cell injury. Oxid Med Cell Longev 2015;2015:606981.
21. Winkler BS, Sauer MW, Starnes CA. Modulation of the Pasteur effect in retinal cells: implications for understand- ing compensatory metabolic mechanisms. Exp Eye Res 2003;76:715-23.
22. Noell WK. Experimentally induced toxic effects on struc- ture and function of visual cells and pigment epithelium.
Am J Ophthalmol 1953;36:103-16.
23. Ofri R, Reilly CM, Maggs DJ, et al. Characterization of an early-onset, autosomal recessive, progressive retinal degen- eration in Bengal cats. Invest Ophthalmol Vis Sci 2015;56:5299-308.
24. Chang B. Mouse models for studies of retinal degeneration and diseases. Methods Mol Biol 2013;935:27-39.
25. Ehrenberg M, Ehrenberg S, Schwob O, Benny O. Murine fundus fluorescein angiography: an alternative approach using a handheld camera. Exp Eye Res 2016;148:74-8.
26. Graymore C, Tansley K. Iodoacetate poisoning of the rat retina. II. Glycolysis in the poisoned retina. Br J Ophthal- mol 1959;43:486-93.
27. Rosch S, Johnen S, Mazinani B, et al. The effects of iodo- acetic acid on the mouse retina. Graefes Arch Clin Exp Ophthalmol 2015;253:25-35.
28. Graymore C, Tansley K. Iodoacetate poisoning of the rat retina. I. Production of retinal degeneration. Br J Ophthal- mol 1959;43:177-85.
29. Liang L, Katagiri Y, Franco LM, et al. Long-term cellular and regional specificity of the photoreceptor toxin, iodo- acetic acid (IAA), in the rabbit retina. Vis Neurosci 2008;25:167-77.
30. Thomas D, Duguid G. Optical coherence tomography: a re- view of the principles and contemporary uses in retinal in- vestigation. Eye (Lond) 2004;18:561-70.
31. Huang D, Swanson EA, Lin CP, et al. Optical coherence to- mography. Science 1991;254:1178-81.
32. Spaide RF, Curcio CA. Anatomical correlates to the bands seen in the outer retina by optical coherence tomography:
literature review and model. Retina 2011;31:1609-19.
33. Fisher SK, Steinberg RH. Origin and organization of pig- ment epithelial apical projections to cones in cat retina. J Comp Neurol 1982;206:131-45.
34. Hernandez-Merino E, Kecova H, Jacobson SJ, et al. Spec- tral domain optical coherence tomography (SD-OCT) as- sessment of the healthy female canine retina and optic nerve. Vet Ophthalmol 2011;14:400-5.
35. Gloesmann M, Hermann B, Schubert C, et al. Histologic correlation of pig retina radial stratification with ultra- high-resolution optical coherence tomography. Invest Oph- thalmol Vis Sci 2003;44:1696-703.
36. Rauscher FG, Azmanis P, Korber N, et al. Optical coher- ence tomography as a diagnostic tool for retinal pathologies in avian ophthalmology. Invest Ophthalmol Vis Sci 2013;54:8259-69.
37. Hayashi M, Maehara S, Ito Y, et al. Comparison between indocyanine green angiography and fluorescein angiogra- phy in normal cats. Vet Ophthalmol 2017;20:310-5.
38. Menghini M, Lujan BJ, Zayit-Soudry S, et al. Correlation of outer nuclear layer thickness with cone density values in patients with retinitis pigmentosa and healthy subjects. In- vest Ophthalmol Vis Sci 2014;56:372-81.