© 2016 The Korean Ophthalmological Society
This is an Open Access article distributed under the terms of the Creative Commons Attribution Non-Commercial License (http://creativecommons.org/licenses /by-nc/3.0/) which permits unrestricted non-commercial use, distribution, and reproduction in any medium, provided the original work is properly cited.
Original Article
Refractive Errors in Koreans: The Korea National Health and Nutrition Examination Survey 2008-2012
Tyler Hyungtaek Rim1, Seung-Hyun Kim2, Key Hwan Lim3, Moonjung Choi1, Hye Young Kim4*, Seung-Hee Baek5*; Epidemiologic Survey Committee of the Korean Ophthalmological Society
1The Institute of Vision Research, Department of Ophthalmology, Severance Hospital, Yonsei University College of Medicine, Seoul, Korea
2Department of Ophthalmology, Korea University College of Medicine, Seoul, Korea
3Department of Ophthalmology, Ewha Womans University School of Medicine, Seoul, Korea
4Department of Ophthalmology, National Health Insurance Service Ilsan Hospital, Goyang, Korea
5Department of Ophthalmology, Kim’s Eye Hospital, Myung-Gok Eye Research Institute, Konyang University College of Medicine, Seoul, Korea
Purpose: Our study provides epidemiologic data on the prevalence of refractive errors in all age group ≥5 years in Korea.
Methods: In 2008 to 2012, a total of 33,355 participants aged ≥5 years underwent ophthalmologic examina- tions. Using the right eye, myopia was defined as a spherical equivalent (SE) less than -0.5 or -1.0 diopters (D) in subjects aged 19 years and older or as an SE less than -0.75 or -1.25 D in subjects aged 5 to 18 years according to non-cycloplegic refraction. Other refractive errors were defined as follows: high myopia as an SE less than -6.0 D; hyperopia as an SE larger than +0.5 D; and astigmatism as a cylindrical error less than -1.0 D.
The prevalence and risk factors of myopia were evaluated.
Results: Prevalence rates with a 95% confidence interval were determined for myopia (SE <-0.5 D, 51.9% [51.2 to 52.7]; SE <-1.0 D, 39.6% [38.8 to 40.3]), high myopia (5.0% [4.7 to 5.3]), hyperopia (13.4% [12.9 to 13.9]), and astigmatism (31.2% [30.5 to 32.0]). The prevalence of myopia demonstrated a nonlinear distribution with the highest peak between the ages of 19 and 29 years. The prevalence of hyperopia decreased with age in sub- jects aged 39 years or younger and then increased with age in subjects aged 40 years or older. The preva- lence of astigmatism gradually increased with age. Education was associated with all refractive errors; myopia was more prevalent and hyperopia and astigmatism were less prevalent in the highly educated groups.
Conclusions: In young generations, the prevalence of myopia in Korea was much higher compared to the white or black populations in Western countries and is consistent with the high prevalence found in most other Asian countries. The overall prevalence of hyperopia was much lower compared to that of the white Western popu- lation. Age and education level were significant predictive factors associated with all kinds of refractive errors.
Key Words: Astigmatism, Hyperopia, Myopia, Refractive errors
Received: April 4, 2015 Accepted: June 24, 2015
Corresponding Authors: Seung-Hee Baek, MD, PhD. Department of Ophthalmology, Kim’s Eye Hospital, Myung-Gok Eye Research Institute, Konyang University College of Medicine, #136 Yeongshin-ro, Youngdeungpo-gu, Seoul 07301, Korea. Tel: 82-2-2639-7811, Fax: 82-2-2633-3976, E-mail: drs- [email protected]
Hye Young Kim, MD. Department of Ophthalmology, National Health Insurance Service Ilsan Hospital, #100 Ilsan-ro, Ilsandong-gu, Goyang 10444, Ko- rea. Tel: 82-31-900-0590, Fax: 82-31-900-0049, E-mail: [email protected]
*These authors contributed equally to this work.
Refractive error is one of the most common causes of vi- sual impairment worldwide and is the second leading cause of treatable blindness [1]. An increasing number of epidemiologic studies focusing on refractive errors have been conducted, both in developing countries and in devel- oped countries [2-17]. However, there are few published studies that encompass all age groups and specifically re- port changes in prevalence with age. There are a few stud- ies [18,19] that have reported detailed data on the preva- lence of various refractive errors in the Korean population.
However, there is still little known about the prevalence of various refractive errors across age groups. South Korea has experienced rapid socioeconomic growth over the past several decades, and the estimated increase in the preva- lence of refractive errors is a major public health and so- cioeconomic concern.
The Korea National Health and Nutrition Examination Survey (KNHANES, http://knhanes.cdc.go.kr) is an annu- al nationally representative survey conducted by the Min- istry of Health and Welfare in South Korea. The Korean Ophthalmological Society has participated in this survey since July 2008 and has conducted ophthalmological inter- views and examinations with the purpose of elucidating the prevalence of common eye disorders, including refrac- tive errors. On behalf of the Epidemiologic Survey Com- mittee of the Korean Ophthalmological Society, we report the prevalence and risk factors of refractive errors in all age groups ≥5 years among the general South Korean pop- ulation derived from a nationwide epidemiological survey.
This study utilized all the data from ophthalmologic ex- aminations conducted in the KNAHNES from 2008 to 2012.
Materials and Methods
Statement of ethics
Ophthalmic examinations were conducted under the su- pervision of the Epidemiologic Survey Committee of the Korean Ophthalmological Society. This survey was re- viewed and approved by the institutional review board of the Korea Centers for Disease Control and Prevention (KCDC), and all participants provided written informed consent. The study was conducted in accordance with the Declaration of Helsinki.
Study design and population
A detailed description of the sampling, enumeration, vi- sual acuity, and ocular examination procedures was previ- ously published [18]. All examinations and health inter- views were conducted in mobile centers by trained team members, including ophthalmology residents or ophthal- mologists.
Examination methods and definition of refractive er- rors
Refractive errors and visual acuity were examined in subjects aged 5 years or older. Refractive error was mea- sured three times using an autorefractor-keratometer (KR8800; Topcon, Tokyo, Japan) under non-cycloplegic conditions. Average values of the three refraction measure- ments were printed from the autorefractor and were re- corded using a negative cylinder notation. Participants were excluded from analyses if any of the following was present: (1) aged less than 5 years; (2) a history of cataract surgery in the right eye; (3) a history of laser refractive surgery in the right eye; or (4) missing autorefractor data of the right eye due to lack of time, inability to comply with the protocol, or equipment malfunction. Prevalence was calculated using the refractive error data of 33,355 participants for the right eye only. The refractive data was converted to the spherical equivalent (SE), which was de- rived by adding the spherical component of the refraction to one-half the value of the cylindrical component. We de- fined myopia using two thresholds. For subjects aged 19 years or older, criteria were SE <-0.5 and <-1.0 diopters (D).
Since non-cycloplegic autorefraction is likely to be overes- timated in the young population, we used a more strict definition of myopia for subjects aged 5 to 18 years: SE
<-0.75 rather than SE <-0.5 D, and SE <-1.25 rather than SE <-1.0 D. High myopia was defined and analyzed as an SE <-6.0 D. Hyperopia was defined as an SE >+0.5 D.
Astigmatism was defined as a cylindrical error (Cyl) ≤-1.0 D, without reference to the axis. Astigmatism was defined as “with-the-rule” if the axis was between 0 and 15 or 165 and 180 degrees, as “against-the-rule” if the axis was be- tween 75 and 105 degrees, and as “oblique” if the axis was from 16 to 74 degrees or 106 to 164 degrees. Additionally, we provided the prevalence of refractive errors using the KCDC definition of the other eye in the supplementary material. Another study population was selected to assess
the KCDC definition of refractive errors of either eye. The KCDC defined refractive error as follows: myopia as SE
≤-0.75 D, hyperopia as SE ≥+1.0 D, astigmatism as Cyl
≤-0.75 D in either eye, and anisometropia as SE difference
≥2.0 D or as cylindrical difference ≥1.5 D between the eyes.
Independent variables
The analyzed sociodemographic variables were age, gender, household monthly income (lowest quintile/2nd to 4th quintile/highest quintile), highest educational level achieved (elementary school or lower/middle school/high school/college graduate or higher), and residential area (ru- ral: town [eup], township [myeon], or neighborhood [dong]/
urban: city [si], county [gun], and district [gu]). Quintiles of income were divided using the data from KNHANES 2008-2012 before the exclusion criteria were applied.
Statistical analysis
Basic study population characteristics were reported. To determine the age- and gender-standardized prevalence of refractive error, the prevalence was calculated according to the guidelines of the KNHANES 2008-2012 data analy- sis using a poststratification adjustment. Poststratified weight was calculated based on the response and ex- traction rates in order to reflect the distribution of the 2010 Korean population by age groups of 5-year intervals and by gender. Consequently, the sum of the weight according to KNHANES 2008-2012 was representative of the Kore- an population as of 2010. Data was analyzed using the sur- vey procedure of Stata SE ver. 13 (Stata Co., College Sta- tion, TX, USA) to account for the sample design and sampling weight adjusted for oversampling and nonre- sponders. Multivariate logistic regression analysis includ- ing age, gender, household monthly income, education, and residential area was conducted to identify the sociode- mographic risk factors of refractive errors. Adjusted odds ratios and 95% confidence intervals (CIs) were calculated.
Only adults aged 19 years or older, assumed to be finished growing, were included for evaluating risk factors of vari- ous refractive errors. Results with p-values less than 0.05 were considered statistically significant.
Results
Baseline characteristics of the study population A comparison of the demographic characteristics of the 33,355 subjects included in this study with those excluded from this study (n = 3,519) is provided in Table 1. Included participants were more likely to be younger, male, in a higher income group, and living in an urban area than those who were excluded from this analysis. Another study population for estimating prevalence of refractive errors using KCDC definition included 33,922 participants.
Age- and gender-standardized prevalence
Table 2 provides the age- and gender-standardized prev- alence of refractive errors in the right eyes. The prevalence with a 95% CI was determined for myopia (SE <-0.5 D, 51.9% [51.2 to 52.7]; SE <-1.0 D, 39.6% [38.8 to 40.3]), high myopia (5.0% [4.7 to 5.3]), hyperopia (13.4% [12.9 to 13.9]), and astigmatism (31.2% [30.5 to 32.0]) in all participants
≥5 years of age. The prevalence of myopia had a nonlinear distribution with the highest peak between the ages of 19 and 29 years, with a minor increase in subjects older than 70 years for both thresholds of myopia of -0.5 D and -1.0 D.
High myopia showed a similar pattern to myopia, with the highest prevalence of 10.2% in the age group of 19 to 29 years, but without the minor increase in subjects over 70 years. The prevalence of hyperopia was lowest in subjects in their 30s (1.6%; CI, 1.2 to 2.1); it decreased with age in subjects aged 39 years or younger and then increased with age in subjects aged 40 years or older, with an abrupt in- crease in subjects aged 50 years or older. The prevalence of astigmatism gradually increased with age with a slight de- crease around 30 to 39 year ages. Table 3 provides the prevalence of refractive errors using the KCDC definition.
Fig. 1 shows 100% stacked column charts of the refrac- tive error distribution in the right eye by age group. Myo- pia was more prevalent in children, adolescents, and young adults, whereas hyperopia was more prevalent among very young children of 5 to 6 years of age, middle-age, and el- derly subjects (Fig. 1A). Hyperopia showed a relatively lower prevalence of less than 5% from 12 to 49 years of age. The proportion of emmetropia between -0.5 and +0.5 D started at approximately 60% in children 5 to 6 years of age, decreased in adolescents 12 to 18 years old, increased
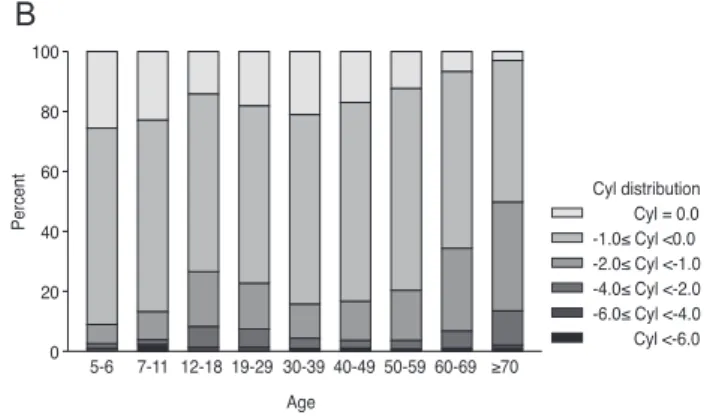
to approximately 40% in subjects 50 to 59 years of age, and then decreased with increasing age thereafter. The prevalence of astigmatism generally increased with age, with a relatively low prevalence in the 30 to 39 year age group (Fig. 1B). Older adults were more likely to have
“against-the-rule” astigmatism than were younger people (Fig. 1C).
Sociodemographic factors associated with refractive error in adults
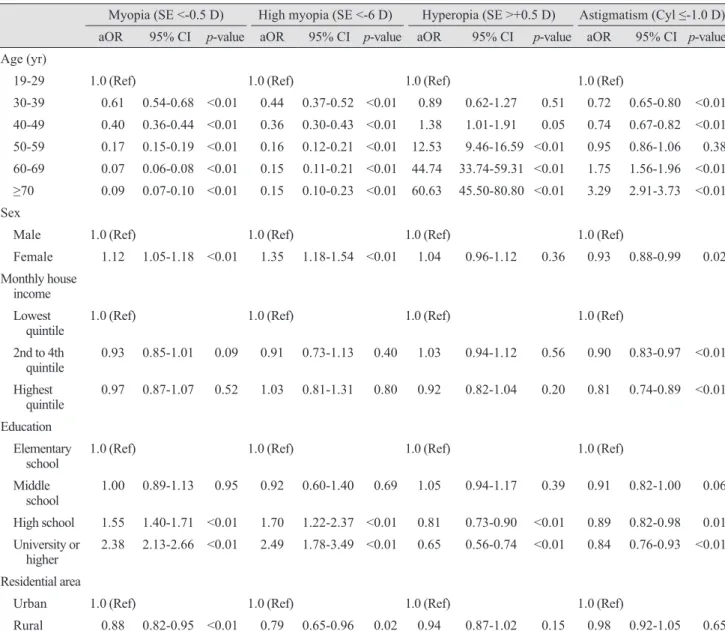
Table 4 provides the sociodemographic factors associat- ed with refractive errors according to multivariate analysis of participants aged 19 years or older, reported with odds ratio and 95% CI. Among participants ≥19 years of age, risk of myopia and high myopia decreased and that of hy- peropia and astigmatism increased with age. Female gen- der, higher education level, and urban residence were asso- ciated with a higher risk of both myopia and high myopia,
whereas those with higher education levels were at signifi- cantly lower risk of hyperopia. Female gender, higher household income, and higher education were significant protective factors against astigmatism.
Discussion
This study documented the prevalence of various refrac- tive errors in the South Korean population ≥5 years of age based on a nationwide health survey and outlined indepen- dent sociodemographic risk factors for each refractive er- ror.
Myopia and high myopia
The prevalence of myopia in children varies highly across regions, and our relatively high prevalence (73.0%
in subjects between 12 and 18 years of age) was similar to Table 1. Demographics of the study participants from the Korea National Health and Nutrition Examination Survey 2008-2012
Included (n = 33,355) Excluded (n = 3,519) p-value
Age (yr) <0.01
5-19 7,486 (22.4) 193 (5.5)
20-39 8,049 (24.1) 822 (23.4)
40-59 10,283 (30.8) 546 (15.5)
60-69 4,365 (13.1) 557 (15.8)
≥70 3,172 (9.5) 1,401 (39.8)
Sex <0.01
Male 15,165 (45.5) 1,301 (37.0)
Female 18,190 (54.5) 2218 (63.0)
Household income <0.01
Lowest quintile 5,841 (17.8) 1,205 (34.9)
2nd to 4th quintile 19,462 (59.2) 1,568 (45.4)
Highest quintile 7,602 (23.1) 682 (19.7)
Education level <0.01
Elementary school or lower 12,040 (36.7) 1,523 (46.6)
Middle school graduate 4,168 (12.7) 296 (9.1)
High school graduate 9,284 (28.3) 657 (20.1)
College graduate or higher 7,352 (22.4) 790 (24.2)
Residence <0.01
Urban 26,369 (79.1) 2,589 (73.6)
Rural 6,986 (20.9) 930 (26.4)
Values are presented as number (%); Chi-square’s test was used to calculate the p-value.
those of other Asian countries, which have been shown to have some of the highest prevalence rates of myopia in the world [20]. A recent study of Sydney schoolchildren showed ethnic differences in myopia prevalence; children of East Asian ethnicity had a higher incidence of myopia than European Caucasian children [21]. The trend of in- creasing prevalence of myopia with increasing age in chil- dren and adolescents was explicitly evident in this study, which is also consistent with studies of children from Chi- na [6,10,17], Taiwan [9], Chile [7], and Germany [14]. On the other hand, the prevalence of myopia in Nepal was lower than that of other countries, without clear increasing or decreasing trends [8]. These different tendencies in my- opia prevalence by age in children might be caused by dif-
ferent myopia-driving socioenvironmental factors in dif- ferent regions, such as urbanization with an increase of formal education.
Among the young adults aged 20 to 39 years, the preva- lence of myopia and high myopia were higher compared to those of the white population in the United States [13], and this high prevalence was similar to other countries in Asia [22,23]. Myopia and high myopia seem to be more preva- lent in Asia compared to all races in the United States, es- pecially in the younger generations [13]. Unlike the large differences in prevalence across regions among young adults aged 20 to 39 years, the prevalence of myopia in the 40 years or older age group seemed to be similar across re- gions; even when differences were noted by region, the Table 2. Age-standardized prevalence of refractive errors in the right eye (n = 33,355)
Age (yr)
Myopia
(SE <-0.5 D) Myopia
(SE <-1.0 D) High myopia
(SE <-6.0 D) Hyperopia
(SE >+0.5 D) Astigmatism (Cyl ≤-1.0 D)
% 95% CI % 95% CI % 95% CI % 95% CI % 95% CI
Overall
5-6 13.2 10.8-16.1 8.0 6.1-10.5 0.1 0.0-0.5 16.4 13.8-19.5 14.1 11.7-16.8
7-11 48.2 45.9-50.6 37.3 35.1-39.7 2.1 1.6-2.9 5.3 4.3-6.5 17.1 15.5-18.8
12-18 73.0 71.0-74.8 62.6 60.4-64.7 9.3 8.1-10.6 2.6 2.0-3.4 34.0 31.7-36.3
19-29 76.4 74.6-78.1 62.8 60.8-64.8 10.2 9.1-11.5 2.2 1.6-2.9 30.8 28.9-32.8
30-39 68.0 66.4-69.5 52.4 50.7-54.2 5.8 5.1-6.6 1.6 1.2-2.1 23.6 22.2-25.1
40-49 55.3 53.7-56.9 38.3 36.6-39.9 4.5 3.9-5.3 3.6 3.1-4.3 25.5 24.1-27.0
50-59 29.6 28.1-31.1 18.0 16.7-19.3 1.5 1.1-2.0 23.3 21.9-24.6 31.8 30.2-33.4 60-69 14.2 13.0-15.5 8.9 7.9-10.1 1.2 0.9-1.6 52.1 50.4-53.9 48.6 46.8-50.5
≥70 16.6 15.0-18.3 11.6 10.3-13.2 1.1 0.8-1.6 58.0 55.9-60.1 63.6 61.6-65.5
Overall
≥5 51.9 51.2-52.7 39.6 38.8-40.3 5.0 4.7-5.3 13.4 12.9-13.9 31.2 30.5-32.0
≥20 49.9 49.0-50.8 36.9 36.1-37.8 4.6 4.2-4.9 15.7 15.1-16.3 32.3 31.5-33.1
≥40 35.3 34.4-36.3 23.5 22.6-24.4 2.6 2.3-2.9 24.9 24.1-25.7 36.1 35.2-37.1
Men
≥5 52.7 51.6-53.7 40.4 39.4-41.5 4.6 4.2-5.0 11.9 11.3-12.5 31.3 30.3-32.3
≥20 50.8 49.6-52.1 38.0 36.8-39.2 4.1 3.7-4.6 13.9 13.2-14.7 32.0 30.9-33.2
≥40 36.3 34.9-37.8 24.5 23.3-25.8 2.4 2.0-2.9 22.9 21.8-24.0 34.3 33.0-35.7
Women
≥5 51.2 50.2-52.2 38.6 37.7-39.6 5.4 4.9-5.9 15.0 14.4-15.7 31.1 30.2-32.1
≥20 48.9 47.9-50.0 35.8 34.8-36.9 5.0 4.6-5.6 17.4 16.7-18.2 32.6 31.6-33.6
≥40 34.4 33.2-35.6 22.6 21.5-23.7 2.7 2.3-3.2 26.8 25.8-27.8 37.9 36.7-39.0
Myopia was defined as SE <-0.75 D and SE <-1.25 D for subjects aged 5 to 18 years. Complex sample analysis was performed with refer- ence to weight, stratification variance, and cluster variance, following the statistical guidelines of the Korea Centers for Disease Control and Prevention. Age- and gender-standardized prevalence was provided based on post-stratified weight.
SE = spherical equivalent; D = diopters; CI = confidence interval; Cyl = cylindrical error.
difference was not large [5,13,15,24]. The overall pattern of prevalence of myopia being higher in younger adults and lower in the elderly in this study was consistent with that of urbanized populations of Singapore [5,12], southern In- dia [25], and the white United States population [2]. Urban- ization and economic development including increasing level of education combined with genetic susceptibility might contribute to increasing trends of myopia in younger generations compared to older generations in these areas.
The prevalence changes across age groups in this report were similar to those of other developing countries in Asia, which might reflect the age-related prevalence pattern of myopia in Asian countries with similar levels of urbaniza-
tion. A myopic shift due to cataract might explain the mi- nor increase of myopia in the participants ≥70 years of age.
This pattern has been shown consistently in several studies of different ethnic groups, including Japanese subjects [24], all three ethnic groups in Singapore [5,12,16], Latinos in Los Angeles (United States) [26], and residents of Barba- dos [4].
A previous study comparing the prevalence of myopia in the United States between 1970 and 2000 revealed that the increase in the prevalence of myopia was more prominent in black participants than in white participants, and the re- searchers explained this by the increase of formal educa- tion, associated with associated with near work demands, Table 3. Age-standardized prevalence of refractive errors in either eye according to the Korea Centers for Disease Control and Prevention definition (n = 33,922)
Age (yr) Myopia (SE ≤-0.75 D) Hyperopia (SE ≥+1.00 D) Astigmatism (Cyl ≤-0.75 D) Anisometropia
% 95% CI % 95% CI % 95% CI % 95% CI
Overall
5-6 20.4 17.5-23.6 8.7 6.8-11.0 33.7 30.0-37.5 2.8 1.7-4.4
7-11 58.4 56.0-60.7 4.4 3.5-5.5 41.2 39.0-43.4 4.0 3.2-4.9
12-18 80.2 78.4-81.9 2.8 2.2-3.7 61.9 59.7-64.1 6.7 5.7-7.9
19-29 76.9 75.1-78.5 2.1 1.6-2.8 57.6 55.6-59.6 6.2 5.2-7.3
30-39 68.5 66.9-70.1 1.2 0.9-1.6 50.3 48.5-52.0 5.0 4.4-5.8
40-49 54.9 53.2-56.6 2.5 2.1-3.1 54.0 52.4-55.6 5.4 4.7-6.2
50-59 30.0 28.5-31.5 16.2 15.0-17.4 64.7 63.1-66.3 4.1 3.5-4.7
60-69 15.0 13.7-16.3 43.2 41.5-44.9 79.5 78.0-80.9 7.4 6.5-8.4
≥70 18.0 16.4-19.7 50.3 48.2-52.3 89.4 88.1-90.6 17.0 15.2-18.8
Overall
≥5 53.5 52.7-54.3 11.0 10.5-11.4 59.5 58.8-60.3 6.0 5.7-6.4
≥20 49.9 49.0-50.8 12.8 12.3-13.3 61.2 60.3-62.0 6.2 5.8-6.6
≥40 35.3 34.4-36.3 20.1 19.4-20.8 66.4 65.5-67.3 6.6 6.2-7.1
Men
≥5 54.2 53.2-55.3 9.5 9.0-10.0 58.6 57.6-59.7 5.8 5.4-6.3
≥20 50.8 49.5-52.0 11.1 10.4-11.7 60.1 58.9-61.3 5.9 5.4-6.5
≥40 36.0 34.7-37.4 18.0 17.1-19.0 63.9 62.6-65.2 6.0 5.3-6.7
Women
≥5 52.8 51.8-53.8 12.5 11.9-13.1 60.4 59.5-61.4 6.2 5.8-6.7
≥20 49.1 48.0-50.1 14.6 13.9-15.2 62.2 61.2-63.2 6.4 5.9-6.9
≥40 34.7 33.5-35.9 22.1 21.2-23.0 68.7 67.6-69.9 7.2 6.6-7.9
Anisometropia was defined as an SE difference ≥2.0 D or a cylindrical difference ≥1.5 D in either eye. Complex sample analysis was performed with reference to weight, stratification variance, and cluster variance, following the statistical guidelines of the Korea Centers for Disease Control and Prevention. Age- and gender-standardized prevalence and age-standardized prevalence was provided based on post-stratified weight.
SE = spherical equivalent; D = diopters; CI = confidence interval; Cyl = cylindrical error.
in the black population [27]. The increased prevalence from around 20% in adults to over 70% in younger gener- ations in this study can be explained using a cohort effect associated with urbanization and economic development combined with genetic susceptibility, rather than a direct effect of aging alone.
Hyperopia
In Asia, the prevalence of hyperopia has been reported to be around 20% to 35% among adults [5,12,28], which is similar to our data (24.9% in subjects, ≥40 years of age).
When hyperopia was defined as SE ≥+0.5 D, the preva- lence of hyperopia in the ≥40 years age group was about 20% greater than that of whites in Wisconsin, as reported by the Beaver Dam Eye Study (BDES) (49.0% in BDES;
28.0% in this KNHANES population, unpresented data) [2]. The prevalence of hyperopia, defined as SE >+0.5 D, was also higher in Australia (Blue Mountains Eye Study, BMES) [3] compared to Korea based on a similar age group of 44 years or older (55.6% in BMES; 36.5% in this KNHANES population, unpresented data). The low hyper- opia prevalence in the 40 to 49 year age group (3.6%) might have contributed to this lower prevalence of hypero-
pia in Korean adults and can also be considered a result of a myopic shift in younger generations. The prevalence of hyperopia can be represented as a U-shaped curve, de- creasing with age until the fourth decade, then abruptly increasing from the sixth decade onward (Table 2 and Fig.
1A). In children, the tendency of decreasing hyperopia with age was consistent with studies conducted in various other areas [6,10,17]. In adults, the trend of increasing hy- peropia prevalence with age was shown in the NHANES [13], both the Chinese and Malay populations of Singapore [5,12], Sumatra [28], Germany [14], and the Baltimore Eye Study [29], although the specific ages for the beginning and end of the shifts varied across studies. Other epide- miologic studies have reported that, after the age of 60 years, the prevalence of hyperopia is no longer associated with age [2-4,29,30]. In Korea, the cataract surgery rate among the population in their 80s is almost 50% [31].
Therefore, the hyperopia prevalence might have been over- estimated in our elderly subjects because severe cataracts that drive a myopic shift were more likely to have been re- moved by cataract surgery, and therefore, excluded from this study.
SE distribution +3.0< SE +1.0< SE ≤+3.0 +0.5< SE ≤+1.0 -0.5≤ SE ≤+0.5 -1.0≤ SE <-0.5 -5.0≤ SE <-1 -6.0≤ SE <-5.0 SE <-6.0 Age
Percent
5-6 7-11 12-18 19-29 30-39 40-49 50-59 60-69 ≥70 100
80 60 40 20 0
Cyl distribution Cyl = 0.0 -1.0≤ Cyl <0.0 -2.0≤ Cyl <-1.0 -4.0≤ Cyl <-2.0 -6.0≤ Cyl <-4.0 Cyl <-6.0 Age
Percent
5-6 7-11 12-18 19-29 30-39 40-49 50-59 60-69 ≥70 100
80 60 40 20 0
Axis distribution Oblique Against-the-rule With-the-rule Age
Percent
5-6 7-11 12-18 19-29 30-39 40-49 50-59 60-69 ≥70 100
80 60 40 20 0
A
C
B
Fig. 1. Age-specific proportions of refractive errors in the right eye by (A) spherical equivalent (SE), (B) cylindrical error (Cyl), and (C) axis distribution of astigmatism (n = 33,355).
Astigmatism
Astigmatism (Cyl, ≤-1.0 D) was found in 14.1% of the Korean population aged 5 to 6 years. Among children aged less than 6 years, ethnic differences in the prevalence of astigmatism seem to exist, as Caucasians were less likely to have astigmatism compared to other ethnicities [32].
Astigmatism (Cyl, ≤-1.0 D) was found in 36.1% of this Ko- rean population aged 40 years or older, which was similar to the prevalence found in adults in Sumatra (35.8%) [28]
and the whole adult population of the NHANES in 1999 to 2004 (31.0%) [13] and slightly higher than that of the Sin-
gapore Malays (27.8%) and lower than that of the Singa- pore Chinese population (44.2%) [28]. The prevalence of astigmatism demonstrated an increasing trend with age, which is consistent with previous studies [11,12,29].
In our population, “with-the-rule” astigmatism was dominant in children and young adults, and the proportion of “against-the-rule” astigmatism increased with age after young adulthood. This trend was also reported in southern India [25]. It is not possible to make a direct conclusion about lifetime changes in astigmatism from this cross-sec- tional study; however, our results indicate that “against- the-rule” astigmatism is caused by changes related to aging.
Table 4. Sociodemographic risk factors of refractive errors in the Korean population ≥19 years of age-multivariate logistic analysis (n = 26,174)
Myopia (SE <-0.5 D) High myopia (SE <-6 D) Hyperopia (SE >+0.5 D) Astigmatism (Cyl ≤-1.0 D) aOR 95% CI p-value aOR 95% CI p-value aOR 95% CI p-value aOR 95% CI p-value Age (yr)
19-29 1.0 (Ref) 1.0 (Ref) 1.0 (Ref) 1.0 (Ref)
30-39 0.61 0.54-0.68 <0.01 0.44 0.37-0.52 <0.01 0.89 0.62-1.27 0.51 0.72 0.65-0.80 <0.01 40-49 0.40 0.36-0.44 <0.01 0.36 0.30-0.43 <0.01 1.38 1.01-1.91 0.05 0.74 0.67-0.82 <0.01 50-59 0.17 0.15-0.19 <0.01 0.16 0.12-0.21 <0.01 12.53 9.46-16.59 <0.01 0.95 0.86-1.06 0.38 60-69 0.07 0.06-0.08 <0.01 0.15 0.11-0.21 <0.01 44.74 33.74-59.31 <0.01 1.75 1.56-1.96 <0.01
≥70 0.09 0.07-0.10 <0.01 0.15 0.10-0.23 <0.01 60.63 45.50-80.80 <0.01 3.29 2.91-3.73 <0.01 Sex
Male 1.0 (Ref) 1.0 (Ref) 1.0 (Ref) 1.0 (Ref)
Female 1.12 1.05-1.18 <0.01 1.35 1.18-1.54 <0.01 1.04 0.96-1.12 0.36 0.93 0.88-0.99 0.02 Monthly house
income Lowest
quintile 1.0 (Ref) 1.0 (Ref) 1.0 (Ref) 1.0 (Ref)
2nd to 4th
quintile 0.93 0.85-1.01 0.09 0.91 0.73-1.13 0.40 1.03 0.94-1.12 0.56 0.90 0.83-0.97 <0.01 Highest
quintile 0.97 0.87-1.07 0.52 1.03 0.81-1.31 0.80 0.92 0.82-1.04 0.20 0.81 0.74-0.89 <0.01 Education
Elementary
school 1.0 (Ref) 1.0 (Ref) 1.0 (Ref) 1.0 (Ref)
Middle
school 1.00 0.89-1.13 0.95 0.92 0.60-1.40 0.69 1.05 0.94-1.17 0.39 0.91 0.82-1.00 0.06 High school 1.55 1.40-1.71 <0.01 1.70 1.22-2.37 <0.01 0.81 0.73-0.90 <0.01 0.89 0.82-0.98 0.01 University or
higher 2.38 2.13-2.66 <0.01 2.49 1.78-3.49 <0.01 0.65 0.56-0.74 <0.01 0.84 0.76-0.93 <0.01 Residential area
Urban 1.0 (Ref) 1.0 (Ref) 1.0 (Ref) 1.0 (Ref)
Rural 0.88 0.82-0.95 <0.01 0.79 0.65-0.96 0.02 0.94 0.87-1.02 0.15 0.98 0.92-1.05 0.65 SE = spherical equivalent; D = diopters; aOR = adjusted odds ratio; CI = confidence interval; Cyl = cylindrical error.
Sociodemographic factors and refractive error
This study confirmed the associations between age, household monthly income, education, and residential area and various refractive errors. Age and education were as- sociated with all types of refractive errors. Women, those with a higher education level, and those living in an urban area were more likely to be myopic. It is difficult to form a firm conclusion regarding the association between gender and myopia prevalence considering the inconsistent results reported in previous studies [2,5,11-13]. Higher education [5,12,13,29,30] and urban residence [11] were generally con- sidered risk factors for myopia, and our results support this association. Some studies, including the NHANES [13], the Tanjong Pagar Survey [5], and the Sumatra Eye Study [28], found that higher income is associated with an in- creasing prevalence of myopia; however, the present study did not show a significant association. Respondents with a higher level of education were less likely to have hyperopia in this study. Hyperopia was also reported to have a lower prevalence in respondents with a higher educational level in the Singapore Malay Eye Survey [12] and the Sumatra Eye Study [28]; however, the Meiktila Eye Study per- formed in rural Myanmar [33] reported a higher preva- lence of hyperopia in subjects with higher education. In terms of astigmatism, higher educational level was associ- ated with lower prevalence of astigmatism in our results.
The Sumatra Eye study found no significant relationship between education level and astigmatism [28], whereas the Beijing Eye Study showed that astigmatism was associated with a low educational background [11].
The major strength of this study is that it used a large- scale, population-based sample that represents the entire general South Korean population across all ages. We report the prevalence of refractive errors, on behalf of the Epide- miologic Survey Committee of the Korean Ophthalmolog- ical Society, using data from 33,355 participants including all age groups ≥5 years, including the entire ophthalmic data of the KNHANES series. Our study has several lim- itations. As previously stated, the prevalence of myopia in children could have been overestimated, since cycloplegic refraction could not be performed due to the time con- straints imposed by the comprehensive KNHANES exam- ination. Accommodation might have affected the refrac- tive error measurement, particularly in young children, although the autorefractor used an auto-fogging technique to minimize accommodation. Consequently, the preva-
lence of myopia could have been overestimated and that of hyperopia could have been underestimated in these young children [34]. However, the difference in refractive error caused by accommodation is likely not very large; a previ- ous large epidemiologic study on Beijing children reported that the mean difference in autorefractometry with or without cycloplegia was only 0.29 ± 0.40 D in myopic eyes (SE <-0.5 D) [35]. Nonetheless, we used a higher SE value to define myopia, i.e., SE ≤-1.0 rather than ≤-0.75 D, in children and adolescents (aged 5 to 18) in order to mini- mize overestimation of myopia prevalence due to non-cy- cloplegic autorefraction. Second, the characteristics of par- ticipants were different from those of nonparticipants;
KNHANES 2009-2012 participants who were included in this study were more likely to be young, male, in a higher income group, and living in an urban area than were those who were excluded from this study. However, we present- ed our results based on our inclusion criteria, and analyses of the subjects who had undergone ophthalmologic surgery that would affect refractive errors such as cataract surgery or laser refractive surgeries were excluded from our inves- tigation, as has been done in other epidemiological studies.
In conclusion, we provide the prevalence of refractive errors in all age groups ≥5 years using a national represen- tative sample. Our findings demonstrated that the preva- lence of myopia was higher and that the prevalence of hy- peropia was lower than those previously reported in Western countries. The prevalence of myopia was much higher in adolescents and young adults compared to the other age groups, which is consistent with that of other East Asian countries.
Conflict of Interest
No potential conflict of interest relevant to this article was reported.
References
1. Resnikoff S, Pascolini D, Mariotti SP, Pokharel GP. Global magnitude of visual impairment caused by uncorrected re- fractive errors in 2004. Bull World Health Organ 2008;86:
63-70.
2. Wang Q, Klein BE, Klein R, Moss SE. Refractive status in
the Beaver Dam Eye Study. Invest Ophthalmol Vis Sci 1994;35:4344-7.
3. Attebo K, Ivers RQ, Mitchell P. Refractive errors in an old- er population: the Blue Mountains Eye Study. Ophthalmol- ogy 1999;106:1066-72.
4. Wu SY, Nemesure B, Leske MC. Refractive errors in a black adult population: the Barbados Eye Study. Invest Ophthalmol Vis Sci 1999;40:2179-84.
5. Wong TY, Foster PJ, Hee J, et al. Prevalence and risk fac- tors for refractive errors in adult Chinese in Singapore. In- vest Ophthalmol Vis Sci 2000;41:2486-94.
6. Zhao J, Pan X, Sui R, et al. Refractive Error Study in Chil- dren: results from Shunyi District, China. Am J Ophthal- mol 2000;129:427-35.
7. Maul E, Barroso S, Munoz SR, et al. Refractive Error Study in Children: results from La Florida, Chile. Am J Ophthalmol 2000;129:445-54.
8. Pokharel GP, Negrel AD, Munoz SR, Ellwein LB. Refrac- tive Error Study in Children: results from Mechi Zone, Ne- pal. Am J Ophthalmol 2000;129:436-44.
9. Lin LL, Shih YF, Hsiao CK, et al. Epidemiologic study of the prevalence and severity of myopia among schoolchil- dren in Taiwan in 2000. J Formos Med Assoc 2001;100:684- 91.
10. He M, Zeng J, Liu Y, et al. Refractive error and visual im- pairment in urban children in southern China. Invest Oph- thalmol Vis Sci 2004;45:793-9.
11. Xu L, Li J, Cui T, et al. Refractive error in urban and rural adult Chinese in Beijing. Ophthalmology 2005;112:1676-83.
12. Saw SM, Chan YH, Wong WL, et al. Prevalence and risk factors for refractive errors in the Singapore Malay Eye Survey. Ophthalmology 2008;115:1713-9.
13. Vitale S, Ellwein L, Cotch MF, et al. Prevalence of refrac- tive error in the United States, 1999-2004. Arch Ophthal- mol 2008;126:1111-9.
14. Jobke S, Kasten E, Vorwerk C. The prevalence rates of re- fractive errors among children, adolescents, and adults in Germany. Clin Ophthalmol 2008;2:601-7.
15. Krishnaiah S, Srinivas M, Khanna RC, Rao GN. Preva- lence and risk factors for refractive errors in the South In- dian adult population: the Andhra Pradesh Eye disease study. Clin Ophthalmol 2009;3:17-27.
16. Pan CW, Wong TY, Lavanya R, et al. Prevalence and risk factors for refractive errors in Indians: the Singapore Indi- an Eye Study (SINDI). Invest Ophthalmol Vis Sci 2011;
52:3166-73.
17. Wu JF, Bi HS, Wang SM, et al. Refractive error, visual acuity and causes of vision loss in children in Shandong, China: the Shandong Children Eye Study. PLoS One 2013;
8:e82763.
18. Yoon KC, Mun GH, Kim SD, et al. Prevalence of eye dis- eases in South Korea: data from the Korea National Health and Nutrition Examination Survey 2008-2009. Korean J Ophthalmol 2011;25:421-33.
19. Kim EC, Morgan IG, Kakizaki H, et al. Prevalence and risk factors for refractive errors: Korean National Health and Nutrition Examination Survey 2008-2011. PLoS One 2013;8:e80361.
20. Saw SM, Katz J, Schein OD, et al. Epidemiology of myo- pia. Epidemiol Rev 1996;18:175-87.
21. French AN, Morgan IG, Mitchell P, Rose KA. Risk factors for incident myopia in Australian schoolchildren: the Syd- ney adolescent vascular and eye study. Ophthalmology 2013;120:2100-8.
22. Rasmussen OD. Incidence of myopia in China: data and theses from periodical investigations covering thirty years residence, and association with refracting and hospital cen- tres, in a score of the larger cities. Br J Ophthalmol 1936;
20:350-60.
23. Wu HM, Seet B, Yap EP, et al. Does education explain eth- nic differences in myopia prevalence? A population-based study of young adult males in Singapore. Optom Vis Sci 2001;78:234-9.
24. Sawada A, Tomidokoro A, Araie M, et al. Refractive errors in an elderly Japanese population: the Tajimi study. Oph- thalmology 2008;115:363-70.e3.
25. Dandona R, Dandona L, Naduvilath TJ, et al. Refractive errors in an urban population in Southern India: the Andhra Pradesh Eye Disease Study. Invest Ophthalmol Vis Sci 1999;40:2810-8.
26. Tarczy-Hornoch K, Ying-Lai M, Varma R. Myopic refrac- tive error in adult Latinos: the Los Angeles Latino Eye Study. Invest Ophthalmol Vis Sci 2006;47:1845-52.
27. Vitale S, Sperduto RD, Ferris FL 3rd. Increased prevalence of myopia in the United States between 1971-1972 and 1999-2004. Arch Ophthalmol 2009;127:1632-9.
28. Saw SM, Gazzard G, Koh D, et al. Prevalence rates of re- fractive errors in Sumatra, Indonesia. Invest Ophthalmol Vis Sci 2002;43:3174-80.
29. Katz J, Tielsch JM, Sommer A. Prevalence and risk factors for refractive errors in an adult inner city population. In- vest Ophthalmol Vis Sci 1997;38:334-40.
30. Wensor M, McCarty CA, Taylor HR. Prevalence and risk factors of myopia in Victoria, Australia. Arch Ophthalmol 1999;117:658-63.
31. Rim TH, Woo YJ, Park HJ, Kim SS. Current status and fu- ture expectations of cataract surgery in Korea: KNHANES IV. J Korean Ophthalmol Soc 2014;55:1772-8.
32. Wen G, Tarczy-Hornoch K, McKean-Cowdin R, et al.
Prevalence of myopia, hyperopia, and astigmatism in non-Hispanic white and Asian children: multi-ethnic pedi- atric eye disease study. Ophthalmology 2013;120:2109-16.
33. Gupta A, Casson RJ, Newland HS, et al. Prevalence of re- fractive error in rural Myanmar: the Meiktila Eye Study.
Ophthalmology 2008;115:26-32.
34. Fotouhi A, Morgan IG, Iribarren R, et al. Validity of non- cycloplegic refraction in the assessment of refractive errors:
the Tehran Eye Study. Acta Ophthalmol 2012;90:380-6.
35. You QS, Wu LJ, Duan JL, et al. Factors associated with myopia in school children in China: the Beijing Childhood Eye Study. PLoS One 2012;7:e52668.