http://e-nrp.org
Association of circulating 25-hydroxyvitamin D levels with hypertension and blood pressure values in Korean adults:
A Mendelian randomization study on a subset of the Korea National Health and Nutrition Survey 2011-2012 population
So-Young Kwak1, Yoonsu Cho1,2, Hannah Oh1 and Min-Jeong Shin1§
1Department of Public Health Sciences, BK21PLUS Program in Embodiment: Health-Society Interaction, Graduate School, Korea University, Seoul 02841, Republic of Korea
2MRC Integrative Epidemiology Unit, Population Health Sciences, Bristol Medical School, University of Bristol, Bristol BS8 2BN, United Kingdom
BACKGROUND/OBJECTIVES: Lower circulating 25-hydroxyvitamin D [25(OH)D] levels are associated with a higher risk of hypertension (HTN); however, it remains unclear whether the relationship is causal. We aimed to evaluate the causal effects of circulating 25(OH)D levels on the prevalence of HTN in the Korean population using the Mendelian randomization (MR) approach.
SUBJECTS/METHODS: Epidemiological data, serum 25(OH)D data, and genomic DNA biospecimens were obtained from 2,591 participants, a subset of the study population in the Korea National Health and Nutrition Survey 2011-2012. Five 25(OH)D-related single nucleotide polymorphisms (SNPs; DHCR7 rs12785878, CYP2R1 rs10741657, CYP2R1 rs12794714, CYP24A1 rs6013897, and GC rs2282679), identified a priori from genome-wide association studies, were used as instrument variables (IVs) for serum 25(OH)D levels. In the MR analysis, we performed IV analyses using the two-stage least squares method.
RESULTS: In the observational analysis, circulating 25(OH)D levels were found to be inversely associated with the HTN prevalence in ordinary least squares models (odds ratio: 0.97, 95% confidence interval: 0.96, 0.99) after adjusting for the potential confounders.
There were differences in the circulating 25(OH)D levels across genotypes of individual SNPs. In the MR analysis, using individual SNPs as IVs, 25(OH)D levels were not associated with the HTN prevalence.
CONCLUSIONS: We found no association between genetically determined circulating 25(OH)D levels and HTN in Korean adults.
Our results are listed owing to the relatively small sample size and possible weak instrument bias; therefore, further studies are needed to confirm these results.
Nutrition Research and Practice 2019;13(6):498-508; https://doi.org/10.4162/nrp.2019.13.6.498; pISSN 1976-1457 eISSN 2005-6168 Keywords: Vitamin D, hypertension, blood pressure, causality
INTRODUCTION5)
There have been inconsistent reports on the association between serum vitamin D levels and the risk of hypertension (HTN). Meta-analyses of prospective studies [1,2] and cross- sectional studies [1] have shown that low vitamin D levels are associated with an increased risk of HTN. In contrast, a meta-analysis of 30 randomized controlled trials failed to show evidence of an association, suggesting that vitamin D supple- mentation may not result in an overall reduction in the blood pressure (BP) value [3]. Therefore, it remains unclear whether the role of vitamin D in BP and HTN is causal.
Estimates derived from observational studies may be biased
because of confounders (environmental and behavioral), systematic error, and/or reverse causation [1,2]. For example, the association between serum 25-hydroxyvitamin D [25(OH)D]
levels and HTN could be explained by other factors (e.g., obesity) that affect serum 25(OH)D levels and HTN risk [1,4,5].
These factors may confound the association between serum 25(OH)D levels and HTN, giving biased results. Even after appropriate adjustments, we were unable to eliminate the effect of all the potential confounders. Moreover, several studies have suggested that low serum 25(OH)D levels result from disease progression, indicating the possibility of reverse causality [6].
Low serum 25(OH)D levels can be influenced by HTN onset, indicating the possibility of reverse causation [6,7]. Furthermore,
This research was supported by the Basic Science Research Program through the National Research Foundation of Korea (NRF) and funded by the Ministry of Education, Science, and Technology (NRF-2019R1F1A1063744) and by the Bio & Medical Technology Development Program of the NRF funded by the Ministry of Science & ICT (NRF-2012M3A9C4048761).
§Corresponding Author: Min-Jeong Shin, Tel. 82-2-3290-5643, Fax. 82-2-940-2849, Email. [email protected] Received: January 15, 2019, Revised: May 8, 2019, Accepted: June 17, 2019
This is an Open Access article distributed under the terms of the Creative Commons Attribution Non-Commercial License (http://creativecommons.org/licenses/by-nc/3.0/) which permits unrestricted non-commercial use, distribution, and reproduction in any medium, provided the original work is properly cited.
So-Young Kwak et al. 499
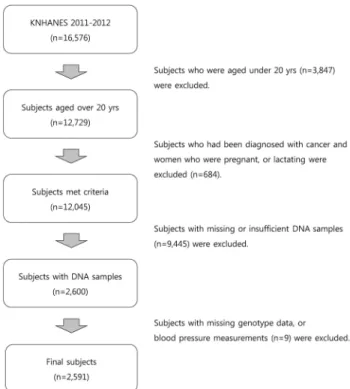
Fig. 1. Flow chart of the study participant selection
several studies have suggested that serum 25(OH)D levels are a marker, rather than a cause, of disease outcome [8,9].
The mendelian randomization (MR) approach was proposed to strengthen the causal inferences using genetic variants associated with an exposure phenotype as instrumental variables (IVs) [10-12]. This approach is based on Mendel’s laws of segregation and independent assortment; this law states that genetic variants are randomly allocated during meiosis and these genetic variants are unlikely to be influenced by factors that bias observational studies. Therefore, the effect estimates from MR analyses are unlikely to be confounded. Reverse causation is also unlikely, because the outcome (i.e., HTN) does not determine which 25(OH)D-associated single nucleotide polymorphisms (SNPs) is inherited.
A recent large European MR study concluded that higher serum 25(OH)D levels predicted using a 25(OH)D synthesis score (DHCR7 rs12785878 and CYP2R1 rs12794714,) are associated with lower BP value and a lower risk of HTN [13]. In another study on a European population, a similar pattern of association was found with genetic variants in regions related to 25(OH)D metabolism (CYP24A1) [14]. However, the role of vitamin D in cardiovascular health, including BP and HTN, in Korean popula- tion is unclear because most studies have focused on European population. Further, to our knowledge, no study has investigated the relationship between serum vitamin D levels and BP using the MR approach in the Korean population.
Here, we investigated the association of serum vitamin D levels with the HTN risk in 2,591 Korean subjects using the MR approach. We used five SNPs (DHCR7 rs12785878 Chr.11:
71456403; CYP2R1 rs10741657 Chr.11:14893332; CYP2R1 rs1279 4714 Chr.11:14892029; CYP24A1 rs6013897 Chr.20:54125940;
and GC rs2282679 Chr.4:71742666,) that were identified a priori from previous genome-wide association studies (GWASs) [15, 16] and MR studies of vitamin D [17-20], as IVs for 25(OH)D levels because they had the potential to satisfy the assumptions of MR and these variants reportedly account for a large proportion of the difference in serum 25(OH)D levels [15,21,22].
These SNPs are related to the genes known to affect synthesis (DHCR7: endogenous production; CYP2R1: liver conversion) and metabolism (CYP24A1: degradation of vitamin D, GC: transpor- tation of vitamin D to target cells) of 25(OH)D. Previous MR studies have used these SNPs as IVs to verify the causal effects of vitamin D on the risk of multiple diseases including type 2 diabetes [17], multiple sclerosis [18], and ovarian cancer [19]
in European and Chinese populations.
SUBJECTS AND METHODS Study participants
We used data from the Korea National Health and Nutrition Examination Survey (KNHANES) 2011-2012, a nationally repre- sentative cross-sectional survey conducted by the Korea Centers for Disease Control and Prevention. A stratified multistage probability sampling design was used to obtain a nationally representative sample of Korean subjects based on the geographical area, sex, and age from a household registry. The KNHANES comprises the following three different sections:
health examination, health interview, and nutrition survey.
Detailed information on the KNHANES is available elsewhere [23]. Among the 16,576 participants (8,518 participants in 2011 and 8,058 participants in 2012), those aged < 20 years were excluded. We also excluded participants who had been diagnosed with cancer and women who were pregnant or lactating. After further excluding participants with missing or insufficient DNA samples (n = 9,445), 2,600 eligible participants were available for genotyping. Of these, nine with had missing values in their genotype data or BP measurements were excluded. Finally, 2,591 participants (490 participants in 2011 and 2,101 partici- pants in 2012) were included in the analyses (Fig. 1). The study protocol was approved by the institutional review board of the Korea University (KU-IRB-16-EX-272-A-1).
Basic characteristics
Sociodemographic data and lifestyle information were obtained using a health interview questionnaire, that included questions regarding sex, age, education level, smoking status, current drinking status, physical activity, and use of antihy- pertensive medication. The education level was categorized as follows: completed elementary school, middle school, high school, or university education. The smoking status was classified into the following four groups: never-smoked, former smoker, smokes sometimes, and smokes every day. The drinking experience was classified as “no experience of drinking (no)”
or “experience of drinking (yes).” To obtain information on physical activity, the participants were asked to report the time spent on walking, moderate activity, and vigorous activity.
Physical activity was defined as participation in any of the following activities: walking for 30 min per day for at least 5 days/week, moderate activity for 30 min per day for at least 5 days/week, or vigorous activity for 20 min per day for at least
3 days/week. Use of antihypertensive medication was defined as taking antihypertensive medication at least once a month.
Anthropometric information was obtained from the results of a health examination. Height and weight of the participants were measured by trained medical personnel as per standardized protocols. Body mass index (BMI) was calculated by dividing the weight in kilograms by the square of the height in meters (kg/m2). To measure biochemical markers, blood samples were collected after an 8-h fast. Serum triglyceride (TG; mg/dL), total cholesterol (TC; mg/dL), high-density lipoprotein cholesterol (HDL-C; mg/dL), fasting blood glucose (FBG; mg/dL), aspartate aminotransferase (AST; IU/L), and alanine aminotransferase (ALT;
IU/L) levels were measured using enzymatic methods and a Hitachi automatic analyzer 7600 (Tokyo, Japan). Low-density lipoprotein cholesterol (LDL-C) levels were calculated according to the following equation: LDL-C (mg/dL) = TC (mg/dL) - HDL-C (mg/dL) - {[TG (mg/dL)/5] (TG < 400)} [24]. Glycosylated hemoglobin (HbA1c; %) was measured using high-performance liquid chromatography (HLC-723G7; Tosch, Tokyo, Japan).
Measurement of serum 25(OH)D levels
Blood samples were collected after an 8-h fast and immediately processed, refrigerated, and transported to the central testing institute (NeoDIN Medical Institute, Seoul, Korea). Serum 25(OH)D levels were measured within 24 h using radioimmunoassay (RIA) using a 1470 WIZARD gamma-counter (PerkinElmer, Turku, Finland) and a 25-Hydroxyvitamin D 125I RIA Kit (DiaSorin, MN, USA). In the present study, serum 25(OH)D levels were considered sufficient if they were ≥ 30 ng/mL, insufficient if they were between 20 ng/mL and 30 ng/mL, deficient if they were between 10 ng/mL and 20 ng/mL, and severely deficient if they were < 10 ng/mL [25]. Participants were divided into the following four groups based on their serum 25(OH)D levels:
severe deficiency, deficiency, insufficiency, and sufficiency of serum 25(OH)D levels.
BP and hypertension
Measurement of BP was performed by a trained technician using a mercury sphygmomanometer (Baumanometer, NY, USA). The BP was measured three times on the right arm, and the average values of the second and third readings were recorded as the systolic BP (SBP) and diastolic BP (DBP) measure- ments. Those with a self-reported history of physician-diagnosed HTN, BP >140/90 mmHg, or on antihypertensive medication were defined as having HTN.
Genetic variants
Five well-known serum 25(OH)D-related SNPs (DHCR7 rs1278 5878; CYP2R1 rs10741657 and rs10741657; CYP24A1 rs6013897;
and GC rs2282679) were selected from a previous GWAS [15]
and MR studies [4,13,17-20,26]. DNA samples were extracted from the blood samples at the time of blood collection. Three vials of DNA samples (20 ug per vial) in ethylenediamine- tetraacetic acid (EDTA) tube were stored in a deep freezer at -70°C. In 2017, about 6-7 years after the blood collection, we obtained 300 ng DNA samples from the National Biobank of Korea where the DNA samples were stored for genotyping [27].
Genotyping for rs12785878 (DHCR7), rs10741657 and rs12794714
(CYP2R1), and rs6013897 (CYP24A1) was performed using a SNP type assay (Fluidigm, San Francisco, CA, USA), as per the manufacturer’s instructions at DNALINK, INC (Seoul, Korea).
Genotyping of rs2282679 (GC) was further analyzed using the TaqMan assay method with a TaqMan fluorogenic 5′ nuclease assay (ABI, Foster City, CA, USA). Detailed methods of genotyping are described elsewhere [28,29].
Statistical analysis
All the statistical analyses were performed using Stata MP 13 (Stata Corp LP, TX, USA). Data are reported as mean ± standard error values for the continuous variables and as number of counts and percentages for the categorical variables. Differences in the characteristics were evaluated using one-way analysis of variance (ANOVA) for continuous variables and chi-squared test for categorical variables. The effect allele frequency was calculated according to the following formula: (counts of heterozygotes
+ 2 × homozygotes of effect allele)/(2 × total counts). The strength of the associations between serum 25(OH)D levels and IVs was tested using the F-statistic. We conducted both observational and MR analyses to examine the relationships of serum 25(OH)D with HTN and BP values. The observational analysis for the associations between serum 25(OH)D levels and HTN/BP was conducted using the ordinary least squares (OLS) estimation method (in logistic regression models and linear regression models, respectively), adjusted for sex, age, BMI, education level, smoking status, drinking experience, physical activity, and use of antihypertensive medication as confounders.
In the MR analysis, the effects of serum 25(OH)D levels on HTN/BP were estimated using an IV analysis with the two-stage least squares method. In the first stage, the association of individual genetic variants with serum 25(OH)D levels was tested in an additive model. The fitted serum 25(OH)D levels were then regressed on HTN/BP in the second stage. In the secondary analyses, we created a composite genetic risk score (GRS) (range 0-9) to assess the polygenic contribution of the loci associated with serum 25(OH)D by summing the number of 25(OH)D-increasing alleles across the five SNPs. Weighted GRS (wGRS) (range 0-9.5) was created by weighing each allele by its effect size reported in a previous GWAS [30]. We further created two separate function-based GRSs: synthesis score (range 0-6) using three SNPs relevant for synthesis of 25(OH)D (DHCR7 rs12785878, CYP2R1 rs10741657 and rs12794714;) and metabolic score (range 0-4) using two SNPs associated with transfer and clearance of 25(OH)D (CYP24A1 rs6013897, GC rs2282679). Results are presented as odds ratios (ORs) and 95%
confidence intervals (CIs) for HTN and β coefficient and 95%
CIs for BP.
RESULTS
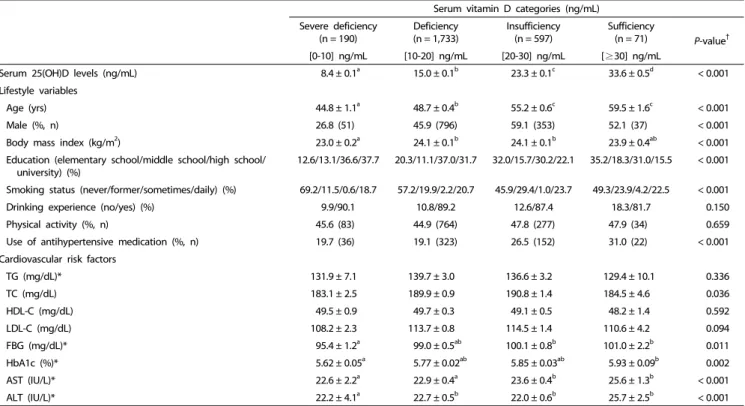
General characteristics according to the serum 25(OH)D levels Total 2,591 participants with both genetic and serum vitamin D data were included in our analyses. The basic characteristics of the study participants included are shown in Table 1. The prevalence of vitamin D sufficiency (serum 25(OH)D ≥ 30 ng/mL) was very low (n = 71; 2.7%). There were differences in the age, sex, BMI, education level, smoking status, and use of antihyper-
So-Young Kwak et al. 501
Serum vitamin D categories (ng/mL) Severe deficiency
(n = 190)
Deficiency (n = 1,733)
Insufficiency (n = 597)
Sufficiency
(n = 71) P-value†
[0-10] ng/mL [10-20] ng/mL [20-30] ng/mL [≥30] ng/mL
Serum 25(OH)D levels (ng/mL) 8.4 ± 0.1a 15.0 ± 0.1b 23.3 ± 0.1c 33.6 ± 0.5d < 0.001
Lifestyle variables
Age (yrs) 44.8 ± 1.1a 48.7 ± 0.4b 55.2 ± 0.6c 59.5 ± 1.6c < 0.001
Male (%, n) 26.8 (51) 45.9 (796) 59.1 (353) 52.1 (37) < 0.001
Body mass index (kg/m2) 23.0 ± 0.2a 24.1 ± 0.1b 24.1 ± 0.1b 23.9 ± 0.4ab < 0.001
Education (elementary school/middle school/high school/
university) (%) 12.6/13.1/36.6/37.7 20.3/11.1/37.0/31.7 32.0/15.7/30.2/22.1 35.2/18.3/31.0/15.5 < 0.001
Smoking status (never/former/sometimes/daily) (%) 69.2/11.5/0.6/18.7 57.2/19.9/2.2/20.7 45.9/29.4/1.0/23.7 49.3/23.9/4.2/22.5 < 0.001
Drinking experience (no/yes) (%) 9.9/90.1 10.8/89.2 12.6/87.4 18.3/81.7 0.150
Physical activity (%, n) 45.6 (83) 44.9 (764) 47.8 (277) 47.9 (34) 0.659
Use of antihypertensive medication (%, n) 19.7 (36) 19.1 (323) 26.5 (152) 31.0 (22) < 0.001
Cardiovascular risk factors
TG (mg/dL)* 131.9 ± 7.1 139.7 ± 3.0 136.6 ± 3.2 129.4 ± 10.1 0.336
TC (mg/dL) 183.1 ± 2.5 189.9 ± 0.9 190.8 ± 1.4 184.5 ± 4.6 0.036
HDL-C (mg/dL) 49.5 ± 0.9 49.7 ± 0.3 49.1 ± 0.5 48.2 ± 1.4 0.592
LDL-C (mg/dL) 108.2 ± 2.3 113.7 ± 0.8 114.5 ± 1.4 110.6 ± 4.2 0.094
FBG (mg/dL)* 95.4 ± 1.2a 99.0 ± 0.5ab 100.1 ± 0.8b 101.0 ± 2.2b 0.011
HbA1c (%)* 5.62 ± 0.05a 5.77 ± 0.02ab 5.85 ± 0.03ab 5.93 ± 0.09b 0.002
AST (IU/L)* 22.6 ± 2.2a 22.9 ± 0.4a 23.6 ± 0.4b 25.6 ± 1.3b < 0.001
ALT (IU/L)* 22.2 ± 4.1a 22.7 ± 0.5b 22.0 ± 0.6b 25.7 ± 2.5b < 0.001
Values are expressed as means ± standard errors for continuous variables and number of counts and percentages for categorical variables.
†Statistical differences among the vitamin D groups were determined using one-way ANOVA with Bonferroni’s multiple comparison for continuous variables and chi-squared test for categorical variables.
* Tested after log-transformation.
TG, triglycerides; TC, total cholesterol; HDL-C, high-density lipoprotein cholesterol; LDL-C, low-density lipoprotein cholesterol; FBG, fasting blood glucose; Hb1Ac, glycosylated hemoglobin A1c; AST, aspartate aminotransferase; ALT, alanine aminotransferase.
Table 1. Characteristics of the study participants as per the serum vitamin D level categories
tensive medication among the groups stratified as per the serum 25(OH)D levels. However, there were no differences in their drinking experience and physical activity levels. Analyses of the biochemical risk markers showed that TC, FBG, HbA1c, AST, and ALT levels were different among the serum 25(OH)D groups. However, these differences were attenuated after adjustment for sex and age (data not shown).
General characteristics as per the genotype of serum vitamin D-related SNPs
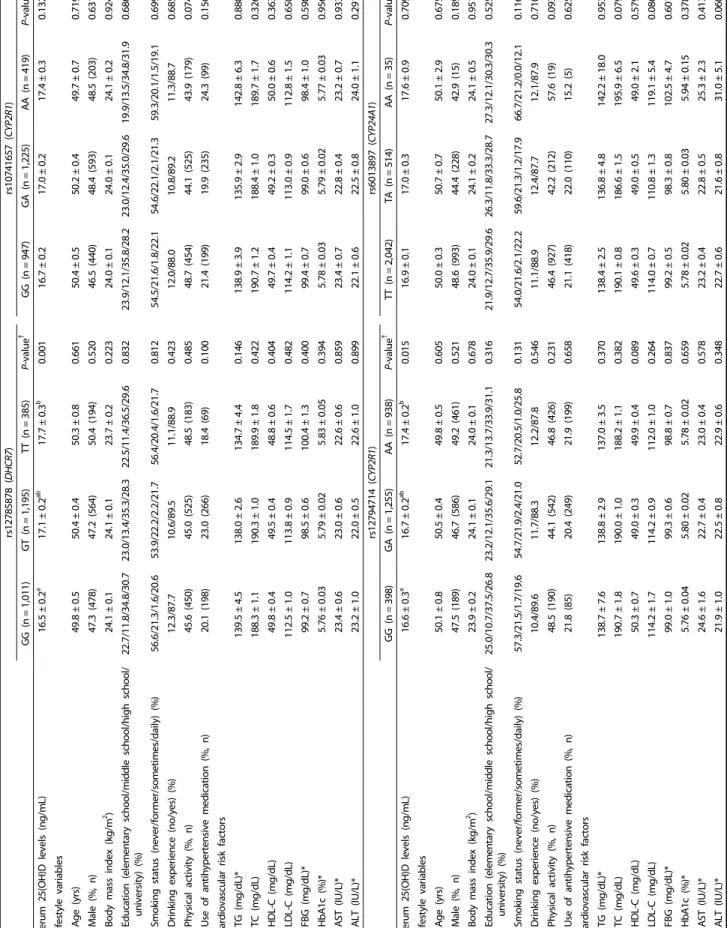
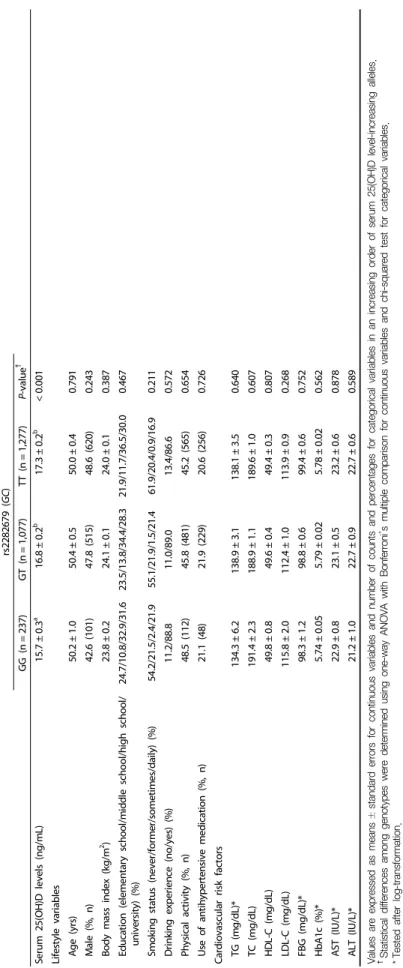
Genotypes are randomly assigned at conception; therefore, IVs are unlikely to be related to the potential confounders. To confirm the lack of association between the IVs and the potential confounders (one of the assumptions for IV), we compared the distributions of the participant characteristics by genotypes (Table 2). For each SNP, the potential confounders such as age, sex, BMI, education level, smoking status, drinking experience, physical activity, use of antihypertensive medication, and biochemical risk markers did not differ by genotypes.
Association between the vitamin D-related SNPs and serum 25(OH)D levels
Table 3 summarizes the genetic information of the five vitamin D-related SNPs. Serum 25(OH)D-increasing alleles were termed effect alleles, and their frequencies are presented. For all five SNPs, 25(OH)D-increasing alleles were positively associated
with serum 25(OH)D levels, as shown by β coefficients. Of these, the associations were strongest for rs2282679 (per allele: β =
0.639 ng/mL, F-statistics = 14.31, P < 0.001) and rs12785878 (per allele: β = 0.579 ng/mL, F-statistics = 13.34, P < 0.001). Other three SNPs (rs10741657, rs12794714, rs6013897) had F-statistics
< 10, demonstrating the possibility of weak instrument bias.
Association of the serum 25(OH)D levels with HTN and elevated BP: Observational and MR estimates
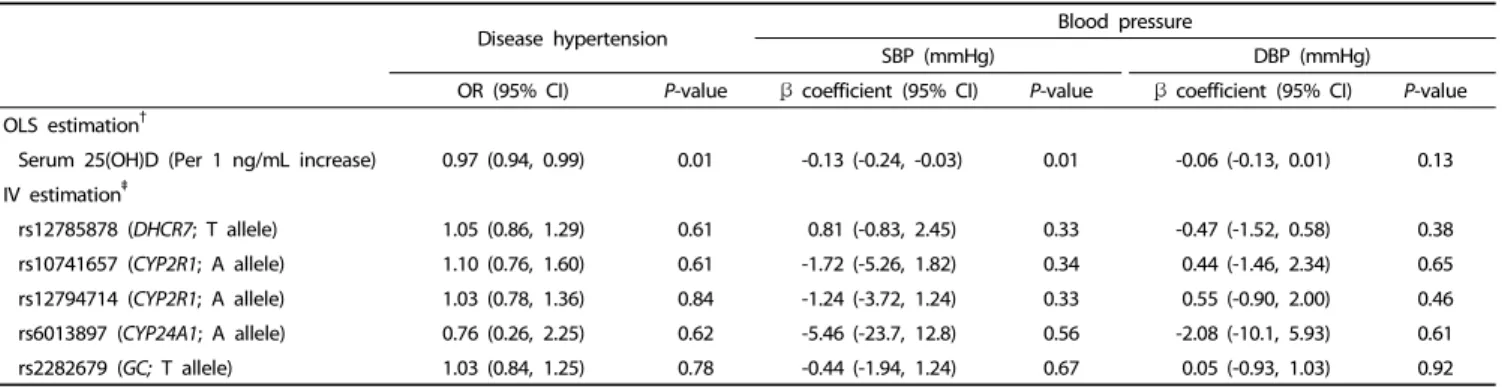
The association between circulating 25(OH)D levels and HTN is presented in Table 4. In the observational analysis, serum 25(OH)D levels were associated with a decreased prevalence of HTN (per 1 ng/mL increase: OR: 0.97, 95% CI: 0.94, 0.99) in the OLS models. SBP was inversely associated with serum 25(OH)D levels (β: -0.13 mmHg, 95% CI: -0.24, -0.03); however, DBP did not show such an association. The MR analysis showed no strong pattern of association between the serum 25(OH)D levels and HTN using individual SNPs as IVs. Although the CIs were wide, genetically determined serum 25(OH)D levels tended to be inversely associated with SBP but not with DBP.
For rs6013897 (CYP24A1), the association tended to be inverse with both HTN (OR: 0.76, 95% CI: 0.26, 2.25) and BP (β: -5.46 mmHg, 95% CI: -23.7 to 12.8 for SBP; β: -2.08 mmHg, 95% CI:
-10.1 to 5.93 for DBP). Similar results were observed for the GRSs (Supplementary Table 1 and 2).
rs12785878 (DHCR7)rs10741657 (CYP2R1) GG (n=1,011)GT (n=1,195)TT (n=385)P-value†GG (n=947)GA (n=1,225)AA (n=419)P-value† Serum 25(OH)D levels (ng/mL)16.5±0.2a17.1±0.2ab17.7±0.3b0.00116.7±0.217.0±0.217.4±0.30.132 Lifestyle variables Age (yrs)49.8±0.550.4±0.450.3±0.80.66150.4±0.550.2±0.449.7±0.70.719 Male (%, n)47.3(478)47.2(564)50.4(194)0.52046.5(440)48.4(593)48.5(203)0.631 Body mass index (kg/m2)24.1±0.124.1±0.123.7±0.20.22324.0±0.124.0±0.124.1±0.20.924 Education (elementary school/middle school/high school/ university) (%)22.7/11.8/34.8/30.723.0/13.4/35.3/28.322.5/11.4/36.5/29.60.83223.9/12.1/35.8/28.223.0/12.4/35.0/29.619.9/13.5/34.8/31.90.686 Smoking status (never/former/sometimes/daily) (%)56.6/21.3/1.6/20.653.9/22.2/2.2/21.756.4/20.4/1.6/21.70.81254.5/21.6/1.8/22.154.6/22.1/2.1/21.359.3/20.1/1.5/19.10.699 Drinking experience (no/yes) (%)12.3/87.710.6/89.511.1/88.90.42312.0/88.010.8/89.211.3/88.70.685 Physical activity (%, n)45.6(450)45.0(525)48.5(183)0.48548.7(454)44.1(525)43.9(179)0.074 Use of antihypertensive medication (%, n)20.1(198)23.0(266)18.4(69)0.10021.4(199)19.9(235)24.3(99)0.156 Cardiovascular risk factors TG (mg/dL)*139.5±4.5138.0±2.6134.7±4.40.146138.9±3.9135.9±2.9142.8±6.30.880 TC (mg/dL)188.3±1.1190.3±1.0189.9±1.80.422190.7±1.2188.4±1.0189.7±1.70.326 HDL-C (mg/dL)49.8±0.449.5±0.448.8±0.60.40449.7±0.449.2±0.350.0±0.60.363 LDL-C (mg/dL)112.5±1.0113.8±0.9114.5±1.70.482114.2±1.1113.0±0.9112.8±1.50.650 FBG (mg/dL)*99.2±0.798.5±0.6100.4±1.30.40099.4±0.799.0±0.698.4±1.00.598 HbA1c (%)*5.76±0.035.79±0.025.83±0.050.3945.78±0.035.79±0.025.77±0.030.956 AST (IU/L)*23.4±0.623.0±0.622.6±0.60.85923.4±0.722.8±0.423.2±0.70.933 ALT (IU/L)*23.2±1.022.0±0.522.6±1.00.89922.1±0.622.5±0.824.0±1.10.291 rs12794714 (CYP2R1)rs6013897 (CYP24A1) GG (n=398)GA (n=1,255)AA (n=938)P-value† TT (n=2,042)TA (n=514)AA (n=35)P-value† Serum 25(OH)D levels (ng/mL)16.6±0.3a16.7±0.2ab17.4±0.2b0.01516.9±0.117.0±0.317.6±0.90.709 Lifestyle variables Age (yrs)50.1±0.850.5±0.449.8±0.50.60550.0±0.350.7±0.750.1±2.90.675 Male (%, n)47.5(189)46.7(586)49.2(461)0.52148.6(993)44.4(228)42.9(15)0.189 Body mass index (kg/m2)23.9±0.224.1±0.124.0±0.10.67824.0±0.124.1±0.224.1±0.50.951 Education (elementary school/middle school/high school/ university) (%)25.0/10.7/37.5/26.823.2/12.1/35.6/29.121.3/13.7/33.9/31.10.31621.9/12.7/35.9/29.626.3/11.8/33.3/28.727.3/12.1/30.3/30.30.525 Smoking status (never/former/sometimes/daily) (%)57.3/21.5/1.7/19.654.7/21.9/2.4/21.052.7/20.5/1.0/25.80.13154.0/21.6/2.1/22.259.6/21.3/1.2/17.966.7/21.2/0.0/12.10.116 Drinking experience (no/yes) (%)10.4/89.611.7/88.312.2/87.80.54611.1/88.912.4/87.712.1/87.90.710 Physical activity (%, n)48.5(190)44.1(542)46.8(426)0.23146.4(927)42.2(212)57.6(19)0.093 Use of antihypertensive medication (%, n)21.8(85)20.4(249)21.9(199)0.65821.1(418)22.0(110)15.2(5)0.625 Cardiovascular risk factors TG (mg/dL)*138.7±7.6138.8±2.9137.0±3.50.370138.4±2.5136.8±4.8142.2±18.00.953 TC (mg/dL)190.7±1.8190.0±1.0188.2±1.10.382190.1±0.8186.6±1.5195.9±6.50.079 HDL-C (mg/dL)50.3±0.749.0±0.349.9±0.40.08949.6±0.349.0±0.549.0±2.10.579 LDL-C (mg/dL)114.2±1.7114.2±0.9112.0±1.00.264114.0±0.7110.8±1.3119.1±5.40.086 FBG (mg/dL)*99.0±1.099.3±0.698.8±0.70.83799.2±0.598.3±0.8102.5±4.70.601 HbA1c (%)*5.76±0.045.80±0.025.78±0.020.6595.78±0.025.80±0.035.94±0.150.378 AST (IU/L)*24.6±1.622.7±0.423.0±0.40.57823.2±0.422.8±0.525.3±2.30.413 ALT (IU/L)*21.9±1.022.5±0.822.9±0.60.34822.7±0.621.6±0.831.0±5.10.060
Table 2. Characteristics of the study participants according to the genotype
So-Young Kwak et al· 503
rs2282679 (GC) GG (n=237)GT (n=1,077)TT (n=1,277)P-value† Serum 25(OH)D levels (ng/mL)15.7±0.3a16.8±0.2b17.3±0.2b<0.001 Lifestyle variables Age (yrs)50.2±1.050.4±0.550.0±0.40.791 Male (%, n)42.6(101)47.8(515)48.6(620)0.243 Body mass index (kg/m2)23.8±0.224.1±0.124.0±0.10.387 Education (elementary school/middle school/high school/ university) (%)24.7/10.8/32.9/31.623.5/13.8/34.4/28.321.9/11.7/36.5/30.00.467 Smoking status (never/former/sometimes/daily) (%)54.2/21.5/2.4/21.955.1/21.9/1.5/21.461.9/20.4/0.9/16.90.211 Drinking experience (no/yes) (%)11.2/88.811.0/89.013.4/86.60.572 Physical activity (%, n)48.5(112)45.8(481)45.2(565)0.654 Use of antihypertensive medication (%, n)21.1(48)21.9(229)20.6(256)0.726 Cardiovascular risk factors TG (mg/dL)*134.3±6.2138.9±3.1138.1±3.50.640 TC (mg/dL)191.4±2.3188.9±1.1189.6±1.00.607 HDL-C (mg/dL)49.8±0.849.6±0.449.4±0.30.807 LDL-C (mg/dL)115.8±2.0112.4±1.0113.9±0.90.268 FBG (mg/dL)*98.3±1.298.8±0.699.4±0.60.752 HbA1c (%)*5.74±0.055.79±0.025.78±0.020.562 AST (IU/L)*22.9±0.823.1±0.523.2±0.60.878 ALT (IU/L)*21.2±1.022.7±0.922.7±0.60.589 Values are expressed as means±standard errors for continuous variables and number of counts and percentages for categorical variables in an increasing order of serum 25(OH)D level-increasing alleles. † Statistical differences among genotypes were determined using one-way ANOVA with Bonferroni’s multiple comparison for continuous variables and chi-squared test for categorical variables. *Tested after log-transformation. TG, triglycerides; TC, total cholesterol; HDL-C, high-density lipoprotein cholesterol; LDL-C, low-density lipoprotein cholesterol; FBG, fasting blood glucose; Hb1Ac, glycosylated hemoglobin A1c; AST, aspartate aminotransferase; ALT, alanine aminotransferase.
Table 2. continued