© 2017 The Korean Ophthalmological Society
This is an Open Access article distributed under the terms of the Creative Commons Attribution Non-Commercial License (http://creativecommons.org/licenses /by-nc/3.0/) which permits unrestricted non-commercial use, distribution, and reproduction in any medium, provided the original work is properly cited.
Original Article
The surgical methods and equipment for vitrectomy sur- gery have been significantly improved since its introduc- tion by Machemer et al. [1]. In its early days, vitrectomy was selectively performed in cases of retinal detachment with large retinal tear or proliferative vitreoretinopathy.
However, with the introduction of the sutureless vitrecto-
my system and wide-field retinal imaging technology, its incidence has increased, and indication of the surgery has widened [2,3]. Recently, the clinical efficacy and safety were reported for the 27-gauge vitrectomy system, as well as 23- and 25-gauge vitrectomy. Moreover, postoperative complication and patient discomfort have decreased, while the incidence of vitrectomy has increased [4,5]. Previous studies reported trends in vitreo-retinal surgery in England from 1968 to 2004 [6], and rates of vitrectomy among en- rollees in a managed care network from 2001 to 2012 [7].
However, vitrectomy rate and trends in South Korean pa- tients have not been previously reported. Thus, in this
Trends of Pars Plana Vitrectomy Rates in South Korea:
A Nationwide Cohort Study
Joo Yeon Kim
1,2, Tyler Hyungtaek Rim
1,2, Sung Soo Kim
11
Department of Ophthalmology, Institute of Vision Research, Severance Hospital, Yonsei University College of Medicine, Seoul, Korea
2
Department of Ophthalmology, National Health Insurance Service Ilsan Hospital, Goyang, Korea
Purpose: To assess the trends in pars plana vitrectomy surgery rates and factors affecting rate change be- tween 2002 and 2013 in South Korea.
Methods: Data from National Health Insurance Service-National Sample Cohort 2002–2013, which represents 1,025,340 samples with a sampling rate of 2.2% from the total eligible Korean population, was analyzed.
Results: A total of 3,816 vitrectomy procedures were performed (male, 2,010; female, 1,806) from 2002 to 2013.
Annual rates of vitrectomy increased from 15.1 (in 2002) to 49.4 (in 2013) per 100,000 individuals, and this trend was prominent in those aged 60 years or older. As for the anesthetic method, vitrectomy under local an- esthesia increased more prominently than vitrectomy under general anesthesia. The most common diagnoses associated with vitrectomy were diabetic retinopathy, retinal detachment, epiretinal membrane, and macular hole.
Conclusions: The average annual rate of vitrectomy surgery was 31.5 per 100,000 between 2002 and 2013, and the rate has steadily increased.
Key Words: Incidence, National Sample Cohort, Pars plana vitrectomy, Republic of Korea
Received: June 4, 2016 Accepted: November 21, 2016
Corresponding Author: Tyler Hyungtaek Rim, MD, MBA. Department of Ophthalmology, Severance Hospital, Yonsei University College of Medicine, #50 Yonsei-ro, Seodaemun-gu, Seoul 03722, Korea. Tel: 82-2- 2228-3570, Fax: 82-2-312-0541, E-mail: awaitingyourfeedback@gmail.
com
study, we evaluated the vitrectomy rate and its changes in the South Korean population.
Materials and Methods
Statement of ethics
This study adhered to the tenets of the Declaration of Helsinki and was waived for the requirement of written informed consent. The design of this study was approved by the institutional review board of the National Health In- surance Service Ilsan Hospital, Goyang, Korea.
Database
The Korean National Health Insurance Service (KNHIS) enrolls more than 97% of the entire Korean population. We used the data of National Health Insurance Service-Na- tional Sample Cohort (NHIS-NSC) 2002–2013, which is provided by KNHIS [8]. A representative 1,025,340 sam- ples were randomly selected using 1,476 strata, comprising 2.2% of the total eligible Korean population in 2002. Dur- ing the follow-up period, in order to make the sample size similar across the years and to compensate for the annual decrease of cohort size due to eligibility disqualifications from KNHIS (death, immigration, etc.), the dynamic co- hort was refreshed annually by adding newborns, who were sampled using the 2.2% sampling rate [8]. This data- base provides detailed information from 2002 to 2013 on procedures and prescription drugs, as well as diagnostic codes and personal information.
Pars plana vitrectomy and other variables
In KNHIS, all types of medical information are ex- changed via Korean electronic data interchange (KEDI) code between all medical facilities including government, any medical providers, and public health centers. We de- fined pars plana vitrectomy (PPV) based on the KEDI code of S5121. Age groups were divided by 10-year intervals, and participant residence was divided into 16 Si or Do ar- eas. We identified the major disease code (Korean Classifi- cation of Diseases [KCD], Hxx.xx) for PPV based on the same claim. Until KCD version 5 (~2010), the disease code
included one decimal place (i.e., Hxx.x), and it was impos- sible to identify an exact cause of PPV. From KCD version 6 (2011~), the KCD code provided more detailed disease code, including two decimal places (i.e., Hxx.xx); there- fore, we estimated major disease cause for PPV from 2011.
We also identified the use of general anesthesia for PPV- based claims on the same day, which is associated with general anesthesia including endotracheal procedures.
Statistical analysis
Annual participants were defined as all participants with NHIS qualification on January 1 of each year. The inci- dence of PPV was calculated using the total number of PPV and annual participants and was calculated with 95%
confidence interval based on a Poisson distribution. The overall incidence density was also calculated. We provided the number of PPV patients by subgroup of gender, year, age group, residence area, and medical provider location.
Major causative diseases for PPV were inferred from 2011 using KCD version 6, which offers a more detailed code for retinal disease than the previous version of KCD. The Stata/MP, ver. 14.0 (StataCorp., College Station, TX, USA) was used.
Results
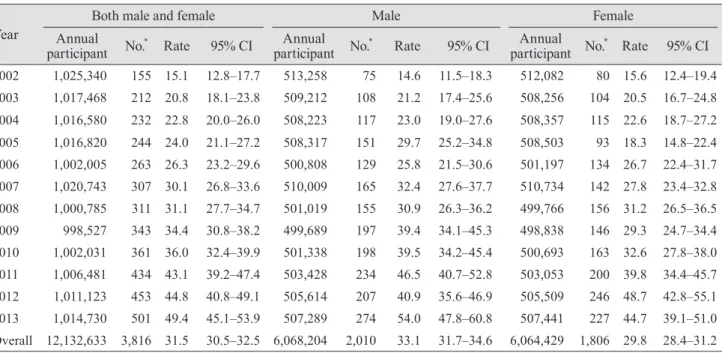
Table 1 shows the number of participants, number of performed PPV procedures, and annual rate of PPV per 100,000 individuals in both male and female, male, and fe- male groups from 2002 to 2013. The sample size remained approximately 100,000 (998,527 in 2009–1,025,340 in 2002), and a total of 3,816 cases of vitrectomy were per- formed between 2002 and 2013. There was a steady in- crease in vitrectomy cadence from 2002 to 2013 (115 cases in 2002 and 501 cases in 2013). The rate of vitrectomy per 100,000 individuals was 31.5 cases during the decade, and there was a more than three-fold increase in the overall vitrectomy rate from 2002 (15.1 vitrectomies per 100,000 people) to 2013 (49.4 vitrectomies per 100,000 people). Fig.
1 clearly shows the increase in annual vitrectomy rate.
When stratified according to sex, a total of 2,010 vitrecto-
mies in males and 1,806 vitrectomies in females were per-
formed during 12 years, and the vitrectomy rate was
slightly higher in males (33.1 per 100,000 individuals) than in females (28.4 per 100,000 individuals).
Table 2 shows the annual incidence of vitrectomy ac- cording to age. A total of eight vitrectomies were per- formed in the group aged 9 years or less. The incidence seems to increase with older age. Over the 12-year period, a total of 1,165 cases of vitrectomy were performed in indi- viduals in their 60s, represent the highest frequency among the age groups, and the incidence was lower (815) in those aged 70 years or older. However, individuals aged 70 years or older showed the greatest increase in vitrectomy inci- dence over the 12-year period (from 16 cases in 2002 to 142 cases in 2013).
Table 3 shows the presumed diagnostic causes for vitrec- tomy, based on the principal diagnosis registered at the time of vitrectomy. The diagnosis was provided with a four-digit number from 2011, and there were a total of 1,388 cases until 2013. However, in approximately one- third of the vitrectomy cases (385), the exact diagnostic cause was unclear, because the registered diagnosis was not clearly stated, including “unspecified” or “other”. The most common diagnosis was diabetic retinopathy (441 cas- es). The other diagnoses were retinal detachment, epireti- nal membrane, macular hole, and lens (intraocular or crys- talline) in descending order of frequency.
Fig. 2 shows the annual incidence of vitrectomy by anes- thetic method. There was a noticeable increase in local vit- rectomy versus vitrectomy performed under general anes- thesia.
Discussion
This analysis of data from the NHIS-NSC shows a more than three-fold steady increase in vitrectomies over the 12 years, from 15.1 (2002) to 31.5 (2013) episodes per 100,000 people. An average of 31.5 cases were performed annually during the same period.
No previous research about a similar topic has been per- formed in South Korea, and there were only two studies abroad. According to the study that was performed in En- gland from 1968 to 2004, which analyzed the trends in vit- reo-retinal surgery including scleral buckling vitrectomy, the annual rate of vitrectomy was fewer than one episode per 100,000 individuals in 1968 [6]. The operation rates persisted at this level for 20 years until 1987, and then rose sharply to approximately 26 (Hospital Episode Statistics) or 27 (Oxford Record Linkage Study) by 2004. In our study, the operation rate in 2004 was 22.8 per 100,000 peo- ple, showing similar results and its trend of rising inci-
Table 1. Annual rates of pars plana vitrectomy per 100,000 people during 2002–2013 in South Korea
Year Both male and female Male Female
Annual
participant No.
*Rate 95% CI Annual
participant No.
*Rate 95% CI Annual
participant No.
*Rate 95% CI 2002 1,025,340 155 15.1 12.8–17.7 513,258 75 14.6 11.5–18.3 512,082 80 15.6 12.4–19.4 2003 1,017,468 212 20.8 18.1–23.8 509,212 108 21.2 17.4–25.6 508,256 104 20.5 16.7–24.8 2004 1,016,580 232 22.8 20.0–26.0 508,223 117 23.0 19.0–27.6 508,357 115 22.6 18.7–27.2 2005 1,016,820 244 24.0 21.1–27.2 508,317 151 29.7 25.2–34.8 508,503 93 18.3 14.8–22.4 2006 1,002,005 263 26.3 23.2–29.6 500,808 129 25.8 21.5–30.6 501,197 134 26.7 22.4–31.7 2007 1,020,743 307 30.1 26.8–33.6 510,009 165 32.4 27.6–37.7 510,734 142 27.8 23.4–32.8 2008 1,000,785 311 31.1 27.7–34.7 501,019 155 30.9 26.3–36.2 499,766 156 31.2 26.5–36.5 2009 998,527 343 34.4 30.8–38.2 499,689 197 39.4 34.1–45.3 498,838 146 29.3 24.7–34.4 2010 1,002,031 361 36.0 32.4–39.9 501,338 198 39.5 34.2–45.4 500,693 163 32.6 27.8–38.0 2011 1,006,481 434 43.1 39.2–47.4 503,428 234 46.5 40.7–52.8 503,053 200 39.8 34.4–45.7 2012 1,011,123 453 44.8 40.8–49.1 505,614 207 40.9 35.6–46.9 505,509 246 48.7 42.8–55.1 2013 1,014,730 501 49.4 45.1–53.9 507,289 274 54.0 47.8–60.8 507,441 227 44.7 39.1–51.0 Overall 12,132,633 3,816 31.5 30.5–32.5 6,068,204 2,010 33.1 31.7–34.6 6,064,429 1,806 29.8 28.4–31.2 CI = confidence interval.
*