A comparative study for the development of a health promotion policy through an analysis of the mortality
rates in Korea and Japan, 1983~2003
EUN WOO NAM, YEA-LI-A SONG, MASAKI MORIYAMA
*, AKIKO ISHIHARA
**Healthy City Research Center, Institute of Health and Welfare, Yonsei University, Wonju, Republic of Korea
* Department of Public Health, College of Medicine, Fukuoka University, Japan
** Department of Health Policy Science, National Institute of Public Health, Japan
CONTENTS
Ⅰ. Introduction
Ⅱ. Methods
Ⅲ. Results
Ⅳ. Discussion References Abstract
Corresponding Author: Eun Woo Nam
Healthy City Research Center, Institute of Health and Welfare, Yonsei University 234-1 Maeji Heung-op Wonju-city Gangwon Republic of Korea
Tel: 033-760-2413, E-mail: [email protected]
Ⅰ. Introduction
Community health specialists use a lot of methods to find out the community’s state of health. Some methods are focused on the information of health state. There are two kinds of variables that must be considered when estimating health state. One is the variables of a specific sense, and the other is the variables of a general sense. The variables of a specific sense are diseases and death. The variables of diseases and death
can be used to assess the community’s state of health (Naidoo, 2000).
Death statistics is an essential indicator, used to calculate the life expectancy of a country’s citizens. Therefore, death statistics are widely used to compare health among countries. The reasons to analyze death statistics are, to get priorities of health programs (Murray, 1996), to conduct health planning, and to use related resources efficiently. According to a study done in Europe, the mortality rates, for each specific
Journal of Korean Society for Health Education and Promotion Vol. 24, No. 5, 2007, pp.39-54
cause of death, differ among nations (Kunst, 1636). This is because people have different degrees of exposure to risk factors, different health practices, and different accessibility to health services. Jeong and Go (Jeong, 2004) analyzed the effects of health on the economy. In 2001 they estimated the costs of neoplasms, cerebrovascular diseases, heart diseases, diabetes mellitus, and diseases of liver. Result estimated that neoplasms cost about 5,595.4 billion won, the highest socioeconomic cost, followed by diseases of liver 1,940.7 billion won, and cerebrovascular diseases 1,775 billion won.
To do these analyses, validity and reliability of data, and collected death statistics for a long time, are necessary. There were a lot of studies conducted using this mortality data. Some comparison studies (Lee, 1992, Dewen, 2004) of the elderly in Japan and China has reported that mortality of the elderly in China was higher than those in Japan, because in China people have insufficient facilities and medical personnel.
In the world a burden of lifestyle related diseases, an incidence of noncommunicable diseases, has been increasing, especially in developing countries. In fact, heart diseases and cerebrovascular diseases have become the leading causes of mortality (Word Health Organization, 2004). In Japan life expectancy has increased rapidly from 1950 onwards. In 2004 life expectancy of females was 85 years,
and males 74 years, the oldest in the world.
Due to the increase of life expectancy, increase of prevalence rate and the deteriorating health of the elderly become new health problems (Inoue, 1997). Also, in Korea life expectancy has increased from 63.2 in 1970 to 75.9 in 2000. Out of several studies of mortality types, a study (Coale, 1980) has clarified the mortality statistics of Korea.
However, there were few studies comparing mortality between Korea and Japan.
It would be highly beneficial to analyze the mortality rates of Korea and Japan together. Also, this study would be beneficial in achieving the Goal of National Health Promotion (Korea Institute for Health and Social Affairs, 2000), and reflected in the strategies for Health Promotion.
This study attempts to review the trends and types of the mortality rates in Korea and Japan by comparing data of the death statistics in those two countries, and discuss the directions of Korean health promotion policy.
Ⅱ. Methods
Materials
Data of the death statistics and estimated
population figures published by Korea
National Statistical Office, and the vital
statistics published by Ministry of Health
and Welfare of Japan were used to do a
Year
Nation 1983‐1994 1995‐2002 2003
Korea
II Korean Classification of Diseases according to
IX International Classification of Diseases
III Korean Classification of Diseases according to
X International Classification of Diseases
IV Korean Classification of Diseases according to
the revision of X International Classification of Diseases Japan IX International Classification
of Diseases
X International Classification of Diseases
Table 1. Classification of diseases in Korea and Japan
comparative study, the comparability of data is necessary, so in this study classification of diseases in Korea and Japan is aligned. In Korea deaths are classified by the Korean Classification of diseases according to International Classification of diseases. To improve the international comparability of data, KCD was made according to ICD (Korea National Statistical Office, 2005).
Korea National Statistical Office has reported statistical data to the related international organizations by KCD. In Japan deaths are classified by International Classification of diseases. In this study, data of the death statistics of Korea and Japan over the 21-year period from 1983 to 2003 are analyzed (Table 1).
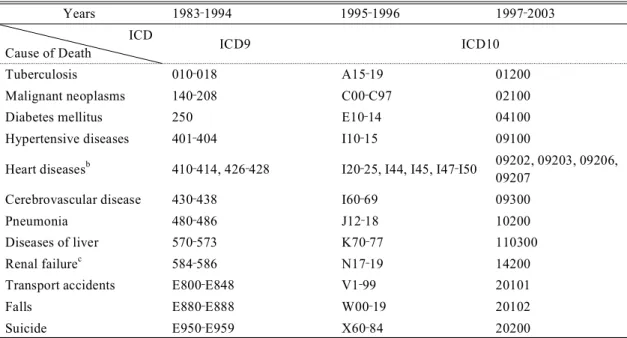
Studied causes of death
To determine which causes of death have to be studied, the top ten causes of death in Korea and Japan, 1983 and 2003 are reviewed. Chronic lower respiratory diseases
and diseases of esophagus, stomach, and duodenum which are difficult to classify and collect mortality data consistently, and senility which is not a disease, were excluded. And some overlapped causes of death are included in more comprehensive causes of death.
As a result, causespecific mortality rates from twelve selected causes are considered:
tuberculosis, malignant neoplasms, diabetes mellitus, hypertensive diseases, heart diseases, cerebrovascular disease, pneumonia, diseases of liver, renal failure, transport accidents, falls, and suicide (Table 2).
D ata analysis
Mortality data are standardized ×100,000 to the 2003 Japan population which is bigger than the Korean population, according to the direct method. All data are averaged in three year sub-periods in order to reduce variations in annual mortality rates.
To find out what the critical death rates
Years 1983‐1994 1995‐1996 1997‐2003 ICD
Cause of Death ICD9 ICD10
Tuberculosis 010‐018 A15‐19 01200
Malignant neoplasms 140‐208 C00‐C97 02100
Diabetes mellitus 250 E10‐14 04100
Hypertensive diseases 401‐404 I10‐15 09100
Heart diseasesb 410‐414, 426‐428 I20‐25, I44, I45, I47‐I50 09202, 09203, 09206, 09207
Cerebrovascular disease 430‐438 I60‐69 09300
Pneumonia 480‐486 J12‐18 10200
Diseases of liver 570‐573 K70‐77 110300
Renal failurec 584‐586 N17‐19 14200
Transport accidents E800‐E848 V1‐99 20101
Falls E880‐E888 W00‐19 20102
Suicide E950‐E959 X60‐84 20200
aThis table shows only the codes of classification of diseases in Japan, because the program of death statistics of Korea shows only the name of causes of death without the codes.
bOf all heart diseases, ischaemic heart diseases, conduction disorders and cardiac dysrhythmias, and heart failure were studied because of data limitations.
cOf all renal diseases, renal failure was studied because of data limitations.
Table 2. Studied Causes of Death by ICD
awould be if the populations did have the same age composition, multiply the age-sex specific death rates by the number of people in each age group of a standard population, and divide the total number of expected deaths by the total standard population.
To compare more clearly trends of mortality in Korea and Japan, standardized mortality rates from 1983/1985 to 2001/2003 were divided by 1983/1985 standardized mortality rates. Therefore for 1983/1985 the adjusted mortality rate is 1, and from 1986/1988 to 20001/2003 adjusted
mortality rates have relative values.
Ⅲ. Results
Trends of major cause specific mortality rates in Korea and Japan
Trends of major cause specific mortality rates in Korea
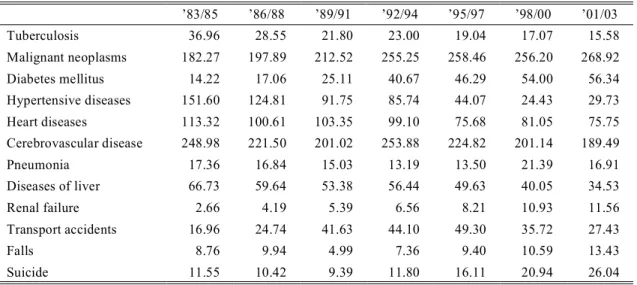
In Korea, in 1983/1985 the standardized
mortality rate for cerebrovascular diseases
was the highest, next malignant neoplasms
182.27, and hypertensive diseases 151.60.
’83/85 ’86/88 ’89/91 ’92/94 ’95/97 ’98/00 ’01/03
Tuberculosis 36.96 28.55 21.80 23.00 19.04 17.07 15.58
Malignant neoplasms 182.27 197.89 212.52 255.25 258.46 256.20 268.92
Diabetes mellitus 14.22 17.06 25.11 40.67 46.29 54.00 56.34
Hypertensive diseases 151.60 124.81 91.75 85.74 44.07 24.43 29.73
Heart diseases 113.32 100.61 103.35 99.10 75.68 81.05 75.75
Cerebrovascular disease 248.98 221.50 201.02 253.88 224.82 201.14 189.49
Pneumonia 17.36 16.84 15.03 13.19 13.50 21.39 16.91
Diseases of liver 66.73 59.64 53.38 56.44 49.63 40.05 34.53
Renal failure 2.66 4.19 5.39 6.56 8.21 10.93 11.56
Transport accidents 16.96 24.74 41.63 44.10 49.30 35.72 27.43
Falls 8.76 9.94 4.99 7.36 9.40 10.59 13.43
Suicide 11.55 10.42 9.39 11.80 16.11 20.94 26.04
Table 3. Mortality rates of major causes of death in Korea However, in 2001/2003, the standardized
mortality rate for death from malignant neoplasms 268.92 was the highest, next cerebrovascular diseases 189.49, and heart diseases 75.75. Therefore, the rankings changed, especially the ranking of diabetes mellitus was higher, and ranking of tuberculosis was lower (Table 3).
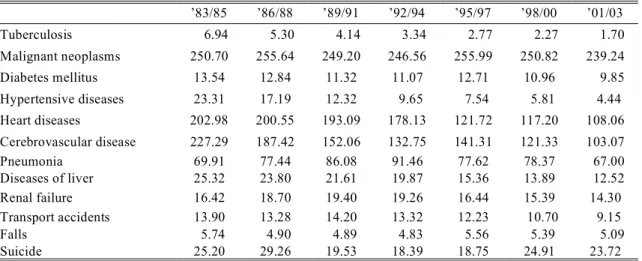
Trends of major cause specific mortality rates in Japan
In Japan, in 1983/1985, the standardized mortality rate for malignant neoplasms 250.70, was the highest, next cerebrovascular diseases 227.29, and heart diseases 202.98. However, in 2001/2003, the standardized mortality rate for malignant neplasms 239.24 was the highest, next heart diseases 108.06, and cerebrovascular
diseases 103.07. Therefore, the rankings changed, especially the ranking of hypertensive diseases was lower (Table 4).
Comparison of major cause specific mortality rates in Korea and Japan
In Korea the standardized mortality rate
for tuberculosis, 15.58, was more than nine
times the Japanese rate. The rate for diabetes
mellitus, 56.34, was more than five times,
and for hypertensive diseases, 29.73, more
than seven times that of Japan. Besides, in
Korea standardized mortality rates for
diseases of liver, transport accidents, and
falls were more than several times those in
Japan. While in Japan standardized mortality
rates for heart diseases and pneumonia were
higher than those in Korea.
’83/85 ’86/88 ’89/91 ’92/94 ’95/97 ’98/00 ’01/03
Tuberculosis 6.94 5.30 4.14 3.34 2.77 2.27 1.70
Malignant neoplasms 250.70 255.64 249.20 246.56 255.99 250.82 239.24
Diabetes mellitus 13.54 12.84 11.32 11.07 12.71 10.96 9.85
Hypertensive diseases 23.31 17.19 12.32 9.65 7.54 5.81 4.44
Heart diseases 202.98 200.55 193.09 178.13 121.72 117.20 108.06 Cerebrovascular disease 227.29 187.42 152.06 132.75 141.31 121.33 103.07
Pneumonia 69.91 77.44 86.08 91.46 77.62 78.37 67.00
Diseases of liver 25.32 23.80 21.61 19.87 15.36 13.89 12.52
Renal failure 16.42 18.70 19.40 19.26 16.44 15.39 14.30
Transport accidents 13.90 13.28 14.20 13.32 12.23 10.70 9.15
Falls 5.74 4.90 4.89 4.83 5.56 5.39 5.09
Suicide 25.20 29.26 19.53 18.39 18.75 24.91 23.72
Table 4. Mortality rates of major causes of death in Japan
Comparison of the trends of the mortality rates of major causes of death in Korea and Japan
Tuberculosis
Although in 1983/1985 the adjusted mortality rate for tuberculosis in Korea and Japan were both 1, in 2001/2003 these have decreased in Korea to 0.42, and in Japan to 0.25. The decrease of the adjusted mortality rate in Japan is more rapid than in Korea (Fig. 1).
Malignant Neoplasms
In Korea, in 2001/2003, the adjusted mortality rate has increased 1.48 times, while in Japan, it has decreased little, 0.95.
Diabetes Mellitus
In Korea, in 2001/2003, the adjusted mortality rate for diabetes mellitus has increased 3.96 times, while in Japan, it has
decreased little, 0.73.
Hypertensive Diseases
In Korea, in 2001/2003, the adjusted mortality rate for hypertensive diseases has decreased to 0.20, and also, in Japan it has decreased to 0.19.
Heart Diseases
In Korea, in 2001/2003, the adjusted mortality rate for heart diseases has decreased to 0.67, and also, in Japan it has decreased to 0.53.
Cerebrovascular Diseases
In Korea, in 2001/2003, the adjusted
mortality rate for deaths from cerebrovascular
diseases has decreased to 0.76, and in Japan
it has decreased to 0.45. The decrease in
Japan was more rapid than in Korea.
0.0 0.2 0.4 0.6 0.8 1.0 1.2 1.4 1.6
`83/85 `86/88 `89/91 `92/94 `95/97 `98/00 `01/03 Years
Malignant neoplasms
Adjusted mortality rates
Korea Japan
0.0 0.2 0.4 0.6 0.8 1.0 1.2
`83/85 `86/88 `89/91 `92/94 `95/97 `98/00 `01/03
Years Tuberculosis
Adjusted mortality rates
Korea Japan
0.0 0.5 1.0 1.5 2.0 2.5 3.0 3.5 4.0 4.5
`83/85 `86/88 `89/91 `92/94 `95/97 `98/00 `01/03
Years Diabetes mellitus
Adjusted mortality rates
Korea Japan
0.0 0.2 0.4 0.6 0.8 1.0 1.2
`83/85 `86/88 `89/91 `92/94 `95/97 `98/00 `01/03
Years Hypertensive diseases
Adjusted mortality rates
Korea Japan
0.0 0.2 0.4 0.6 0.8 1.0 1.2
`83/85 `86/88 `89/91 `92/94 `95/97 `98/00 `01/03
Years Heart diseases
Adjusted mortality rates
Korea Japan
0.0 0.2 0.4 0.6 0.8 1.0 1.2
`83/85 `86/88 `89/91 `92/94 `95/97 `98/00 `01/03
Years Cerebrovascular disease
Adjusted mortality rates
Korea Japan
0.0 0.2 0.4 0.6 0.8 1.0 1.2 1.4
`83/85 `86/88 `89/91 `92/94 `95/97 `98/00 `01/03 Years
Pneumonia
Adjusted mortality rates
Korea Japan
0.0 0.2 0.4 0.6 0.8 1.0 1.2
`83/85 `86/88 `89/91 `92/94 `95/97 `98/00 `01/03 Years
Diseases of liver
Adjusted mortality rates
Korea Japan
0.0 0.2 0.4 0.6 0.8 1.0 1.2 1.4 1.6 1.8
`83/85 `86/88 `89/91 `92/94 `95/97 `98/00 `01/03
Years Falls
Adjusted mortality rates
Korea Japan
0.0 0.5 1.0 1.5 2.0 2.5
`83/85 `86/88 `89/91 `92/94 `95/97 `98/00 `01/03
Years Suicide
Adjusted mortality rates
Korea Japan
0.0 0.5 1.0 1.5 2.0 2.5 3.0 3.5
`83/85 `86/88 `89/91 `92/94 `95/97 `98/00 `01/03
Years Transport Accidents
Adjusted mortality rates
Korea Japan
0.0 0.5 1.0 1.5 2.0 2.5 3.0 3.5 4.0 4.5 5.0
`83/85 `86/88 `89/91 `92/94 `95/97 `98/00 `01/03 Years
Renal failure
Adjusted mortality rates
Korea Japan
Fig. 1. The trends of the adjusted mortality rates of major causes of death in Korea and Japan.
Pneumonia
In Korea the adjusted mortality rate for pneumonia has decreased to 0.76 in 1992/1994, has increased 1.23 times in 1998/2000, and has decreased again to 0.97 in 2001/2003. While, in Japan it has increased 1.31 times in 1992/1994, and has decreased to 1.00 in 2001/2003.
Diseases of Liver
In Korea, in 2001/2003, the adjusted mortality rate for diseases of liver has decreased to 0.52, and in Japan it has decreased to 12.5.
Diseases of Kidney
In Korea, in 2001/2003, the adjusted mortality rate for diseases of kidney has increased 4.36 times, while, in Japan it has decreased little, 14.3.
Transport Accidents
In Korea, the adjusted mortality rate for
transport accidents has increased about 3
times, 2.91, in 1995/1997, and has decreased
to 1.62 in 2001/2003. While in Japan it has
decreased to 9.2 in 2001/2003.
Falls
In Korea, the adjusted mortality rate for falls has decreased to 0.81 in 1989/1991, and has increased 1.53 times in 2001/2003.
While in Japan it has decreased to 0.73 in 1992/1994, and has increased little, 0.94 in 2001/2003.
Suicide
In Korea, in 2001/2003, the adjusted mortality rate for suicide has increased 2.26 times, while in Japan it has decreased little, 0.94.
Ⅳ. Discussion
This study attempts to review the trends and types of the mortality rates in Korea and Japan by comparing data of the death statistics in those two countries, and discuss the directions of Korean health promotion policy for the future.
In this study, data of the death statistics of Korea and Japan over the 21-year period from 1983 to 2003 are analyzed. A previous study (Mack, 2002, Milan, 2003) shows that lifestyles are related with the risk of cancer.
And other studies (Nakanishi, 2004, Myers, 2003) reveal that lifestyle intervention reduced the risk of the metabolic syndrome.
In Korea, mortality rates from malignant neoplasms, diabetes mellitus, renal failure,
falls and suicide are increased, so a health policy and health services focused on these parts are needed.
In 2001/2003, the ranking of major causes of death in Korea and Japan has been greatly changed. In Japan, the mortality rates from pneumonia increase more than those from diabetes mellitus, while in Korea the proportion of mortality rates from diabetes mellitus is five times more than those in Japan. However, in Japan, the mortality rates from pneumonia are four times more than those in Korea, and in Korea, the mortality rates from transport accidents are higher than those in Japan. In Korea, the mortality rates from diabetes mellitus are higher than those in Japan, so a comprehensive preventive program and a disease management program are needed.
Improved health state affects positively on individuals’ wellbeing and on the economic development of a country, while diseases are a burden to the annual income of individuals and economic development.
In Korea the prevalence rate increased from
31.6% in 1992 to 34.5% in 1995, and to
40.4% in 2002 (Ministry of Health, Labor
and Welfare 2004). These show that there
are some necessities to find out disease
prevalence rate and to reinforce prevention
services. Life expectancy has increased by
twelve years from 63.2 in 1970 to 75.9 in
2000, and become over seventy-five years.
While disability adjusted life expectancy has remained at 65 years. Therefore, people have suffered from diseases and disabilities for a very long period of time (Korea Institute for Health and Social Affairs, 2000). Comparing disability adjusted life expectancy in Korea with those in OECD 29 countries. Korea is one of the lowest countries. While Japan has the longest disability adjusted life expectancy of 74.5 years among other countries, based on a method to calculate healthy life (WHO, 2005). Social health insurance introduced since 1922 in Japan, while since 1977 in Korea. Nationwide health insurance introduced from 1961 in Japan, while from 1989 in Korea (Kenporen, 2006).
According to increasing prevalence rate and fast aging, the socioeconomic cost of diseases will continue to increase. The National health expenditure of Korea increased to an annual average of 15.62%
from 1985 to 1988 and increased 7.4% from 1990 to 2000. This is more than the annual average increasing rate of GDP 13.96%
from 1985 to 1988 and 5.1% from 1990 to 2000 (Jeong, 2004). Smoking is one of the largest factors generating diseases and deaths. Harmful ingredients of tobacco generate malignant neoplasms (Boyle, 1995), and respiratory, circulatory, and cerebrovascular diseases, and increase risk of abortion and congenital malformation
(Yoon, 2001). According to a study done from 1995 to 2000, the number of deaths from drinking was annual average 21,123 persons, and that was 8.76% of the total number of deaths (Kim, 2004).
In Korea, in 2001/2003, the standardized mortality rate for diabetes mellitus was five times more than that of Japan. Therefore, diabetes mellitus has become a major health problem, and the systematic management of this is needed (Nam, 2002, Nam, 2004).
Strengthening education of diabetes mellitus and expansion of budget of diabetes mellitus management programs should be implemented.
While, in Japan the standardized mortality rate for pneumonia is four times more than that of Korea. It is related to climate, eating habits, and aging (Miyoshi, 2005). Also, in Korea the standardized mortality rate for transport accidents is higher than that of Japan, so to reduce this, the affirmative introduction of safe driving programs is necessary.
Recently mortality for suicide has increased in Korea. A study has shown that the economic development rate has a goodness-of-fit measure of 82.6% with suicide (Park, 2003). And another study (Rihmer, 1998) shows that most of victims kill themselves during a depressive stage.
Therefore, early treatment for this people
might be vital to prevent suicide. And
decreased unemployment rate, expanded
social capital, and new and improved mental
health programs, are urgently needed. Also, to manage falls and other accidents, the expansion of support for Healthy Cities and Safe Cities by local governments, and the creation of a social support environment are needed.
The evaluation of health status reflects the impact of medical care, and social and other factors (Donabedian, 1973). GDP per capita of Japan is 30,039 (Intl $, 2004), and that of Korea is 20,901 (Intl $, 2004) (http://www.who.int/countries, 2006). To decrease mortality from diseases related to lifestyle, in Korea, health promotion law was enacted in 1995, and health promotion programs have been put in place (Nam et al, 2007). Recently some local governments have been conducting Healthy City programs (Nam, 2007). Health promotion programs depending on the setting approach taken may have positive effects on decreasing lifestyle-related diseases.
Comparative study of health promotion policy between Korea and Japan is important. Because, health promotion agendas, such as establishing health promotion mission, setting health promotion goals, setting strategies of HP, evaluating goals of HP, and so on, are critical in both of Korea and Japan. Geographic proximities, proximities of cultures, tight cultural exchanges and historical contacts are backgrounds that both countries influence
each other regarding their development and adjustment of health promotion agendas.
If the status-quo of epidemiologic and nutritional transitions in both nations are very much different, direct comparisons of detailed death statistics are meaningless.
Because, under the different status of epidemiologic transition, profiles of death statistics are systematically different between nations, and trend of death statistics may change year after year according to the progress of transition in each country.
Epidemiologic transition in Japan is described by “the accelerated epidemiologic transition model” (Orman, 2005). In Omran’s paper, epidemiologic transition in Korea is not discussed. In Korea, nutritional transition proceeded and showed an accelerated shift in the 1970s (Kim, 2000).
Japan experienced a rapid shift in its dietary structure during its accelerated economic growth from 1950 to 1970.
In the 21-year period from 1983 to 2003
dealt in this paper, both of Korea and Japan
completed the major part of shift, and it is
reasonable to compare detailed death 3. In the
21 year period, much difference was observed
in the following three diseases; Diabetes-
Mellitus (DM), Renal-Failures (RF) and
Transport-Accidents (TA). In these diseases,
possible causes of such differences should be
discussed in more detail. Health Plan 2010
and Healthy Japan 21 reflect some different
goals based on these differences of recent death statistics, especially on three diseases:
DM, RF and TA.
Therefore, the Korean Government proposes to develop Health Plan 2020 (national health promotion policy 2020) referring from mortality rate trend analyzed from the study.
References
Boyle P, Maisonneuve P. Lung cancer and tobacco smoking. Lung Cancer.
1995;12:167-181.
Coale AJ, Cho LJ, Goldman N. Estimation of Recent Trends in Fertility and Mortality in the Republic of Korea.
National Academy of Science:
Washington DC; 1980.
Dewen W, Michiko K, TianShu Z, Qiaoyu J. Comparative study on the mortality pattern among elderly people in Japan and Fujian Province, China. Japan Journal of Health & Human Ecology.
2004;70:245-58.
Donabedian A. Aspects of medical care administration. Harvard University Press: Cambridge; 1973
http://www.who.int/countries (assessed 11 Aug. 2006)
Inoue T. Healthy life table in 1990 Japan.
Journal of Health and Human Ecology.
1997;7:226-30.
Jeong YH, Go SJ. Estimating socioeconomic costs of five major diseases. The Korean Journal of Public Finance.
2004;2:77-95.
Kenporen. Social security yearbook. 2006.
Kim KK, Cho NN. Trends of alcohol attributable mortality in Korea:
1995-2000. Korean Journal of Health Policy & Administration. 2004;14:40-1.
Kim SW, Moon SJ, and Popkin BM. The Nutrition Transition in South Korea.
Am J Clin Nut 200;71-44-53
Korea Institute for Health and Social Affairs.
Healthy Korea 2010: Objectives and Strategies. Seoul, Korea: Korea Institute for Health and Social Affairs;
2000.
Korea National Statistical Office. Cause of death statistics(Available at http://www.
nso.go.kr, assessed 1 February 2005).
Kunst AE, Groenhof F, Nackenbach JP.
Occupational class and cause specific mortality in the age men in ll European Countries: comparison of population based studies. B MJ. 1998;316:1636-42.
Lee JS, Hiroko F. Comparative study on death rate of in aged. Journal of Health and Human Ecology. 1992;58:336-43.
Mack WJ, Preston-Martin S, Bernstein L,
Qian D. Lifestyle and other risk factors
for thyroid cancer in Los Angeles
county females. Annals of EPidemiology.
2002;12:395-401.
Milán T, Verkasalo PK, Kaprio J, Koskenvuo M. Lifestyle differences in twin pairs discordant for basal cell carcinoma of the skin. British Journal of Dermatology. 2003;149:115-23.
Murray CJL, Lopez AD. Estimating causes of death: new methods and global and regional applications for 1990. In:
Murray CJL, Lopez AD, editors. The Global Burden of Disease. United States of America: The Havard School of Public Health on Behalf of the World Health Organization and the World Bank; 1996. pp.118-200.
Ministry of Health, labor and Welfare White Paper. Tokyo, Japan: Ministry of Health, Labor and Welfare; 2004.
Miyoshi S. Pneumonia death rate in Japan.
2005. Available at http://www.hone- kekko.org, assessed 7 May 2005.
Myers J, Atwood JE, Froelicher V. Active lifestyle and diabetes. Circulation. 2003;
107:2392-4.
Naidoo J, Willis J. Health Promotion Foundations for Practice. Harcourt Health Sciences: California; 2000.
Nakanishi S, Okubo M, Yoneda M, Jitsuiki K, Yamane K, Kohno N. A comparison between Japanese-Americans living in Hawaii and Los Angeles and native Japanese: the impact of lifestyle westernization on diabetes mellitus.
Biomedicine & Pharmacotherapy, 2004;
58:571-7.
Nam EW, Sakamaki H, Jo EJ, Cho HJ.
Health promotion policies for diabetes mellitus management in Korea. The Kosin Journal of Health Sciences.
2002;12:70-3.
Nam EW, Jo EJ, Nam JJ, Hasegawa T.
Comparative study on the health promotion policy in Korea and Japan.
Journal of Korean Society for Health Education and Promotion, 2004;21:
23-8.
Nam EW. Review and Prospective of the Health Cities in Korea. Korean Journal of Health Education and Promotion.
June 2007; 124-34
Nam EW, Engelhardt K. Health promotion capacity mapping: the Korean situation, Health Promotion International, Vol 22, Number 2 June 2007: 155-156
Orman A. The epidemiologic Transition: A theory of the Epidemiology of population change. The Milbank Quarterly, Vol 83, No 4 2005; 731-57 Park JS, Lee JY, Kim SD. A study for
effects of economic growth rate and unemployment rate to suicide rate in Korea. Korean Journal of Preventive Medicine. 2003;36:85-91.
Rihmer Z, Furedi J, Pestality P, Szabo
P. Decreasing suicide mortality in
Hungary: which are the main causes?
European psychiatry: the Journal of the Association of European Psychiatrists.
1998;13 suppl.4:279s
World Health Organization. The World Health Report. Geneva: World Health Organization; 2004.
WHO. The World Health Report. 2005.
Yoon SJ, Ha BM, Kang JW, Chang HC.
Estimation of attributable burden due to
premature death from smoking in
Korea. Korean Journal of Preventive
Medicine. 2001;34:191-9.
ABSTRACT
This study attempts to provide fundamental information for a health policy and health services by looking at the trends and types of the mortality rates in Korea and Japan.
In this study, data of the death statistics of Korea and Japan over the 21-year period from 1983 to 2003 are analyzed. Mortality data are standardized ×100,000 to the 2003 Japan population, according to the direct method.
In 2001/2003, the ranking of major causes of death in Korea and Japan has been greatly changed. In Korea, mortality rates from malignant neoplasms, diabetes mellitus, renal failure, falls and suicide have increased. In Japan, the mortality rates from pneumonia increase more than those from diabetes mellitus. In 2001/2003, the proportions of the mortality rates from chronic diseases are higher than those from acute diseases.
In the Korean health promotion policy "Health Promotion 2020", a more intensive goal management is needed.
Key Words: Mortality rate; health promotion policy, Korea, Japan
<국문초록>
한국과 일본의 사망률 비교 분석을 통한 건강증진정책 함의
본 연구는 1983년부터 2003년까지 21년간의 한국과 일본의 사망통계자료를 이용하여 두 나라간의 사망원인을 비교 분석하였다. 사망률은 일본의 2003년 인구를 표준인구로 한 직접법을 통해 표준화되었다.
분석 결과, 2001/2003년에 한국과 일본의 주요사인의 순위가 크게 바뀌어 가고 있음을 알 수 있었다 . 즉, 한국에서는 악성신생물, 당뇨, 신부전, 추락, 자살로 인한 사망률이 증가하였 고 , 일본에서는 당뇨보다는 폐렴으로 인한 사망률이 증가하고 있었다. 또한, 2001/2003년에는 만성질환으로 인한 사망률의 비율이 급성질환으로 인해 사망하는 경우가 많았다.
이상의 분석 결과, 한국의 건강증진사업은 악성신생물, 당뇨, 신부전, 추락사고, 그리고 자살의 예방과 관리에 대한 다양한 사업이 필요함을 알 수 있었다. 또한, 노인 인구가 많은 일본의 경우, 폐렴으로 인한 사망자가 증가하는 경향을 볼 때에, 한국의 경우도 노인의 경우 폐렴 관련 건강관리가 필요함을 시사하고 있다.
주제어: 사망률, 건강증진정책, 한국, 일본