당뇨황반부종에서 유리체강내 베바시주맙의 효과 예측을 위한 생체표지자로서의 단백뇨의 역할
Proteinuria as a Potential Biomarker for the Efficacy of Intravitreal Bevacizumab Injection in Patients with Diabetic Macular Edema
정유리1*, 김영호1*, 이병주1, 변혜은2, 이기황1
Yoo-Ri Chung1*, Young Ho Kim1*, Byung Joo Lee1, Hye-Eun Byeon2, Kihwang Lee1
1아주대학교 의과대학 안과학교실, 2아주대학교 의과대학 의과학연구소
1Department of Ophthalmology, Ajou University School of Medicine, Suwon, Korea
2Institute of Medical Science, Ajou University School of Medicine, Suwon, Korea
Purpose: Anti-vascular endothelial growth factor (anti-VEGF) agents are good therapeutic options for diabetic macular edema (DME), especially in patients with DME that is refractory or shows delayed response to anti-VEGF treatment. We investigated the change of pro- teinuria following intravitreal bevacizumab injection (IVB) as a potential biomarker for treatment-responsiveness in patients with DME.
Methods: This pilot study was performed as secondary analysis of patients with diabetic retinopathy (DR) from prospectively enrolled patients scheduled for IVB from May 2018 to December 2018. Fifty-three patients with DR (30 with DME and 23 without DME) were ini- tially included, and 46 eyes were finally included for analysis after propensity score matching. Urine tests were performed within 1 month before and 7 ± 1 days after IVB. The concentrations of urine protein and albumin were quantitatively measured, and the urinary albu- min-to-creatinine ratio (UACR) was calculated from data before and after IVB.
Results: There were no significant differences in mean concentrations of urine albumin and protein between patients with and without DME. More patients in the DME group showed abnormal level of albuminuria both before and after IVB, but these differences were not statistically significant between the groups. A correlation analysis revealed no significant association between change in UACR and that of central retinal thickness.
Conclusion: Change in proteinuria was not a proper biomarker of the response to IVB in patients with DME.
Keywords: Albuminuria; Bevacizumab; Diabetic macular edema; Proteinuria
Address reprint requests to Kihwang Lee, MD, PhD
Department of Ophthalmology, Ajou University School of Medicine, #164 World Cup-ro, Yeongtong-gu, Suwon 16499, Korea
Tel: 82-31-219-7814, Fax: 82-31-219-5259 E-mail: [email protected]
* These authors equally contributed to this work.
Received: 2019. 7. 29 Revised: 2019. 8. 22 Accepted: 2019. 8. 22
Introduction
Diabetic nephropathy (DN) and diabetic retinopathy (DR) are microvascular complications of diabetes that share a common pathogenesis. Previous studies have suggested a close association between DN and DR. They also share com- mon pathogenic processes, such as endothelial dysfunction, thickening of the basement membrane, and chronic low- grade inflammation, which result in retinal and renal vascu- lar damage [1,2]. Albuminuria and proteinuria are indepen- dent risk factors for cardiovascular morbidity or all-cause mortality regardless of diabetes [3,4], while they also appear to be associated with progression of DR [5-7]. A significant association has been reported between DN and DR [8,9], while DN did not markedly affect development of diabetic macular edema (DME) [10].
DME is one of the main causes of chronic visual impair- ment in patients with DR. The incidence of DME is asso- ciated with multiple systemic conditions, including poor glycemic control, elevated blood pressure, and dyslipidemia [11]. Vascular hyperpermeability from blood-retinal barrier (BRB) breakdown is a well-known pathogenesis of DME, followed by increased levels of vascular endothelial growth factor (VEGF) and ischemia [12]. Intravitreal injection of anti-VEGF agents has been widely used to treat DME, show- ing improvement of visual acuity in practice [13]. Intravit- real injection usually delivers a small amount of anti-VEGF agent into the vitreous body; this small amount can suppress plasma-free VEGF level and may have systemic effects in addition to local ocular effects [14].
A recent study identified a significant association between DN and DME [15], and there are also reports that impaired renal function is not associated with DME [16,17]. Urinary albumin-to-creatinine ratio (UACR) calculated from a ran- dom urine sample has been introduced as a marker with a good correlation to absolute urinary protein or albumin excretion collected over 24 hours [18,19]. The UACR can be measured in a random urine sample, which is easy to obtain in outpatient clinics, and is currently recommended for ini- tial evaluation of proteinuria [20].
While anti-VEGF agents are good therapeutic options for DME, there are some patients with DME that is refractory or shows delayed response to anti-VEGF treatment [21,22].
However, there is currently no definite systemic biomarker that can be obtained non-invasively to identify these non-re-
sponders. The presence of DR in diabetic patients suggests that microvascular complications have manifested clinically.
We hypothesized that change of proteinuria following intrav- itreal bevacizumab injection (IVB) might be different in pa- tients with DME versus those without DME, as DME is the hallmark of BRB breakdown [23]. If there is any association between proteinuria and DME, then the potential of protein- uria as a biomarker for response of DME to IVB needs to be evaluated. Accordingly, we investigated the effect of IVB on proteinuria using UACR in patients with DME, along with the association of central retinal thickness change and UACR.
Materials and Methods
This study was performed as secondary analysis of patients with DR from prospectively enrolled patients scheduled for IVB (Avastin®, Hoffmann-La Roche Ltd., Basel, Switzer- land) due to various retinal diseases from 1 May 2018 to 31 December 2018. This study was approved by the Institution- al Review Board of Ajou University Hospital, Suwon, Korea (IRB No. AJIRB-BMR-OBS-18-035) and complied with the Declaration of Helsinki. Written informed consent was ob- tained from all patients. Exclusion criteria were as follows:
1) age < 20 years; 2) history of vitrectomy; 3) prior intrav- itreal anti-VEGF injection within six months of the time of inclusion; 4) preexisting kidney disease or current dialysis, 5) withdrawn consent; and 6) loss to follow-up.
Medical history, clinical demographics, and information about current medications were obtained from the patients at the time of inclusion. Systolic and diastolic blood pressure values were also measured at each visit. Hemoglobin A1c (HbA1c) data from the past three months were collected, and grade of DR was assessed using fundus photographs and flu- orescein angiography findings. IVB was administered as 1.25 mg/0.05 mL by one of three participating retinal specialists (Y.R.C., Y.H.K., or K.L.). DME was identified on optical coherence tomography (OCT). A Heidelberg Spectralis OCT device (Heidelberg Engineering, Heidelberg, Germany) was used for all measurements. Central retinal thickness (CRT) was measured as the distance from the hyperreflective line of the internal limiting membrane to the hyperreflective line of the retinal pigment epithelium/Bruch’s membrane com- plex [24] and was obtained both before and after IVB. The
retinal response to IVB in patients with DME was examined with OCT after five or six weeks of IVB. Among those with DME, an IVB responder was defined as one showing CRT reduction > 25% from baseline; others were classified as non-responders [25].
Random urine samples were collected before and after 7
± 1 days of IVB, based on the report that bevacizumab in- jections show prominent suppression of plasma-free VEGF concentration at 1 week after injection [26]. Urine protein, albumin, and creatinine concentrations were measured, and UACR was calculated from these measurements using the following formula: UACR (mg/g) = urine albumin (mg/dL)/
creatinine (g/dL).
UACR was categorized into three groups as follows: A1 (< 30 mg/g), A2 (≥ 30 and ≤ 300 mg/g), and A3 (> 300 mg/
g), according to the Kidney Disease: Improving Global Out- comes (KDIGO) 2012 clinical practice guidelines [20]. As patients with a higher value at baseline tended to have small- er changes on subsequent measurements, and vice versa (i.e., regression to the mean), we used the categorical analyses from the study by Jun et al. [27].
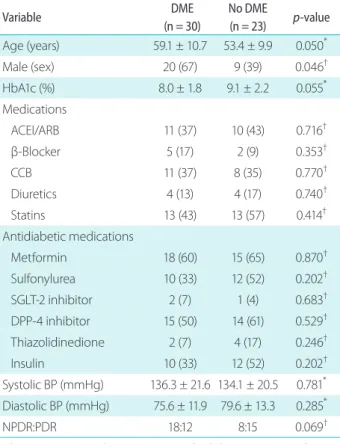
Table 1. Baseline characteristics of included patients with diabetes
Variable DME
(n = 30)
No DME
(n = 23) p-value Age (years) 59.1 ± 10.7 53.4 ± 9.9 0.050*
Male (sex) 20 (67) 9 (39) 0.046†
HbA1c (%) 8.0 ± 1.8 9.1 ± 2.2 0.055*
Medications
ACEI/ARB 11 (37) 10 (43) 0.716†
β-Blocker 5 (17) 2 (9) 0.353†
CCB 11 (37) 8 (35) 0.770†
Diuretics 4 (13) 4 (17) 0.740†
Statins 13 (43) 13 (57) 0.414†
Antidiabetic medications
Metformin 18 (60) 15 (65) 0.870†
Sulfonylurea 10 (33) 12 (52) 0.202†
SGLT-2 inhibitor 2 (7) 1 (4) 0.683†
DPP-4 inhibitor 15 (50) 14 (61) 0.529†
Thiazolidinedione 2 (7) 4 (17) 0.246†
Insulin 10 (33) 12 (52) 0.202†
Systolic BP (mmHg) 136.3 ± 21.6 134.1 ± 20.5 0.781* Diastolic BP (mmHg) 75.6 ± 11.9 79.6 ± 13.3 0.285*
NPDR:PDR 18:12 8:15 0.069†
Values are presented as mean ± standard deviation or number (%) unless otherwise indicated.
DME = diabetic macular edema; ACEI = angiotensin converting en- zyme inhibitor; ARB = angiotensin receptor blocker; β-blocker = β- adrenergic receptor-blocker; CCB = calcium channel blocker; SGLT-2
= sodium glucose cotransporter-2; DPP-4 = dipeptidyl peptidase-4;
BP = blood pressure; NPDR = non-proliferative diabetic retinopathy;
PDR = proliferative diabetic retinopathy.
*Mann-Whitney U test; †chi-square test.
Table 2. Urine analysis of proteinuria before and after IVB
Variable (mg/dL) DME
(n = 30)
No DME
(n = 23) p-value* Pre-IVB lab
Microalbumin 25.1 ± 51.1 20.9 ± 31.1 0.597
Protein 48.9 ± 87.4 35.3 ± 37.4 0.971
Creatinine 95.1 ± 75.1 81.9 ± 56.5 0.615 Post-IVB lab
Microalbumin 22.1 ± 38.8 21.1 ± 33.8 0.399
Protein 35.6 ± 47.9 30.4 ± 34.0 0.712
Creatinine 80.9 ± 53.2 70.5 ± 49.7 0.419 Values are presented as mean ± standard deviation unless other- wise indicated.
IVB = intravitreal bevacizumab injection; DME = diabetic macular edema.
*Mann-Whitney U test.
Table 3. Change in UACR both before and after IVB
Variable DME
(n = 30)
No DME
(n = 23) p-value Geometric
Pre-IVB 109.1
(56.3-211.3) 78.2 (35.5-172.3)
0.473*
Post-IVB 119.4
(65.4-217.7) 81.9 (34.9-192.4)
0.430*
p-value† 0.441 0.693
Abnormal albuminuria‡
Abnormal range at pre-IVB 21 (70) 15 (65) 0.712§ Abnormal range at post-IVB 22 (73) 15 (65) 0.524§ Values are presented as mean (95% confidence interval) or num- ber (%).
UACR = urinary albumin-to-creatinine ratio; DME = diabetic mac- ular edema; IVB = intravitreal bevacizumab injection.
*Mann-Whitney U test; †Wilcoxon signed rank test comparing pre-IVB and post-IVB data; ‡abnormal range of UACR (≥ 30 mg/g);
§chi-square test.
All statistical analyses were performed using the Statis- tical Package for the Social Sciences (SPSS) version 25.0
(IBM SPSS, IBM Corp., Armonk, NY, USA). Categorical
Table 4. Categorical distribution of UACR both before and after IVB
Variable (mg/dL) DME
(n = 30)
No DME
(n = 23) p-value*
Pre-IVB 0.844
A1 (< 30 mg/g, normal) 9 (30) 8 (35) A2 (≥ 30 and ≤ 300 mg/g) 11 (37) 9 (39) A3 (> 300 mg/g) 10 (33) 6 (26)
Post-IVB 0.796
A1 (< 30 mg/g, normal) 8 (27) 8 (35) A2 (≥ 30 and ≤ 300 mg/g) 14 (46) 9 (39)
A3 (> 300 mg/g) 8 (27) 6 (26)
Categorical change† 0.368
Improved change 4 (13) 1 (4)
No change in category 23 (77) 21 (82)
Aggravated change 3 (10) 1 (4)
Values are presented as number (%).
UACR = urinary albumin-to-creatinine ratio; IVB = intravitreal bev- acizumab injection; DME = diabetic macular edema.
*Chi-square test; †improved changes were from A3 to A1 or A2 and from A2 to A1, while aggravated changes were from A1 to A2 or A3 and from A2 to A3.
Table 5. Categorical change in UACR both before and after IVB (by regression to the mean)
Categorical change of UACR DME (n = 30)
No DME
(n = 23) p-value A1 Residual decrease 6 (20) 7 (30) 0.576* A1 Regression to the mean 3 (10) 1 (4)
A2 Residual decrease 4 (13) 3 (13) 0.930† A2 Regression to the mean 4 (13) 4 (17)
A2 Residual increase 3 (10) 2 (9)
A3 Regression to the mean 3 (10) 0 0.250* A3 Residual increase 7 (23) 6 (26)
p-value† 0.009 <0.001
Values are presented as number (%). Categorical change of UACR by baseline category is as follows: 1) for A1, residual decrease im- plied minor change or decrease of UACR ≥ 30%, and regression to the mean implies increase of UACR ≥ 30%; 2) for A2, residual de- crease indicated decrease of UACR ≥ 30%, regression to the mean implied a minor change, and residual increase implied increase of UACR ≥ 30%; and 3) for A3, regression to the mean suggested decrease of UACR ≥ 30%, and residual increase implied increase of UACR ≥ 30% or minor change.
UACR = urinary albumin-to-creatinine ratio; IVB = intravitreal bev- acizumab injection; DME = diabetic macular edema.
*Fisher’s exact test; †chi-square test.
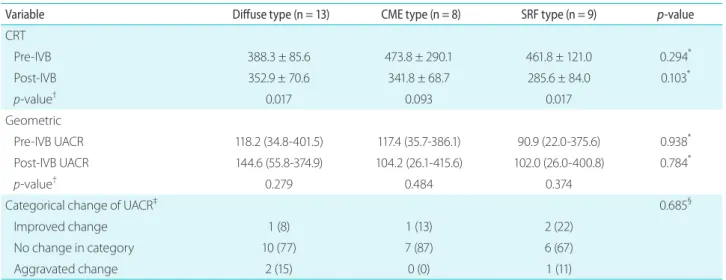
Table 6. Change following IVB according to OCT-based type of DME
Variable Diffuse type (n = 13) CME type (n = 8) SRF type (n = 9) p-value
CRT
Pre-IVB 388.3 ± 85.6 473.8 ± 290.1 461.8 ± 121.0 0.294*
Post-IVB 352.9 ± 70.6 341.8 ± 68.7 285.6 ± 84.0 0.103*
p-value† 0.017 0.093 0.017
Geometric
Pre-IVB UACR 118.2 (34.8-401.5) 117.4 (35.7-386.1) 90.9 (22.0-375.6) 0.938*
Post-IVB UACR 144.6 (55.8-374.9) 104.2 (26.1-415.6) 102.0 (26.0-400.8) 0.784*
p-value† 0.279 0.484 0.374
Categorical change of UACR‡ 0.685§
Improved change 1 (8) 1 (13) 2 (22)
No change in category 10 (77) 7 (87) 6 (67)
Aggravated change 2 (15) 0 (0) 1 (11)
Values are presented as mean ± standard deviation, mean (95% confidence interval) or number (%).
IVB = intravitreal bevacizumab injection; OCT = optical coherence tomography; DME = diabetic macular edema; CME = cystoid macular edema; SRF = subretinal fluid; CRT = central retinal thickness; UACR = urinary albumin-to-creatinine ratio.
*Kruskal-Wallis test; †Wilcoxon signed rank test comparing pre-IVB and post-IVB data; ‡improved changes were from A3 to A1 or A2 and from A2 to A1, while aggravated changes were from A1 to A2 or A3 and from A2 to A3; §chi-square test.
variables were compared using the chi-square test or Fisher’s exact test, and continuous variables were assessed using the Mann-Whitney U test or Kruskal-Wallis test. The Wilcoxon signed rank test was used to compare pre-IVB and post-IVB values. As UACR showed an extremely skewed distribu- tion, log10-transformed values were calculated and used for statistical analysis. For log10 transformed data expression, the values were back-transformed to geometric mean and presented as geometric mean with 95% confidence interval.
Pearson’s correlation analysis was used to analyze the asso- ciation of DME and proteinuria. A p-value less than 0.05 was considered statistically significant.
Results
Fifty-three patients with DR (30 with DME and 23 without DME) were included in the analysis. The baseline character- istics of the included patients with or without DME are sum- marized in Table 1. The mean age of these participants was 59.8 ± 14.3 years, and there were more male patients in the DME group. The HbA1c level was higher, and more DME patients showed advanced DR (i.e., proliferative DR [PDR]) compared to the DME group, although this difference was not statistically significant. There were no significant differ- ences among the other variables between groups.
In terms of proteinuria, there were no differences in mean
concentrations of urine albumin and urine protein between groups with and without DME and before and after IVB (Table 2). More patients in the DME group showed abnormal level of albuminuria both before and after IVB, although the differences between groups were not statistically significant.
The geometric mean of UACR both before and after IVB showed no differences between the groups, and the paired t-test revealed no difference between pre- and post-IVB UACR values within groups (Table 3). Among patients with DME, pre-IVB UACR was higher in IVB non-responders than IVB responders, but this difference was not statistically significant (128.9 mg/g vs. 68.3 mg/g, p = 0.104).
The changes in UACR according to categorical distri- bution are shown in Table 4. There was no difference in number of patients with newly developed albuminuria or in severity of albuminuria both before and after IVB. The categorical distribution from improvement to aggravation was not different between patients with or without DME, although the mean CRT in patients with DME was signifi- cantly reduced following IVB (446.7 ± 182.1 μm to 328.6 ± 79.0 μm, p < 0.001). The categorical distribution according to regression to the mean was not different between patients with and without DME (Table 5). However, this categorical distribution was statistically significant within either group, showing that patients with deteriorated baseline UACR were associated with greater residual increase following IVB (p <
0.05 in all groups).
Among the types of DME based on OCT-associated mor- phologic classification, DME eyes were classified as follows:
diffuse macular edema (n = 13), cystoid macular edema (n = 8), and DME with subretinal fluid (n = 9). There was no difference in UACR or CRT pre- or post-IVB or in categor- ical distribution among these subtypes of DME (Table 6). In correlation analysis performed in eyes with DME, there was no significant association between change in UACR and that of central retinal thickness (r = -0.116, p = 0.589, Fig. 1).
Discussion
DME, which is a clinically significant complication of DR, can occur at any stage of DR [28]. In recent years, the mainstay of treatment for DME has shifted from laser pho- tocoagulation to intravitreal anti-VEGF injections, as they are anatomically and functionally superior [28]. Among the Figure 1. Correlation between change in UACR and central retinal
thickness in patients with DME (r = -0.116, p = 0.589). UACR = urinary albumin-to-creatinine ratio; DME = diabetic macular edema.
800
600 400
200
0
-200
0.00000 2.00000 4.00000 6.00000
Change of UACR (mg/g)
Change of CRT (um)
various types of anti-VEGF agents available for intravitreal injections, systemic exposure was higher with bevacizum- ab compared to ranibizumab or aflibercept [29]. Pharma- cokinetic studies have confirmed systemic absorption of anti-VEGF agents after intravitreal injections, as well as an associated decrease in serum VEGF level [30]. Proteinuria is the second most common complication after hypertension following systemic administration of bevacizumab [31,32];
therefore, the systemic effects of IVB on proteinuria need to be evaluated.
DR and DN share a common pathogenesis, but there is discordance in the risk factors for progression [33]. Song et al. [33] reported that average glycemic level was associated with DR progression, whereas glycemic variability was as- sociated with DN. In contrast, another study reported asso- ciation of ratio of glycated albumin to HbA1c, an indicator reflecting fluctuations in plasma glucose, with DR but not with DN [34]. Although controversies remain, a relationship between DR and kidney function has been identified [35,36].
Comorbidity of DR and DN is common in diabetic patients;
the two entities have a similar pathogenesis, including endo- thelial dysfunction, thickened basement membrane, and/or chronic inflammation [37].
In this study of diabetic patients, there was no significant effect of IVB on proteinuria regardless of presence of DME in patients with DR. This tendency was consistent after pro- pensity score matching based on age, sex, glycemic control (i.e., HbA1c level), and DR severity (NPDR vs. PDR). This finding suggests a weak correlation between kidney func- tion and DME, unlike DR. This tendency was also noted by previous studies. Impaired renal function assessed using glomerular filtration rate was associated with increased prevalence of DR, severe DR, and severe visual impairment, while no significance was noted with DME [16,17]. Similar- ly, secondary analysis of a randomized clinical trial compar- ing different anti-VEGF agents reported no treatment group differences in UACR as a reflection of kidney function in patients with DME [38].
Furthermore, the finding of no definite association be- tween renal function and DME followed by IVB suggests that change in proteinuria may not be a proper biomarker for DME or its anatomic response to IVB. A recent prospec- tive study assessing serologic inflammatory factors as bio- markers for DME by enzyme-linked immunosorbent assay (ELISA) kits reported that serum high-sensitivity C-reactive
protein (hsCRP) and intercellular adhesion molecule 1 levels were associated with early response to IVB (mean number of IVB injections: 4.8 ± 0.6), while serum VEGF level was associated with 6-month CRT change [39]. The previously mentioned study suggested hsCRP and IACM1 as signifi- cant biomarkers for response to anti-VEGF treatment [39].
However, these measurements require blood sampling from patients as well as ELISA kits for evaluation, which may be invasive and is inconvenient for clinical practice. We tried to identify the clinical significance of UACR as a biomarker for DME due to its non-invasive and convenient method of collection from patients, but these results suggest that UACR was not a proper biomarker in DME. Although not statisti- cally significant, pre-IVB UACR was higher in those with DME, and these patients did not respond as well to IVB.
However, this result suggests the potential of UACR as a systemic biomarker in DME, which may need further inves- tigation with a larger number of patients.
Investigations on renal function and retinal thickness have been mostly limited to patients with end-stage renal disease who are on dialysis. Studies of change in OCT findings relat- ed to hemodialysis have reported decreased retinal thickness with improved DME without treatment [40], while others found no effect of hemodialysis in diabetic patients with or without DME [41]. In this study, we excluded patients under- going dialysis, as renal function cannot be correctly assessed in these patients; in addition, no correlation existed between renal function and central retinal thickness. Furthermore, IVB did not affect any change in albuminuria, from im- provement to aggravation, regardless of presence of DME.
However, a real tendency of worsening albuminuria (i.e., residual increase in UACR) was noted with higher baseline UACR with or without DME. This finding suggests a rela- tively higher risk of worsening albuminuria for those with preexisting renal dysfunction. Although generally safe in cases with absolute change in albuminuria, caution is needed in patients with impaired kidney function. Taken together, these findings suggest that IVB is safe in terms of protein- uria without affecting retinal thickness in diabetic patients, which is a possible complication following systemic release of bevacizumab.
The small number of included patients was the major lim- itation of this study despite its prospective design. This study investigated only the effect of a single IVB, while repeated treatments are often needed in clinical practice. Additional-
ly, UACR was calculated with a one-time random urine test performed in a clinical setting, so the urine samples for pre- and post-IVB might not have been collected during similar times of day. This method might therefore be less accurate than a 24-hour urine collection. To reduce this bias, we tried to perform urine tests in each patient at the same time of day by scheduling their clinic visits at similar times when possi- ble.
In conclusion, proteinuria was not affected by IVB regard- less of presence of DME in patients with DR. IVB can be safely used in patients with DR regardless of baseline renal function. However, UACR was not a proper biomarker for the effect of IVB in DME.
Financial support
This was supported by Basic Science Research Program through the a National Research Foundation of Ko- rea (NRF) funded by the Ministry of Education (NRF- 2017R1D1A1A02018439).
Acknowledgements
Involved in the design of study: Y.R.C., K.L.; data curation:
Y.H.K., Y.R.C., K.L.; data analysis: Y.H.K., Y.R.C., H.E.B.;
analysis: Y.H.K. B.J.L., H.E.B.; interpretation of data: Y.R.C., K.L.; preparation of manuscript: Y.H.K., Y.R.C.; and critical review of article: B.J.L., Y.R.C., K.L.
Conflicts of Interest
All authors have no potential conflicts of interest to disclose.
References
1. Manaviat MR, Afkhami M, Shoja MR. Retinopathy and microalbu- minuria in type II diabetic patients. BMC Ophthalmol 2004;4:9.
2. Cruickshanks KJ, Ritter LL, Klein R, Moss SE. The association of microalbuminuria with diabetic retinopathy. The Wisconsin Epidemiologic Study of Diabetic Retinopathy. Ophthalmology 1993;100:862-7.
3. Schmieder RE, Mann JF, Schumacher H, et al. Changes in albu- minuria predict mortality and morbidity in patients with vascu- lar disease. J Am Soc Nephrol 2011;22:1353-64.
4. Estacio RO, Dale RA, Schrier R, Krantz MJ. Relation of reduction in urinary albumin excretion to ten-year cardiovascular mortality in patients with type 2 diabetes and systemic hypertension. Am
J Cardiol 2012;109:1743-8.
5. Wong CW, Wong TY, Cheng CY, Sabanayagam C. Kidney and eye diseases: common risk factors, etiological mechanisms, and pathways. Kidney Int 2014;85:1290-302.
6. Girach A, Vignati L. Diabetic microvascular complications--can the presence of one predict the development of another? J Dia- betes Complications 2006;20:228-37.
7. Hsieh YT, Tsai MJ, Tu ST, Hsieh MC. Association of abnormal renal profiles and proliferative diabetic retinopathy and diabetic mac- ular edema in an Asian population with type 2 diabetes. JAMA Ophthalmol 2018;136:68-74.
8. Ahmed MH, Elwali ES, Awadalla H, Almobarak AO. The relation- ship between diabetic retinopathy and nephropathy in Suda- nese adult with diabetes: population based study. Diabetes Metab Syndr 2017;11 Suppl 1:S333-6.
9. Pearce I, Simó R, Lövestam‐Adrian M, et al. Association between diabetic eye disease and other complications of diabetes: Im- plications for care. A systematic review. Diabetes Obes Metab 2019;21:467-78.
10. Jeng CJ, Hsieh YT, Yang CM, et al. Diabetic retinopathy in pa- tients with diabetic nephropathy: development and progres- sion. PLoS One 2016;11:e0161897.
11. Romero-Aroca P. Managing diabetic macular edema: The lead- ing cause of diabetes blindness. World J Diabetes 2011;2:98-104.
12. Murakami T, Yoshimura N. Structural changes in individu- al retinal layers in diabetic macular edema. J Diabetes Res 2013;2013:920713.
13. Virgili G, Parravano M, Evans JR, et al. Anti-vascular endothelial growth factor for diabetic macular oedema: a network me- ta-analysis. Cochrane Database Syst Rev 2018;10:Cd007419.
14. Avery RL, Gordon GM. Systemic safety of prolonged monthly anti-vascular endothelial growth factor therapy for diabetic macular edema: a systematic review and meta-analysis. JAMA Ophthalmol 2016;134:21-9.
15. Acan D, Calan M, Er D, et al. The prevalence and systemic risk factors of diabetic macular edema: a cross-sectional study from Turkey. BMC Ophthalmol 2018;18:91.
16. Kaewput W, Thongprayoon C, Rangsin R, et al. Associations of renal function with diabetic retinopathy and visual impairment in type 2 diabetes: a multicenter nationwide cross-sectional study. World J Nephrol 2019;8:33-43.
17. Temkar S, Karuppaiah N, Takkar B, et al. Impact of estimated glo- merular filtration rate on diabetic macular edema. Int Ophthal- mol 2018;38:1043-50.
18. Price CP, Newall RG, Boyd JC. Use of protein:creatinine ratio mea-
surements on random urine samples for prediction of signifi- cant proteinuria: a systematic review. Clin Chem 2005;51:1577-86.
19. Kuritzky L, Toto R, Van Buren P. Identification and management of albuminuria in the primary care setting. J Clin Hypertens (Greenwich) 2011;13:438-49.
20. Inker LA, Astor BC, Fox CH, et al. KDOQI US commentary on the 2012 KDIGO clinical practice guideline for the evaluation and management of CKD. Am J Kidney Dis 2014;63:713-35.
21. Kwon JW, Jee D. Aqueous humor cytokine levels in patients with diabetic macular edema refractory to anti-VEGF treatment.
PLoS One 2018;13:e0203408.
22. Laiginhas R, Silva MI, Rosas V, et al. Aflibercept in diabetic mac- ular edema refractory to previous bevacizumab: outcomes and predictors of success. Graefes Arch Clin Exp Ophthalmol 2018;256:83-9.
23. Daruich A, Matet A, Moulin A, et al. Mechanisms of macular ede- ma: beyond the surface. Prog Retin Eye Res 2018;63:20-68.
24. Staurenghi G, Sadda S, Chakravarthy U, Spaide RF. Proposed lexicon for anatomic landmarks in normal posterior segment spectral-domain optical coherence tomography: the IN*OCT consensus. Ophthalmology 2014;121:1572-8.
25. Koyanagi Y, Yoshida S, Kobayashi Y, et al. Visual outcomes based on early response to anti-vascular endothelial growth factor treatment for diabetic macular edema. Ophthalmologica 2018;239:94-102.
26. Hirano T, Toriyama Y, Iesato Y, et al. Changes in plasma vascular endothelial growth factor level after intravitreal injection of bevacizumab, aflibercept, or ranibizumab for diabetoc macular edema. Retina 2018;38:1801-8.
27. Jun M, Ohkuma T, Zoungas S, et al. Changes in albuminuria and the risk of major clinical outcomes in diabetes: results from AD- VANCE-ON. Diabetes Care 2018;41:163-70.
28. Terasaki H, Ogura Y, Kitano S, et al. Management of diabetic macular edema in Japan: a review and expert opinion. Jpn J Ophthalmol 2018;62:1-23.
29. Avery RL, Castellarin AA, Steinle NC, et al. Systemic pharmacoki- netics and pharmacodynamics of intravitreal aflibercept, beva- cizumab, and ranibizumab. Retina 2017;37:1847-58.
30. Maloney MH, Schilz SR, Herrin J, et al. Risk of systemic adverse events associated with intravitreal anti-VEGF therapy for diabet- ic macular edema in routine clinical practice. Ophthalmology 2019;126:1007-15.
31. Wu S, Kim C, Baer L, Zhu X. Bevacizumab increases risk for severe proteinuria in cancer patients. J Am Soc Nephrol 2010;21:1381-9.
32. Zhao T, Wang X, Xu T, et al. Bevacizumab significantly increases the risks of hypertension and proteinuria in cancer patients: a systematic review and comprehensive meta-analysis. Oncotar- get 2017;8:51492-506.
33. Song KH, Jeong JS, Kim MK, et al. Discordance in risk factors for the progression of diabetic retinopathy and diabetic nephropa- thy in patients with type 2 diabetes mellitus. J Diabetes Investig 2019;10:745-52.
34. Umayahara Y, Fujita Y, Watanabe H, et al. Association of glycat- ed albumin to HbA1c ratio with diabetic retinopathy but not diabetic nephropathy in patients with type 2 diabetes. Clin Bio- chem 2017;50:270-3.
35. Lin HT, Zheng CM, Wu YC, et al. Diabetic retinopathy as a risk factor for chronic kidney disease progression: a multicenter case-control study in Taiwan. Nutrients 2019;11:509.
36. Zhang X, Kumari N, Low S, et al. The association of serum cre- atinine and estimated glomerular filtration rate variability with diabetic retinopathy in Asians with type 2 diabetes: a nested case-control study. Diab Vasc Dis Res 2018;15:548-58.
37. Kramer CK, Retnakaran R. Concordance of retinopathy and nephropathy over time in Type 1 diabetes: an analysis of data from the Diabetes Control and Complications Trial. Diabet Med 2013;30:1333-41.
38. Glassman AR, Liu D, Jampol LM, Sun JK. Changes in blood pres- sure and urine albumin-creatinine ratio in a randomized clinical trial comparing aflibercept, bevacizumab, and ranibizumab for diabetic macular edema. Invest Ophthalmol Vis Sci 2018;59:1199- 205.
39. Brito P, Costa J, Gomes N, et al. Serological inflammatory factors as biomarkers for anatomic response in diabetic macular edema treated with anti-VEGF. J Diabetes Complications 2018;32:643-9.
40. Hwang H, Chae JB, Kim JY, et al. Changes in optical coherence tomography findings in patients with chronic renal failure undergoing dialysis for the first time. Retina 2018 Aug 30. doi:
10.1097/IAE.0000000000002312.
41. Azem N, Spierer O, Shaked M, Neudorfer M. Effect of hemodi- alysis on retinal thickness in patients with diabetic retinopathy, with and without macular edema, using optical coherence to- mography. J Ophthalmol 2014;2014:709862.