http://e-nrp.org
The association between dietary pattern and depression in middle-aged Korean adults
Seon-Joo Park
1, Myung-Sunny Kim
2and Hae-Jeung Lee
1§1Department of Food and Nutrition, College of BioNano Technology, Gachon University, 1342 Seongnam-daero, Sujeong-gu, Seongnam-si, Gyeonggi 13120, Korea
2Research Division of Food Functionality, Korea Food Research Institute, Wanju 55365, Korea
BACKGROUND/OBJECTIVES: The association between dietary patterns and depression has been reported but the results have been inconsistent. This study was conducted to investigate the association between dietary patterns and depression in middle-aged Korean adults.
SUBJECTS/METHODS: The participants were selected from a community-based cohort, a subset of the Korean Genome and Epidemiology Study. Depression was assessed using the Korean version of the Beck Depression Inventory (BDI) and those with a BDI score ≥ 16 were defined as having depression. The subjects’ food intakes over the year preceding the survey were estimated by using a validated semi-quantitative food frequency questionnaire. Dietary patterns were identified by using factor analysis. Multiple logistic regression was used to assess the association of dietary pattern with depression.
RESULTS: Among 3,388 participants, 448 (13.2%) were identified as having depression. We identified two major dietary patterns:
‘Healthy’ dietary pattern was characterized by high intakes of vegetables, soybeans, mushroom, seaweeds, white fish, shellfish and fruits and a low intake of white rice. ‘Unhealthy’ dietary pattern was characterized by high intakes of white rice, meats, ramen, noodles, bread and coffee and a low intake of rice with other grains. Compared with subjects in the lowest quartiles, those in the highest quartiles of the healthy dietary pattern had a significantly lower odds ratio (OR = 0.59, 95% CI: 0.42-0.82, P for trend = 0.0037) after adjusting for potential confounders. In contrast, the unhealthy dietary pattern was negatively associated with depression (OR = 1.65, 95% CI: 1.19-2.28, P for trend = 0.0021).
CONCLUSION: This results suggest that a healthy dietary pattern (rich in vegetables, soybeans, mushroom, seaweeds, white fish, shellfish, and fruits) is associated with low risk of depression. Whereas an unhealthy dietary pattern (rich in white rice, meats, ramen, noodles, bread, and coffee) is associated with a high risk of depression in middle-aged Korean adults.
Nutrition Research and Practice 2019;13(4):316-322; https://doi.org/10.4162/nrp.2019.13.4.316; pISSN 1976-1457 eISSN 2005-6168
Keywords: Dietary pattern, depression, Factor analysis, Korean adults
INTRODUCTION
6)Depression is a psychiatric disorder and the burden of that disease is greater than any other single disease [1]. The World Health Organization has predicted that 300 million people have depressive symptoms [2]. In the 2014 Korea National Health and Nutrition Examination Survey, 6.7% of adults aged > 19 years had depression, as defined as a score on the Patient Health Questionnaire (PHQ)-9 of 10 or higher [3]. Depression is associated with a variety of social problems and is closely related to suicide, thus appropriate prevention strategies are needed [4].
To alleviate this health issue, studies have proposed that several nutrients, such as omega-3 fatty acid, folate, vitamin B
6, and vitamin B
12, may help prevent depressive symptoms [5-8].
However, since the effect of an individual nutrient on a disease is limited, a dietary pattern analysis method that evaluates the effect of the entire diet has been proposed [9,10]. In a review
paper, dietary patterns including the Mediterranean diet, the prudent diet pattern, and the pro-vegetarian diet pattern, were reported to reduce the risk of depression [11]. In an assessment of the individual dietary patterns and incidence of depression in middle-aged subjects, the Mediterranean diet was shown to be inversely associated with depression of middle-aged subjects in the PREDIMED randomized trial [12]. Also, the whole-food pattern (high intake of vegetables, fruits, and fish) was shown to be associated with decreased depression risk in middle-aged subjects [13]. On the other hand, dietary pattern and depression did not show any association in a large-scale cohort study of middle-aged US women [14]. To the best of our knowledge, there is only one study that conducted to examine the association between dietary pattern and depression in Korean adolescents [15]. Therefore, the objective of this study was to examine the association between dietary patterns and depression in Korean middle-aged adults.
This study was supported by Korea Food Research Institute (E0150302-05), Republic of Korea.
§Corresponding Author: Hae-Jeung Lee, Tel. 82-31-750-5968, Fax. 82-31-750-5974, Email. [email protected], [email protected] Received: May 30, 2019, Revised: June 13, 2019, Accepted: July 5, 2019
This is an Open Access article distributed under the terms of the Creative Commons Attribution Non-Commercial License (http://creativecommons.org/licenses/by-nc/3.0/) which permits unrestricted non-commercial use, distribution, and reproduction in any medium, provided the original work is properly cited.
Food or food group Food items included White rice Well-milled cooked rice
Rice with grains Cooked rice with soybean, Cooked rice with other cereals, Parched cereal powder
Ramen Ramen
Noodles Wheat noodles with soup
Other noodles Chajangmyon/Jambbong, Buckwheat vermicelli/Buckwheat noodle Dumplings Dumpling/Dumpling with soup
Rice cake Rice cake (plain rod shape)/rice cake with soup, Other rice cakes Bread Loaf bread/Sandwich/Toast, Bread with small red bean, Other breads Pizza/Hamburger Pizza/Hamburger
Flake Corn flakes
Cakes Cakes/Chocopie
Snacks/Sweets Cookie/Cracker/Snack, Candy/Chocolate Jam/Butter Jam/Honey/Butter/Margarine
Potatoes Starch jelly, Potatoes, Sweet potatoes, Starch vermicelli
Soybeans Legumes, Soup, and Stew with soybean paste/soybean paste, Tofu, Soybean milk
Nuts Nuts
Kimchi Kimchi, Kkakduki/small radish Kimchi, Radish with water Kimchi, Other Kimchi
Green-yellow vegetables Spinach, Lettuce, Perilla leaf, Vegetables wrap/Vegetable salad, Other green vegetables, Pepper leaves/Chamnamul/Asterscaber, Crown daisy/Leek/Water dropwort, Carrot/Carrot juice, Green pepper, immature pumpkin, Tomato/Cherry tomato/Tomato juice, Cucumber Table 1. Food grouping used in dietary pattern analysis1)
SUBJECTS AND METHODS Participants
The participants were selected from a community-based cohort of Korean Genome and Epidemiology Study; the design of that study has been described in detail previously [16]. In brief, Korean adults aged 40-69 years who lived in rural (Ansung) and urban (Ansan) areas were recruited from 2001 to 2002.
Among the 10,030 participants, we selected 3,388 men and women who had completed the dietary questionnaire, and underwent screening for depression. A total of 6,642 partici- pants were excluded for following reasons: did not attend first follow up examination (n = 2,515); no dietary data (n = 33); no depression screening data (n = 4,065); history of mental disorder (n = 7); outside of the recommended calorie cut-off range (< 500 and < 800 kcal or > 3,500 and > 4,000 kcal in women and men, respectively) (n = 22) [17]. Informed consent was obtained from all study participants. The data was provided National Biobank of Korea, the Centers for Disease Control and Prevention, Republic of Korea (4845-301, 4851-302, and -307).
The study protocol was approved by the Gachon University Institutional Review Board (1044396-201604-HR-028-01).
Screening for depression
For depression screening, the Beck Depression Inventory (BDI) was administered. The presence of depression was determined based on the BDI score: normal subjects (BDI score range: 0-15) and depression subjects (BDI score range: 16-63). The validity of the BDI has been previously verified and a BDI score of 16 is the optimal cut-off score for Koreans [18].
Dietary assessment
The subjects’ food intakes over the year preceding the survey were assessed by using a validated semi-quantitative food frequency questionnaire (SQFFQ) containing a list of 106 food items. The intake frequency of each food items was presented
in nine categories: never or seldom, once a month, 2-3 times a month, 1-2 times a week, 3-4 times a week, 5-6 times a week, once a day, twice a day, and three or more times a day. The intake amount of each food items was classified into three categories: small, medium (1 serving), or large. The SQFFQ was previously validated by using 12-day diet record data of 124 subjects [19]. Nutrient intakes were calculated for each subject by using the seventh edition food composition tables provided by the Korean Nutrition Society [20].
Measurement of covariates
Information on various covariates such as general characteris- tics and lifestyle data were collected by using an interviewer- administered questionnaire. The following is the list of covariates: age, marital status (married or other), exercise (yes or no), alcohol drinking (no or ex/current drinker), smoking (no or ex/current smoker), educational level (graduated elementary school, middle school, high school, or college or higher degree), family history of mental disorder (yes or no), sleep hours (≤ 5 hours, 5-6 hours, 6-7 hours, or ≥ 7 hours), chronic disease status such as diabetes, hypertension, and cardiovascular diseases (yes or no).
Height and weight were measured to the nearest 0.1 cm and 0.1 kg, respectively, by trained staff using a scale and a wall- mounted extensometer. Body mass index (BMI) was calculated as the weight in kilograms (kg)/ height in meters (m) squared.
Statistical analysis
The characteristics of subjects are expressed as a percentage (categorical variables) or as mean and standard deviation values (continuous variables). Differences between groups were tested using the t-test for continuous variables and the chi-square test for categorical variables
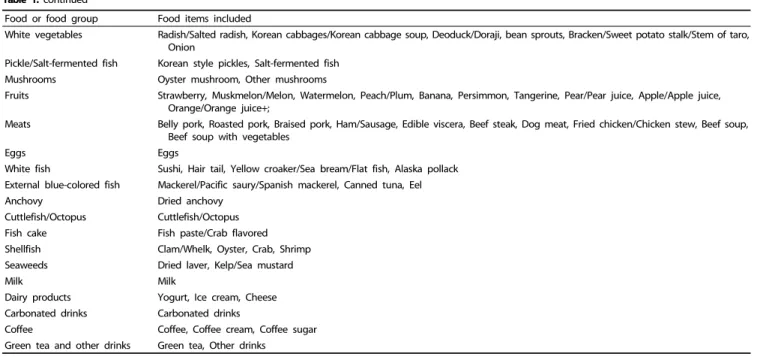
To reduce the complexity of the data, the 106 food items were categorized into 36 groups. In general, the food grouping was based on food and nutrient composition similarity (Table 1).
Dietary patterns were derived using factor analysis (principal
Food or food group Food items included
White vegetables Radish/Salted radish, Korean cabbages/Korean cabbage soup, Deoduck/Doraji, bean sprouts, Bracken/Sweet potato stalk/Stem of taro, Onion
Pickle/Salt-fermented fish Korean style pickles, Salt-fermented fish Mushrooms Oyster mushroom, Other mushrooms
Fruits Strawberry, Muskmelon/Melon, Watermelon, Peach/Plum, Banana, Persimmon, Tangerine, Pear/Pear juice, Apple/Apple juice, Orange/Orange juice+;
Meats Belly pork, Roasted pork, Braised pork, Ham/Sausage, Edible viscera, Beef steak, Dog meat, Fried chicken/Chicken stew, Beef soup, Beef soup with vegetables
Eggs Eggs
White fish Sushi, Hair tail, Yellow croaker/Sea bream/Flat fish, Alaska pollack External blue-colored fish Mackerel/Pacific saury/Spanish mackerel, Canned tuna, Eel Anchovy Dried anchovy
Cuttlefish/Octopus Cuttlefish/Octopus Fish cake Fish paste/Crab flavored Shellfish Clam/Whelk, Oyster, Crab, Shrimp Seaweeds Dried laver, Kelp/Sea mustard
Milk Milk
Dairy products Yogurt, Ice cream, Cheese Carbonated drinks Carbonated drinks
Coffee Coffee, Coffee cream, Coffee sugar Green tea and other drinks Green tea, Other drinks
1)Food items were from the semi-quantitative food frequency questionnaire Table 1. continued
Food group1) Total Male Female
Healthy Unhealthy Healthy Unhealthy Healthy Unhealthy
White rice -0.33 0.56 -0.36 0.55 -0.24 0.45
Rice with grains 0.34 -0.60 0.39 -0.60 0.26 -0.54
Ramen 0.44 0.36 0.35
Noodles 0.35 0.32 0.34
Other noodles 0.47 0.42 0.39
Dumplings 0.36 0.36 0.34
Rice cake 0.22 0.20
Bread 0.40 0.44 0.56
Pizza/Hamburger 0.29 0.38 0.30
Flake 0.25 0.23
Cakes 0.21 0.33
Snacks/Sweets 0.26 0.35 0.36
Jam/Butter 0.32 0.37 0.40
Potatoes 0.47 0.47 0.44
Soybeans 0.52 0.54 0.52
Nuts 0.28 0.27 0.27
Kimchi 0.28 0.33 0.33
Green-yellow vegetables 0.72 0.70 0.74
White vegetables 0.62 0.64 0.60
Pickle/Salt-fermented fish 0.25 0.31 0.23
Table 2. Factor loading matrix for the two dietary patterns identified from the responses to the Food Frequency Questionnaire
component) based on the 36 food groups of SQFFQ using PROC FACTOR. The factors were rotated via an orthogonal transforma- tion to simplify the structure and to obtain greater interpretability.
To determine the number of factors, we considered eigenvalues (> 2), scree test plots, and factor interpretability. The factor score for each pattern was calculated by summing intake of food groups weighted by factor loadings. Each subjects was then assigned a score for each of the identified patterns. Sujbects were divided into quartiles based on the factor score of each dietary pattern. We computed odds ratio (OR) values and their 95% confidence intervals (CI) using logistic regression. Multivariate
models were adjusted for age, BMI, education level, smoking, alcohol drinking, exercise, sleep hours, chronic diseases status, marital status, family history of mental disorder, and total energy intake. Data were analyzed using SAS 9.4 (SAS Institute Inc. Cary, NC, USA) and statistical significance was accepted at P < 0.05.
RESULTS
Dietary patterns of subjects
We identified two major dietary patterns by using factor analysis:
Food group1) Total Male Female
Healthy Unhealthy Healthy Unhealthy Healthy Unhealthy
Mushrooms 0.54 0.51 0.55
Fruits 0.45 0.43 0.42
Meats 0.27 0.50 0.33 0.41 0.36 0.42
Eggs 0.25 0.23 0.26 0.24 0.30
White fish 0.49 0.24 0.48 0.56
External blue-colored fish 0.44 0.41 0.49
Anchovy 0.44 0.43 0.46
Cuttlefish/Octopus 0.31 0.24 0.31 0.28 0.33
Fish cake 0.23 0.31 0.23 0.34 0.24 0.27
Shellfish 0.45 0.22 0.44 0.22 0.48
Seaweeds 0.49 0.46 0.50
Milk 0.23 0.23
Dairy products 0.32 0.25 0.34
Carbonated drinks 0.31 0.34 0.20
Coffee 0.39 0.24 0.37
Green tea and other drinks 0.31 0.28 0.35
1)Food groups with absolute values < 0.20 are not shown for simplicity.
Table 2. continued
Total Male Female
Normal (n = 2,940)
Depression
(n = 448) P-value Normal (n = 1,589)
Depression
(n = 180) P-value Normal (n = 1,351)
Depression
(n = 268) P-value Age (yrs) mean ± SD 52.2 ± 7.3 54.9 ± 8.5 < 0.0001 52.1 ± 7.1 54.2 ± 8.4 0.0015 52.4 ± 7.4 55.5 ± 8.5 < 0.0001 Marital status, n (%)
Married 2,737 (93.2) 385 (85.9) < 0.0001 1,546 (97.4) 168 (93.3) 0.003 1,191 (88.3) 217 (81.0) 0.0011
Others 200 (6.8) 63 (14.1) 42 (2.6) 12 (6.7) 158 (11.7) 51 (19.0)
Education, n (%)
Elementary school 414 (14.1) 114 (25.5) < 0.0001 123 (7.8) 22 (12.2) 0.0026 291 (21.6) 92 (34.3) < 0.0001 Middle school 553 (18.8) 103 (23.0) 260 (16.4) 39 (21.7) 293 (21.7) 64 (23.9) High school 1,221 (41.6) 170 (38.0) 646 (40.7) 78 (43.3) 575 (42.6) 92 (34.3) College or higher degree 750 (25.5) 61 (13.6) 559 (35.2) 41 (22.8) 191 (14.2) 20 (7.5) Sleep hours, n (%)
≤ 5 604 (20.6) 159 (35.5) < 0.0001 257 (16.2) 55 (30.6) < 0.0001 347 (25.7) 104 (38.8) 0.0002 5 < ≤ 6 862 (29.3) 114 (25.5) 456 (28.7) 45 (25.0) 406 (30.1) 69 (25.8)
6 < ≤ 7 902 (30.7) 109 (24.3) 521 (32.8) 46 (25.6) 381 (28.2) 63 (23.5)
> 7 570 (19.4) 66 (14.7) 354 (22.3) 34 (18.9) 216 (16.0) 32 (11.9) Alcohol drinking, n (%)
No 1,247 (42.4) 211 (47.1) 0.104 294 (18.5) 29 (16.1) 0.5229 953 (70.6) 182 (67.9) 0.4456 Ex-drinker 169 (5.8) 29 (6.5) 135 (8.5) 19 (10.6) 34 (2.5) 10 (3.7) Current drinker 1,523 (51.8) 208 (46.4) 1,160 (73.0) 132 (73.3) 363 (26.9) 76 (28.4) Smoking, n (%)
No 1,702 (57.9) 292 (65.2) 0.0036 386 (24.3) 36 (20.0) 0.2004 1,316 (97.5) 256 (95.5) 0.078 Ex or current smoker 1,237 (42.1) 156 (34.8) 1,203 (75.7) 144 (80.0) 34 (2.5) 12 (4.5) Exercise, n (%)
No 1,439 (49.0) 250 (56.2) 0.0049 749 (47.2) 97 (54.2) 0.0758 690 (51.2) 153 (57.5) 0.0588 Yes 1,496 (51.0) 195 (43.8) 838 (52.8) 82 (45.8) 658 (48.8) 113 (42.5) BMI, n (%)
< 25 1,742 (59.3) 282 (63.0) 0.1374 921 (58.0) 114 (63.3) 0.1656 821 (60.8) 168 (62.7) 0.5566
≥ 25 1,198 (40.8) 166 (37.1) 668 (42.0) 66 (36.7) 530 (39.2) 100 (37.3) Chronic diseases1), n (%)
No 2,305 (78.4) 306 (68.3) < 0.0001 1,238 (77.9) 131 (72.8) 0.1187 1,067 (79.0) 175 (65.3) < 0.0001 Yes 635 (21.6) 142 (31.7) 351 (22.1) 49 (27.2) 284 (21.0) 93 (34.7) Family history of mental
disorder, n (%)
No 2,920 (99.3) 446 (99.6) 0.5659 1,573 (99.0) 179 (99.4) 0.5563 1,347 (99.7) 267 (99.6) 0.8355
Yes 20 (0.7) 2 (0.5) 16 (1.0) 1 (0.6) 4 (0.3) 1 (0.4)
1)Chronic diseases such as diabetes, hypertension, hyperlipidemia, congestive heart failure, coronary artery disease, and myocardial infarction BMI: body mass index
Table 3. Characteristics of subjects with and without depression
No of total No of Cases Model 1 Model 2 Odds ratio (95% CI) Odds ratio (95% CI) Total (n = 3,388)
Healthy Q1 847 151 1.00 1.00
Q2 847 99 0.60 (0.46-0.80) 0.66 (0.49-0.88)
Q3 847 108 0.66 (0.50-0.86) 0.70 (0.52-0.94)
Q4 847 90 0.52 (0.39-0.69) 0.59 (0.42-0.82)
P value for trend < 0.0001 0.0037
Unhealthy Q1 847 125 1.00 1.00
Q2 847 104 1.06 (0.79-1.41) 1.18 (0.87-1.59)
Q3 847 111 1.23 (0.92-1.64) 1.36 (1.00-1.83)
Q4 847 108 1.39 (1.03-1.88) 1.65 (1.19-2.28)
P value for trend 0.0198 0.0021
Male (n = 1,769)
Healthy Q1 442 55 1.00 1.00
Q2 442 46 0.83 (0.55-1.27) 0.88 (0.57-1.36)
Q3 443 44 0.77 (0.50-1.17) 0.78 (0.49-1.23)
Q4 442 35 0.60 (0.38-0.94) 0.59 (0.35-0.98)
P value for trend 0.0236 0.0359
Unhealthy Q1 442 37 1.00 1.00
Q2 442 49 1.50 (0.95-2.36) 1.53 (0.96-2.44)
Q3 443 48 1.52 (0.96-2.41) 1.48 (0.92-2.38)
Q4 442 46 1.51 (0.95-2.41) 1.70 (1.03-2.80)
P value for trend 0.1182 0.0621
Female (n = 1,619)
Healthy Q1 404 96 1.00 1.00
Q2 405 55 0.55 (0.38-0.79) 0.59 (0.40-0.87)
Q3 405 66 0.71 (0.50-1.01) 0.81 (0.55-1.20)
Q4 405 51 0.52 (0.36-0.76) 0.64 (0.42-0.99)
P value for trend 0.0032 0.1179
Unhealthy Q1 404 75 1.00 1.00
Q2 405 55 0.78 (0.53-1.15) 0.80 (0.54-1.19)
Q3 405 65 1.03 (0.71-1.50) 1.16 (0.78-1.71)
Q4 405 73 1.27 (0.87-1.84) 1.50 (1.01-2.24)
P value for trend 0.0742 0.0104
Model 1: adjusted for sex (total) and age, Model 2: adjusted for sex (total), age, body mass index, exercise, smoking, alcohol drinking, marital status, education, sleep hours, family history of mental disorder, chronic diseases status, and total energy intake
Q, quartile; CI, confidence interval.
Table 4. Association of dietary pattern with the risk of depression by multivariate-adjusted regression analysis
healthy and unhealthy dietary patterns. The factor loadings associated with each of the 36 food groups for both of the dietary patterns in male and female subjects are presented in Table 2. A positive loading score means that the food group is positively associated with the dietary pattern whereas a negative loading score indicates an inverse association with the dietary pattern. On that basis, the healthy dietary pattern is characterized by high intakes of vegetables, soybeans, mushroom, seaweeds, white fish, shellfish and fruits and a low intake of refined rice. Similarly, the unhealthy dietary pattern was charac- terized by high factor loadings in refined rice, meats, ramen, other noodles, bread, and coffee and low factor loadings in rice with grains. Both male and female had similar dietary patterns.
Prevalence of depression and general characteristics
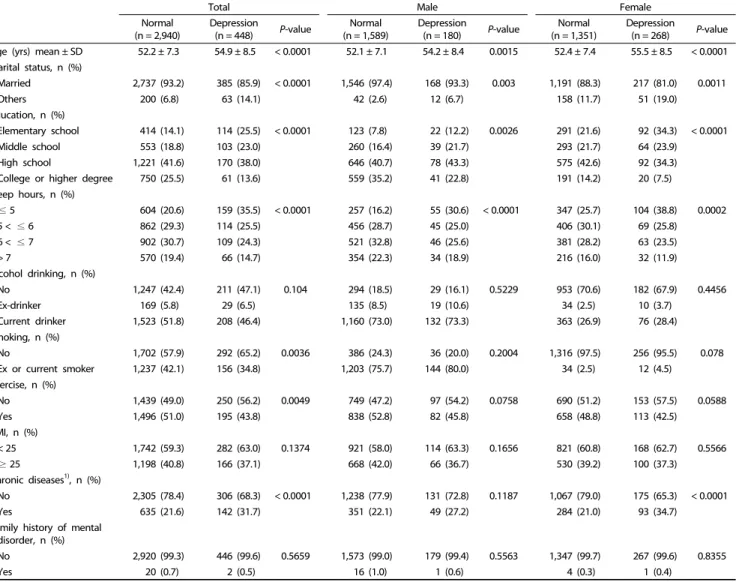
A summary of the sociodemographic characteristics, health behavior, marital status, sleep hours, and BMI of normal and depression subjects are shown in Table 3. Among the 3,388
subjects, 448 (13.2%) were identified as having depression.
There was a significantly greater age, more ‘others’ marital status, lower education level, less sleep hours, less exercise, and more having chronic diseases in subjects with depression than in normal subjects. In male, there were significant differences in age, marital status, education, and sleep hours between depression and normal subjects. In female, age, marital status, education, sleep hours, and chronic disease status were significantly different between the normal and depression groups.
Dietary patterns and depression
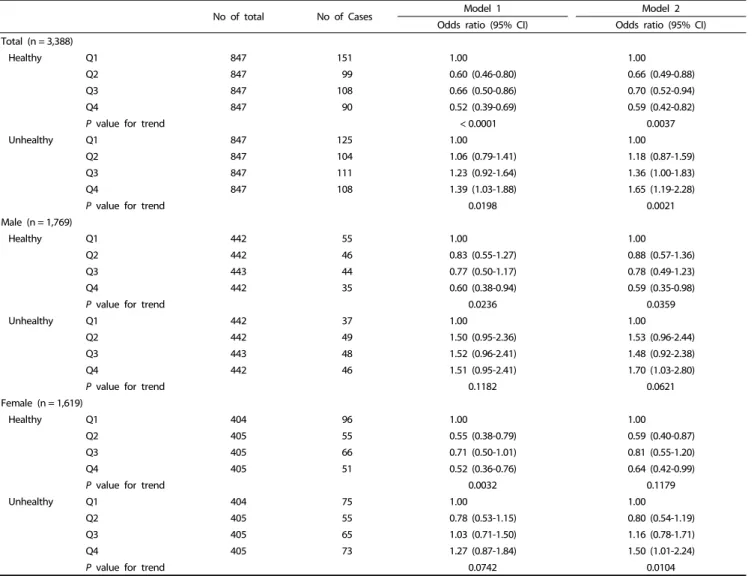
Table 4 presents the OR and 95% CI of depression across quartiles of the healthy and unhealthy dietary patterns. Compared with the subjects in the lowest quartile of the healthy dietary pattern group, those in the highest quartile had a significantly lower odds ratio (OR = 0.59, 95% CI: 0.42-0.82, P for trend = 0.0037 for all subjects, OR = 0.59, 95% CI: 0.35-0.98, P for trend
= 0.0359 for male, OR = 0.64, 95% CI: 0.42-0.99, P for trend =
0.1179 for female) after adjustment for age, BMI, exercise, smoking, alcohol drinking, marital status, education, sleep hours, family history of mental disorder, total energy intake and chronic disease status. In addition, the OR for the presence of depression in the highest quartile of the unhealthy dietary pattern group was significantly high compared to that in the lowest quartile as a reference (OR = 1.65, 95% CI: 1.19-2.28, P for trend = 0.0021 for all subjects, OR = 1.70, 95% CI: 1.03-2.80, P for trend = 0.0621 for male, OR = 1.50, 95% CI: 1.01-2.24, P for trend = 0.0104 for female).
DISCUSSION
We conducted this study to determine whether dietary patterns derived from food group intake are associated with the presence of depression in middle-aged Korean adults. In this study, a ‘healthy’ dietary pattern (high intakes of vegetables, soybeans, mushroom, seaweeds, white fish, shellfish, and fruits and a low intake of white rice) showed a lower risk of depression whereas the ‘unhealthy’ dietary pattern (high intakes of white rice, meats, ramen, noodles, bread, and coffee and a low intake of rice with grains) increased the risk of depression after controlling for various social, health, and dietary confounders.
To the best of our knowledge, this is the first study to examine the association between dietary pattern and depression in middle-aged Korea adults.
Our findings are similar to the results of a study of Korean adolescent girls, which indicated that a high intake of instant and processed foods increased the risk of depression and that high intakes of green vegetables, fruits, and beans was negatively associated with the risk of depression [15].
The healthy Japanese dietary pattern, which is characterized by a high intakes of vegetables, fruit, mushrooms, and soy products, has been associated with a low incidence of depressive symptom in Japanese adults [21]. Also, maintaining a dietary pattern rich in vegetables, mushrooms, seaweeds, soybean products, green tea, potatoes, and fish was shown to lower the risk of depressive symptoms among Japanese employees [22].
Western studies have also reported associations between dietary patterns and depression. Typically, the Mediterranean dietary pattern, which is characterized by a high intakes of vegetables, nuts, legumes, fruit, and fish, and a moderate alcohol consumption, was reported to lower the incidence of depression in the Spanish SUN cohort [23]. Also, in an Australian prospective study, Mediterranean-like and fruit dietary pattern was associated with a lower risk of depression in middle-aged women [24]. A three-year intervention study revealed that a Mediterranean diet with nuts has a beneficial effect on depression risk in diabetes patients [12]. Similarly, a healthy dietary pattern characterized by a high intake of various vegetables and nuts was associated with a low prevalence of depression in an Iranian population [25]. The whole-food dietary pattern (high intake of vegetables, fruits, and fish) was associated with a lower risk of depression and a processed food dietary pattern increased the risk of depression among middle-aged Whitehall II cohort participants [13].
The Korean healthy food pattern represents the traditional Korean diet, which includes plenty of vegetables, a high intake
of legumes and fish, and a low intake of red meat. Also, the Korean diet generally includes banchan (small side dishes) mainly consisting of vegetables with various jang (fermented soy products or pepper paste), garlic, pepper powder, sesame oil, and perilla oil [26]. Our study revealed that a healthy dietary pattern of middle-aged Koreans was characterized by high intakes of vegetables, soybeans, mushroom, seaweeds, white fish, shellfish and fruits. Therefore, the healthy dietary pattern is rich in dietary fiber, omega-3 fatty acid, and various antioxidant nutrients. A systematic review reported that dietary n-3 PUFA and fish consumption are associated with a low risk of depression [27].
And it has been reported that fish or seafood intake, as well as omega-3 fatty acid intake, could prevent depression in a Korean population [28-30]. Taylor et al. [31] reported that a fiber and n-3 PUFA rich diet may reduce the risk of depression, anxiety, and stress. Also, dietary fiber intake from vegetables and fruits significantly reduced the depressive symptoms among Japanese workers [32]. Dietary fibers are transferred to the cecum and large bowel for anaerobic fermentation by gut microbiota into short chain fatty acids, such as acetic, propionic, and caproic acids, which has been reported to partially contribute to the prevention of depression [33].
Because this was a cross-sectional study, it is difficult to determine causal relationships between a healthy dietary pattern and a reduced risk of depression. Nonetheless, the results of this study may help to prevent middle-aged depression by reducing these unhealthy eating patterns and increasing healthy eating patterns. In conclusion, our findings suggest that a healthy dietary pattern is associated with a lower risk of depression whereas an unhealthy dietary pattern is associated with a high risk of depression in middle-aged Korean adults.
ACKNOWLEDGEMENTS
We thanks to Ms. Yeonjae Lee what you contributed to grammar correction and proofreading
CONFLICT OF INTEREST
The authors have no conflicts of interest to report.
ORCID
Seon-Joo Park: https://orcid.org/0000-0002-1825-1815 Myung-Sunny Kim: https://orcid.org/0000-0002-5020-3397 Hae-Jeung Lee: https://orcid.org/0000-0001-8353-3619 REFERENCES
1. Prince M, Patel V, Saxena S, Maj M, Maselko J, Phillips MR, Rahman A. No health without mental health. Lancet 2007;370:859-77.
2. World Health Organization. World Health Day 2017. Geneva: World Health Organization; 2017.
3. Shin C, Kim Y, Park S, Yoon S, Ko YH, Kim YK, Kim SH, Jeon SW, Han C. Prevalence and associated factors of depression in general population of Korea: results from the Korea National Health and Nutrition Examination Survey, 2014. J Korean Med Sci 2017;32:
1861-9.
4. Park JH, Kim KW. A review of the epidemiology of depression in Korea. J Korean Med Assoc 2011;54:362-9.
5. Wolfe AR, Ogbonna EM, Lim S, Li Y, Zhang J. Dietary linoleic and oleic fatty acids in relation to severe depressed mood: 10 years follow-up of a national cohort. Prog Neuropsychopharmacol Biol Psychiatry 2009;33:972-7.
6. Suzuki S, Akechi T, Kobayashi M, Taniguchi K, Goto K, Sasaki S, Tsugane S, Nishiwaki Y, Miyaoka H, Uchitomi Y. Daily omega-3 fatty acid intake and depression in Japanese patients with newly diagnosed lung cancer. Br J Cancer 2004;90:787-93.
7. Gougeon L, Payette H, Morais JA, Gaudreau P, Shatenstein B, Gray-Donald K. Intakes of folate, vitamin B6 and B12 and risk of depression in community-dwelling older adults: the Quebec Longi- tudinal Study on Nutrition and Aging. Eur J Clin Nutr 2016;70:380-5.
8. Sánchez-Villegas A, Doreste J, Schlatter J, Pla J, Bes-Rastrollo M, Martínez-González MA. Association between folate, vitamin B6 and vitamin B12 intake and depression in the SUN cohort study. J Hum Nutr Diet 2009;22:122-33.
9. Hu FB. Dietary pattern analysis: a new direction in nutritional epidemiology. Curr Opin Lipidol 2002;13:3-9.
10. Jacques PF, Tucker KL. Are dietary patterns useful for understanding the role of diet in chronic disease? Am J Clin Nutr 2001;73:1-2.
11. Martínez-González MA, Sánchez-Villegas A. Food patterns and the prevention of depression. Proc Nutr Soc 2016;75:139-46.
12. Sánchez-Villegas A, Martínez-González MA, Estruch R, Salas-Salvadó J, Corella D, Covas MI, Arós F, Romaguera D, Gómez-Gracia E, Lapetra J, Pintó X, Martínez JA, Lamuela-Raventós RM, Ros E, Gea A, Wärnberg J, Serra-Majem L. Mediterranean dietary pattern and depression: the PREDIMED randomized trial. BMC Med 2013;11:208.
13. Akbaraly TN, Brunner EJ, Ferrie JE, Marmot MG, Kivimaki M, Singh-Manoux A. Dietary pattern and depressive symptoms in middle age. Br J Psychiatry 2009;195:408-13.
14. Chocano-Bedoya PO, O’Reilly EJ, Lucas M, Mirzaei F, Okereke OI, Fung TT, Hu FB, Ascherio A. Prospective study on long-term dietary patterns and incident depression in middle-aged and older women.
Am J Clin Nutr 2013;98:813-20.
15. Kim TH, Choi JY, Lee HH, Park Y. Associations between dietary pattern and depression in Korean adolescent girls. J Pediatr Adolesc Gynecol 2015;28:533-7.
16. Kim Y, Han BG; KoGES group. Cohort profile: the Korean Genome and Epidemiology Study (KoGES) Consortium. Int J Epidemiol 2017;46:e20.
17. Willett W. Nutritional Epidemiology. 2nd ed. New York (NY): Oxford University Press; 1998.
18. Jo SA, Park MH, Jo I, Ryu SH, Han C. Usefulness of Beck Depression Inventory (BDI) in the Korean elderly population. Int J Geriatr Psychiatry 2007;22:218-23.
19. Ahn Y, Kwon E, Shim JE, Park MK, Joo Y, Kimm K, Park C, Kim DH.
Validation and reproducibility of food frequency questionnaire for Korean genome epidemiologic study. Eur J Clin Nutr 2007;61:
1435-41.
20. The Korean Nutrition Society. Food Composition Table in Recom-
mended Dietary Allowances for Koreans 7th rev. Seoul: The Korean Nutrition Society; 2000.
21. Nanri A, Kimura Y, Matsushita Y, Ohta M, Sato M, Mishima N, Sasaki S, Mizoue T. Dietary patterns and depressive symptoms among Japanese men and women. Eur J Clin Nutr 2010;64:832-9.
22. Miki T, Eguchi M, Akter S, Kochi T, Kuwahara K, Kashino I, Hu H, Kabe I, Kawakami N, Nanri A, Mizoue T. Longitudinal adherence to a dietary pattern and risk of depressive symptoms: the Furukawa Nutrition and Health Study. Nutrition 2018;48:48-54.
23. Sánchez-Villegas A, Delgado-Rodríguez M, Alonso A, Schlatter J, Lahortiga F, Serra Majem L, Martínez-González MA. Association of the Mediterranean dietary pattern with the incidence of depression:
the Seguimiento Universidad de Navarra/University of Navarra follow-up (SUN) cohort. Arch Gen Psychiatry 2009;66:1090-8.
24. Rienks J, Dobson AJ, Mishra GD. Mediterranean dietary pattern and prevalence and incidence of depressive symptoms in mid-aged women: results from a large community-based prospective study.
Eur J Clin Nutr 2013;67:75-82.
25. Khosravi M, Sotoudeh G, Majdzadeh R, Nejati S, Darabi S, Raisi F, Esmaillzadeh A, Sorayani M. Healthy and unhealthy dietary patterns are related to depression: a case-control study. Psychiatry Investig 2015;12:434-42.
26. Kim SH, Kim MS, Lee MS, Park YS, Lee HJ, Kang S, Lee HS, Lee KE, Yang HJ, Kim MJ, Lee YE, Kwon DY. Korean diet: Characteristics and historical background. J Ethn Foods 2016;3:26-31.
27. Grosso G, Micek A, Marventano S, Castellano S, Mistretta A, Pajak A, Galvano F. Dietary n-3 PUFA, fish consumption and depression:
a systematic review and meta-analysis of observational studies. J Affect Disord 2016;205:269-81.
28. Yang Y, Je Y. Fish consumption and depression in Korean adults:
the Korea National Health and Nutrition Examination Survey, 2013-2015. Eur J Clin Nutr 2018;72:1142-9.
29. Park Y, Kim M, Baek D, Kim SH. Erythrocyte n-3 polyunsaturated fatty acid and seafood intake decrease the risk of depression:
case-control study in Korea. Ann Nutr Metab 2012;61:25-31.
30. Supartini A, Oishi T, Yagi N. Sex differences in the relationship between sleep behavior, fish consumption, and depressive symptoms in the general population of South Korea. Int J Environ Res Public Health 2017;14:789.
31. Taylor AM, Holscher HD. A review of dietary and microbial connections to depression, anxiety, and stress. Nutr Neurosci. Forthcoming 2018;9:1-14
32. Miki T, Eguchi M, Kurotani K, Kochi T, Kuwahara K, Ito R, Kimura Y, Tsuruoka H, Akter S, Kashino I, Kabe I, Kawakami N, Mizoue T.
Dietary fiber intake and depressive symptoms in Japanese employees:
the Furukawa Nutrition and Health Study. Nutrition 2016;32:584-9.
33. Skonieczna-Żydecka K, Grochans E, Maciejewska D, Szkup M, Schneider-Matyka D, Jurczak A, Łoniewski I, Kaczmarczyk M, Marlicz W, Czerwińska-Rogowska M, Pełka-Wysiecka J, Dec K, Stachowska E. Faecal short chain fatty acids profile is changed in Polish depressive women. Nutrients 2018;10:1939.