Study on Ship Motion Analysis of Turret-Moored LNG FSRU Compared with Model Test
6
0
0
전체 글
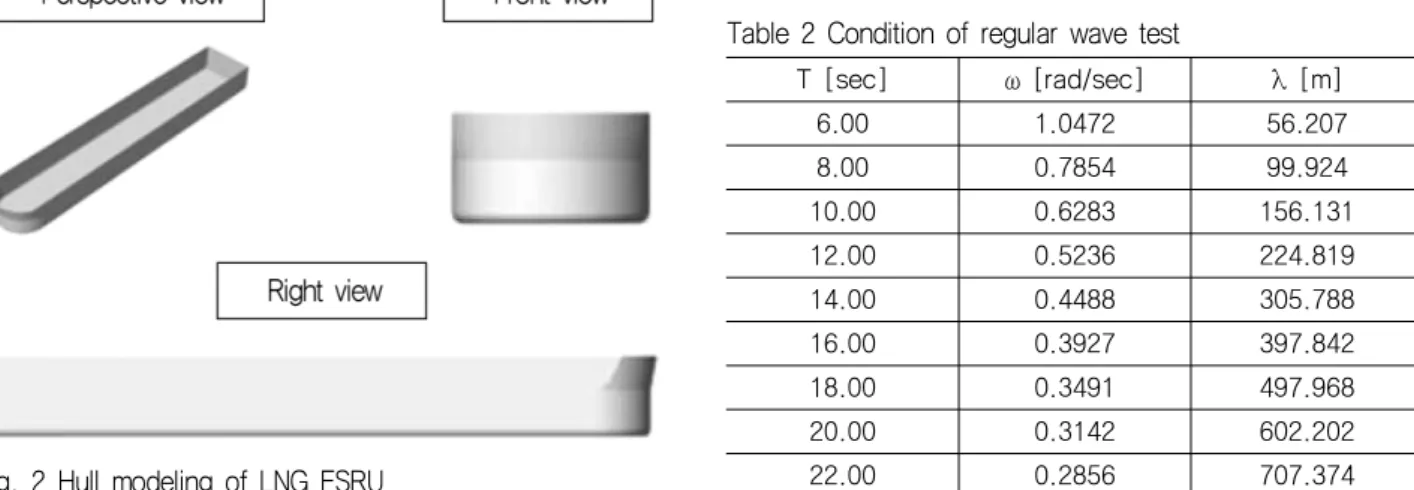
(2) 터렛 계류 LNG FSRU의 운동 해석 및 모형시험 검토. SPM tower mooring is used in harsh weather condition and. which is 315m (L), 53m (B), 28m (D) and design draft is. LNG carrier has to install manifold at bow. It can be applicable. 12.0m (Table 1). Flare tower is located in bow of FRSU and. in LNG FSRU. But SPM tower mooring system has safety. accommodation is located in stern. Two bilge keel is attached. problem relating transportation line which has to be installed. both side of hull for reducing its roll motion.. from storage tank to bow manifold and hard to maintain low temperature. STL is designed to offload LNG in harsh weather condition which can disconnect mooring/riser lines in all weather condition and weathervaning for reducing its environmental loading. Considering all feature of 3 mooring system, STL is selected for FSRU mooring system because of possibility of moving to other place in bad weather condition or energy demand at season. And STL is applicable in all water depth.. Fig. 3 Ship coordinates Table 1 Main particulars of the turret-moored LNG FSRU Symbol. Unit. Quantity. Length overall. LOA. m. 317.75. Length between perpendiculars. LBP. m. 315.00. Breadth(MLD). B. m. 53.00. Depth(MLD). D. m. 28.00. Draft(Design). Td. m. 12.00. The ship coordinate system definition is shown in Fig. 3. All. Fig. 1 North america east coast. measurements and locations are based on this coordinate system.. 2. The Concept Design of LNG FSRU 2.2 Model Test 2.1 Main Dimensions and Arrangement 3. The designed FSRU is 270,000m with the main dimensions. Test model was made 1/60 scale and material is FRP which is easy to control the mass distribution because it is lighter than wood. In the model test water depth is 3.2m corresponding 192m as full-scale. Before the FSRU motion. Table 2 Condition of regular wave test. Fig. 2 Hull modeling of LNG FSRU. 128. T [sec]. ω [rad/sec]. λ [m]. 6.00. 1.0472. 56.207. 8.00. 0.7854. 99.924. 10.00. 0.6283. 156.131. 12.00. 0.5236. 224.819. 14.00. 0.4488. 305.788. 16.00. 0.3927. 397.842. 18.00. 0.3491. 497.968. 20.00. 0.3142. 602.202. 22.00. 0.2856. 707.374. 대한조선학회 특별논문집 2011년 9월.
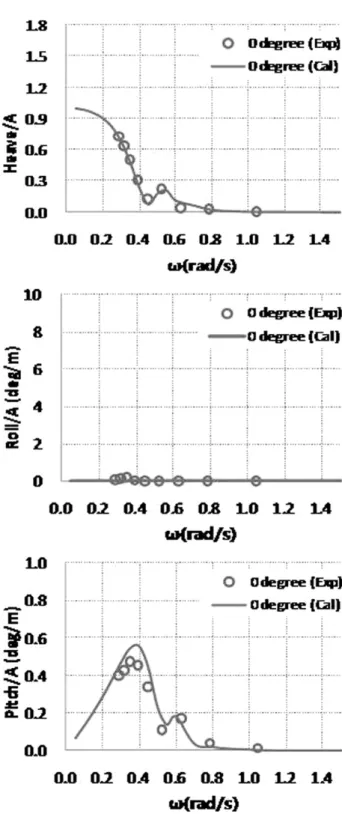
(3) 지현우․ 박병준․ 정승규․ 최영달․ 홍석원․ 성홍근․ 조석규. model test, free roll decay test was executed for selecting proper bilge keel and large bilge keel was chosen for its damping capacity. 6DOF motion was measured by RODYM3D which is using optical sensor and accuracy is 50μm. Data acquisition rate is 50 Hz and stored in computer. Test of regular waves carried out in order to obtain the exact motion response. In the test, the entire wave slope wasmaintained 1/30 and condition of regular wave test was shown in Table 2.. Fig. 4 LNG FSRU model. Fig. 5 Bilge keel shape of FSRU. 2.3 Comparison of Motion Analysis & Model Test The ship motion analysis is important in the FSRU design and its hydrodynamic performance effects FSRU plant availability. The purpose of the motion analysis is to evaluate 6DOF (six degree of freedom) motion. Ship motion simulation was performed by WADAM which is based on 3-D radiationdiffraction theory. In order to validate the numerical calculation, model test was performed in MOERI. Model test was executed in various. Fig. 6 Heave, roll, pitch RAO in regular wave (0deg). wave heading angle, 180deg, 135deg, 90deg, 45deg, and 0deg. Overall the results show almost the similar. The accuracy of single body motion analysis is high. But pitch value of. 0 degree result: Heave values of model test and calculation decrease as angular velocity (ω) increase and go to zero at. calculation is always higher than model test values. Special. the 0.8 rad/s. It means LNG FSRU do not move vertically. consideration is needed to increase accuracy of pitch RAO values.. when wave angular velocity is higher than ω = 0.8 rad/s. Because of no wave coming transverse direction, roll values. In order to compare between analysis and model test,. of calculation and model test is almost zero. But model test. motion of 0deg and 45deg are only presented as below figure (Fig. 6, 7).. has a small roll RAO values and it is consider as viscosity effect. Pitch values of calculation is higher than model test. Special Issue of SNAK, September 2011. 129.
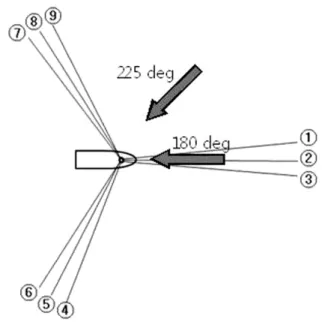
(4) 터렛 계류 LNG FSRU의 운동 해석 및 모형시험 검토. 3. Mooring Force : Model Test Model Test was performed in MOERI. To verify the effect of environmental load, FSRU tested at various wave heights and heading condition (Hs = 3m, 4m, 11.9m, Heading Angle: 180deg, 225deg). Mooring line is arranged 3 directions and 3 lines in each direction. Fig. 8 shows mooring line arrangement of FSRU. Mooring line arrangement and chain was designed by MOERI. Mooring chain dimension is 1.47m (L), 0.52m (B) 0.13m (t) and weight in water is 449.2kg/m. Following items measured in the mooring test. ∙ Ship 6 DOF Motion (Center of Gravity/Turret) ∙ Mooring Line Tension ( 9 lines) ∙ Acceleration (Helideck/Crane/Flare Tower) ∙ Relative wave height (4 point) ∙ Wave height (2 point). 3.1 Mooring Analysis In order to evaluate the mooring arrangement the numerical analysis was conducted. The analysis was carried out by DNV SESAM package which is widely used in the shipyard and oil major design department. As previous informed, the FSRU is located in the shallow water depth (200m). So, the shallow water effect should be taken into account for the mooring design stage. The mooring analysis is only considered wave heading as 180deg and 225deg due to weathervaning and based on the meta-ocean data.. Fig. 7 Heave, roll, pitch RAO in regular wave (45deg) result around natural frequency. Pitch motion do not occur over the w = 0.8rad/s. 45 degree result: Heave values of model test and calculation decrease as angular velocity (ω) increase and go to zero at the 0.8 rad/s. Heave value is more than 0degree result at the same wave angular frequency Maximum roll RAO value is 1.8deg and model test result is higher than analysis result. Overall result shows good agreement. Pitch values of calculation is higher than model test result around natural frequency. Pitch motion do not occur over the ω = 1.0 rad/s.. 130. Fig. 8 LNG FSRU mooring line arrangement & wave heading angle. 대한조선학회 특별논문집 2011년 9월.
(5) 지현우․ 박병준․ 정승규․ 최영달․ 홍석원․ 성홍근․ 조석규. DeepC in SESAM package is nonlinear time domain mooring/. representative of each direction.. iser analysis program which include SIMO and Riflex as solver.. Table 4 shows statistical result of FSRU time domain analysis. DeepC possibly take into account dynamic response due to. and model test. Mean value of line tension, Root Mean Square,. mooring line and riser restoring, damping and inertia forces.. Maximum line tension is compared to verify FSRU time domain. Table 3 shows irregular wave loading test matrix and DeepC. analysis result.. mooring line tension result shown in Fig. 9 ~ 14. Due to complexity of graph, line 2, line 5, line 8 was chosen as. Table 3 Irregular wave loading tests Hs. Tp. Heading angle. IRW 01. 3.0m. 11.0. 180 deg. IRW 02. 4.0m. 12.5. 180 deg. IRW 03. 11.9m. 14.2. 180 deg. IRW 04. 3.0m. 11.0. 225 deg. IRW 05. 4.0m. 12.5. 225 deg. IRW 06. 11.9m. 14.2. 225 deg. Fig. 13 IRW05 - mooring line tension result (DeepC). Fig. 14 IRW06 - mooring line tension result (DeepC) Table 4 Mooring result - IRW 01 Fig. 9 IRW01 - mooring line tension result (DeepC) wave. Fig. 10 IRW02 - mooring line tension result (DeepC). Fig. 11 IRW03 - mooring line tension result (DeepC). Fig. 12 IRW04 - mooring line tension result (DeepC). Special Issue of SNAK, September 2011. Line. DeepC Mean RMS. Model test Max Mean RMS. Max. Line 2 1928. 38. 2071 1699. 53. 1957. IRW 01 Line 5 1949. 36. 2090 1655. 44. 1989. Line 8 1949. 36. 2090 1645. 47. 1970. Line 2 1927. 57. 2202 1700. 79. 2050. IRW 02 Line 5 1949. 59. 2296 1638. 66. 2162. Line 8 1949. 59. 2295 1644. 63. 2075. Line 2 1920. 332. 5124 1964. 458. 5805. IRW 03 Line 5 1941. 450. 4868 1544. 288. 4454. Line 8 1941. 449. 4862 1524. 264. 4038. Line 2 1967. 42. 2135 1687. 46. 1912. IRW 04 Line 5 1985. 42. 2172 1687. 35. 1964. Line 8 1984. 47. 2214 1624. 63. 1992. Line 2 1967. 68. 2430 1689. 63. 2029. IRW 05 Line 5 1986. 78. 2601 1689. 52. 2126. Line 8 1983. 81. 2636 1614. 83. 2099. Line 2 2141. 427. 4140 1920. 322. 4458. IRW 06 Line 5 1869. 614. 5302 1845. 353. 6074. Line 8 1834. 637. 5177 1323. 291. 4591. 131.
(6) 터렛 계류 LNG FSRU의 운동 해석 및 모형시험 검토. Reference. As can be expected from Table 4, the numerical result tendency shows good agreement in mean, RMS, max values and small difference is showed in some results. The most mean line tension of analysis is higher than model test. DeepC results can estimate the RMS (Root Mean Square) values accurately except for high wave condition (Hs = 11.9m). The average RMS value in high wave condition (Hs=11.9m) of analysis is higher than model test. This result means that the range of mooring line tension change in analysis is wider than model test. Maximum line tension value of analysis is about 12% lower than model test result in the high wave condition (Hs=11.9m). In case of heading angle 225deg, maximum line tension occur in line 4 ~ 6 or line 7 ~ 9. The maximum values between line 4~6 and line 7~9 is almost same except for IRW 06 case.. Kim, Y. B and M. H. Kim, 2004, “Hull/Mooring/Riser Coupled Dynamic Analysis of a Turret-Moored FPSO Compared with OTRC model test,” SOTECH, Vol.8, No.3, pp.26-39. Kim, Y.B and M.H. Kim, 2005, “Dynamic Analysis of MultipleBody Floating Platform Coupled with Mooring Lines and Riser,” SOTECH, Vol.9, No.1, pp.11-26. Kim, Y.S, 2009, “Experimental and numerical study on motion responses of LNG FSRU,” MOERI/KORDI, The Korean Society of Ocean Engineers (KSOE). Hong, Y.-P., Wada Yojiro, Y.-H. Choi and S. E. Kim, 2009, “An model testal and Numerical Study on the Motion Characteristics of Side-by-Side Moored LNG-FPSO and LNG carrier,” ISOPE Proceeding, pp.172-179.. 4. Summary and Conclusions Because FSRU is permanently moored offshore, safety based design should be consider and the abnormal environment condition can be a one of very important design criteria compare to the other floaters. To verify its hydrodynamic performance, motion and time domain mooring analysis executed by DNV SESAM package and compared with model test. The result of motion analysis shows good agreement with model test. Total 6 cases mooring analysis varying wave height and heading angle was executed. The overall result of mooring tension shows good agreement with model test. But IRW03, IRW06 case shows discrepancies about 12% in maximum line tension between numerical result and model test. The study will include wind and current effect later for more accurate analysis. 지현우. 박병준. 정승규. 홍석원. 성홍근. 조석규. 최영달. Acknowledgement This study is a part of LNG FSRU project, ‘Core Methodologies for Design of LNG FSRU's Structure and Mooring System’. It cooperated with MOERI (Maritime & Ocean Engineering Research Institute) and Korea Shipyards for developing the unique LNG FSRU for topside and hull.. 132. 대한조선학회 특별논문집 2011년 9월.
(7)
수치
관련 문서
value SISO model result at acceleration step transient conditions : Volumetric efficiency ··· 48 Figure 56 Comparison between mean value model result and mean.. value SISO
Also, for verifying the study hypothesis, unitary multi-variant analysis, correlation analysis and structural equation model analysis were carried out. The
XRD analysis, surface roughness test, FE-SEM imaging, and biaxial flexural strength test were performed... Results: In the result of XRD analysis, an phase change occurred
In contrast, Chiropractic has shown better result than sports massage in the range of motion of the shoulder joint, Thoracic Scapular rhythm test, and the
2. The finite element is calculating using tension test of uni-direction 0° and 90°, compression test of uni-direction 0° and 90° and shear test results and, the results
선형 표현을 위한 주요 곡선들 - Water Line 생성 (3).. 11/61.. 2009 Spring,
Transformed –log 10 p of SNPs from the logistic regression model of association with dementia based on the additive model in male subjects.. P-value on the left Y-axis is
2-7(a) Comparison of Stream line(Bare Hull, bottom stern view)... 2-7(b) Comparison of Stream line(BF1,
