Introduction
In the population-based studies, degenerative aortic valve diseases become notably more common, with an increasing prevalence in the population over age 65 years.1) An improved comprehension of the aortic root geometry could assist with better understanding the pathophysiology of aortic valve dis- eases, improving the diagnosis of aortic valve disease and fur- ther developing either surgical or transcatheter aortic valve implantation.
There is ambiguity about both the precise nature and the relationship between various structures composing the aortic root.2) However, there have been many attempts to under- stand the aortic root geometry.3-6) The volumetric approach of the aortic root geometry has never been attempted. The volu- metric measurements might improve the knowledge about the aortic root geometry.
Three-dimensional (3D) echocardiography has been report- ed to be valuable for evaluating the geometry of cardiac cham- ORIGINAL ARTICLE J Cardiovasc Ultrasound 2011;19(3):128-133
Validation of Three-Dimensional
Echocardiography for Quantification of Aortic Root Geometry: Comparison
with Multi-Detector Computed Tomography
Jin-Sun Park, MD, Yong-Woo Choi, MD, Jeoung-Sook Shin, MD, Hyoung-Mo Yang, MD, Hong-Seok Lim, MD, PhD, Byoung-Joo Choi, MD, So-Yeon Choi, MD, PhD,
Myeong-Ho Yoon, MD, PhD, Gyo-Seung Hwang, MD, PhD, Seung-Jea Tahk, MD, PhD and Joon-Han Shin, MD
Department of Cardiology, Ajou University School of Medicine, Suwon, Korea
Background: Three-dimensional (3D) echocardiography has been reported to be valuable for evaluating the geometry of cardiac chambers. We validated the accuracy of 3D transthoracic echocardiography for quantifying aortic root geometry in comparison with cardiac multi-detector computed tomography (MDCT).
Methods: Twenty-three patients who underwent cardiac MDCT and showed normal left ventricular ejection fraction (> 55%), as assessed by 2-dimensional transthoracic echocardiography, were enrolled (12 male, mean 53 ± 9 years). We defined the aortic root volume as the volume from the aortic annulus to the sinotubular junction. The aortic root volume at end-diastole measured by both cardiac MDCT and 3D echocardiography was assessed.
Results: The cross-sectional area of the aortic root was asymmetric. At the annulus level, the cross-sectional area showed asymmetric triangle. From the aortic annulus to the most dilated point of the sinus of Valsalva, the asymmetric triangular shape was maintained. From the most dilated point of the sinus of Valsalva to the sinotubular junction, the cross-sectional shape of the aortic root changed to oval. The average aortic root volumes measured by 3D echocardiography (ARV-3DE) were 13.6 ± 4.8 mL at end-diastole and 14.1 ± 5.3 mL at end-systole, respectively. The average aortic root volume measured by MDCT at end- diastole (ARV-CT) was 14.1 ± 5.7 mL. At end-diastole, the ARV-3DE correlated well with the ARV-CT (R2 = 0.926, difference
= 0.5 ± 1.7 mL), and the two methods were in excellent agreement (the percent difference was 0%).
Conclusion: Our results demonstrate both the feasibility and accuracy of 3D echocardiography for the clinical assessment of the geometry of the aortic root.
KEY WORDS: Three-dimensional echocardiography · Aortic root geometry · Cardiac multi-detector computed tomography.
• Received: May 16, 2011 • Revised: August 8, 2011 • Accepted: August 17, 2011
• Address for Correspondence: Joon-Han Shin, Department of Cardiology, Ajou University School of Medicine, San 5 Woncheon-dong, Yeongtong-gu, Suwon 443-721, Korea Tel: +82-31-219-5711, Fax: +82-31-219-5708, E-mail: shinjh@ajou.ac.kr
• This is an Open Access article distributed under the terms of the Creative Commons Attribution Non-Commercial License (http://creativecommons.org/licenses/by-nc/3.0) which permits unrestricted non-commercial use, distribution, and reproduction in any medium, provided the original work is properly cited.
bers.7-9) We hypothesized that 3D transthoracic echocardiogra- phy (TTE) could be one of imaging modalities for volumetric quantification of the aortic root geometry. We evaluated the accuracy of 3D TTE for quantifying the aortic root geometry in comparison with cardiac multi-detector computed tomog- raphy (MDCT).
Methods
We retrospectively studied 23 consecutive patients who un- derwent cardiac MDCT and showed normal ejection fraction (> 55%), as assessed by two-dimensional (2D) TTE. The con- ventional 2D and 3D studies were performed within 1 month, either after or before undergoing cardiac MDCT. The medical records of all patients were retrospectively reviewed. We ex- cluded from the study the patients with any of the following:
valvular heart disease, cardiomyopathy, left ventricular hyper- trophy and atrial fibrillation. In the literature, there is no pub- lished data on the volumetric assessment of the aortic root vol- ume. Therefore, we excluded from our study the patients with any pathologic findings that could affect the aortic root geom- etry. This study was approved by the Institutional Review Board at Ajou University Hospital (approval number: AJIRB- MED-MDB-11-140).
The study was conducted using the Philips iE33 ultrasound system and the X3-1 matrix-array transducer (Philips Medical Systems, Andover, MA, USA). A full volume loop was acquired from the parasternal long axis view over four cardiac cycles.
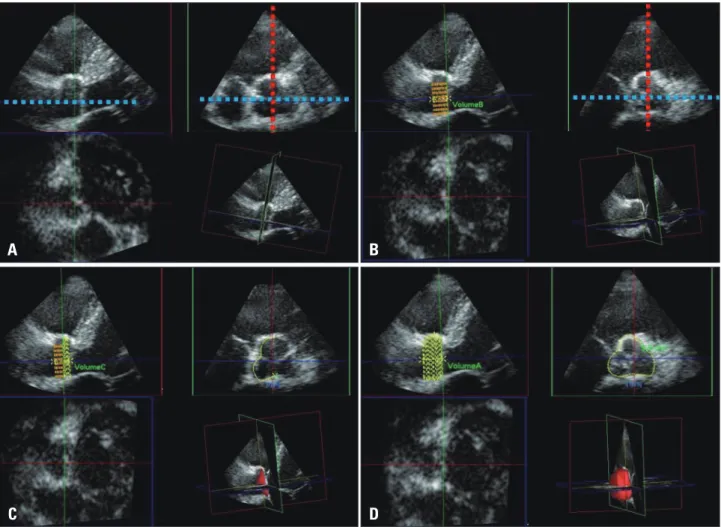
Measurements of the 3D aortic root volume were performed offline by an experienced physician, using the QLAB Ad- vanced Ultrasound Quantification Software Release 8.1 (Phil- ips Medical Systems, Andover, MA, USA). We defined the aortic root volume as the volume from the aortic annulus to the sinotubular junction (Fig. 1). The multiplanar reconstruc- tive method (MPR) was used for quantification of the aortic root geometry. One plane was aligned with the parallel line of
the long axis of the ascending aorta, passing the coaptation point of the aortic cusps. A second line was set as the line per- pendicular to the first line and cut across the coaptation point of the three aortic cusps. The stacked contour mode was used.
The borders of the stacked contour were set from the aortic annulus to the sinotubular junction. From the aortic annulus to the sinotubular junction, twenty default slices were set. The aortic root was equally divided along the first line into 20 slic- es. Semi-automated border detection was performed to define the contour of each slice. For more accurate measurements, we corrected each contour manually. We traced the contour as the inner layer of the aortic root. After defining the contour of each slice, the volume was calculated automatically, using in- tegration of each area (Fig. 2). The end-systolic aortic root vol- ume was measured at the end of the T wave on electrocardio- gram. The end-diastolic aortic root volume was measured at the starting point of the R wave on electrocardiogram. The left ventricular end-diastolic and end-systolic volumes and the ejection fraction were calculated in 2D TTE using the biplane modified Simpson’s rule.
Sixty-four channel cardiac MDCT was performed with the Brilliance 190p (Philips, Eindhoven, Netherlands). The end-di- astolic aortic root volumes were measured. Vitrea2 imaging software version 3.1 (Vital Images, Plymouth, MN, USA) was used for acquiring advanced 3D volume data of the aortic root.
Due to limitation of the imaging acquisition protocol of MDCT, we could not record with MDCT any data of the end- systolic volume of the aortic root.
The SPSS 12.0 (SPSS Inc., Chicago, IL, USA) statistical software package was used for analysis of descriptive data. All descriptive data are expressed as mean ± standard deviations (SDs) for the continuous variables, and as percentages for the categorical variables. The end-diastolic aortic root volume de- termined by 3D TTE was compared with the end-diastolic aortic root volume calculated by MDCT. The linear associa-
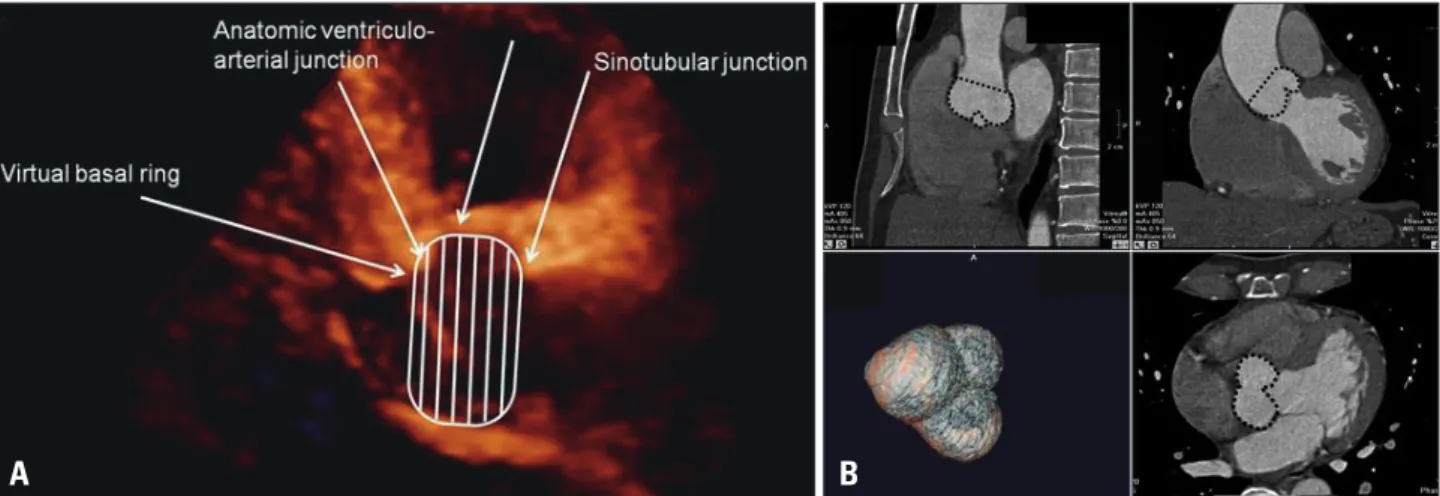
Fig. 1. Definition of the aortic root volume. The aortic root volume was defined as the volume from the aortic annulus to the sinotubular junction. The aortic annulus is defined at the level of the basal attachment of the aortic valve leaflets (i.e. the “inferior virtual basal ring”). The sinotubular junction is the interface between the aortic root and the tubular ascending aorta. A: Aortic root volume in three-dimensional echocardiography was measured in the parasternal long axis view. B: Aortic root volume in cardiac multi-detector computed tomography was measured using the multiplanar reconstructive method in the Vitrea2 imaging software.
A B
tion between the two methods was assessed with linear regres- sion analysis and with Pearson’s correlation coefficient. Bland- Altman plot was created to calculate the limits of agreement between the two methods.10)
Results
The study population consisted of 23 patients (mean age 53 ± 9 years, 12 male and 11 female). The 2D and 3D echocardio- graphic parameters of the study population are summarized in Table 1. There was no statistically significant difference in the left ventricular end-diastolic and end-systolic volumes and
ejection fraction between 2D TTE and 3D TTE.
The cross-sectional area of the aortic root was asymmetric.
At the level of the annulus, the cross-sectional area showed asymmetric triangle. From the aortic annulus to the most di- lated point of the sinus of Valsalva, the asymmetric triangular shape was maintained. From the most dilated point of the si- nus of Valsalva to the sinotubular junction, the cross-sectional shape of the aortic root changed to oval (Fig. 3). Mean differ- ence between the maximal and minimal diameters of the an- nulus and the sinotubular junction were 2.4 ± 1.3 mm and 3.4 ± 1.9 mm, respectively, indicating asymmetry of aortic
Fig. 2. Off-line analysis for quantification of the aortic root volume by 3-dimensional echocardiography. One plane (blue line) was aligned with the parallel line of the long axis of the ascending aorta passing the coaptation point of the aortic cusps. A second plane (red line) was set as the line perpendicular on the first line and cut across the coaptation point of the aortic cusps. The images of the parasternal long axis view were reversed due to limitation of the software we used. In order to acquire the most accurate aortic root volume data considering manipulation of the manual contour correction, the reversed images were chosen (A). From the aortic annulus to the sinotubular junction, 20 default slices were set. The aortic root was equally divided along the first line into 20 slices (B). The contours of each slice were traced as the inner layer of the aortic root manually (C). After defining the contour of each slice, the volume was calculated automatically using integration of each area (D).
C A
A B C D
D B
Fig. 3. The geometric pattern of the aortic root cross-sectional area by three-dimensional echocardiography. A: Asymmetric triangular shape of the aortic annulus level. B: Asymmetric triangular shape at the most dilated portion of the sinus of Valsalva. C: Change of the geometry from asymmetric triangular to oval shape between the most dilated portion of the sinus of Valsalva to the sinotubular junction. D: Oval shape at the sinotubular junction.
root (Table 1).
The aortic root volume measured by 3D TTE (ARV-3DE) at end-diastole was 13.6 ± 4.8 mL, and the aortic root volume measured by MDCT (ARV-CT) at end-diastole was 14.1 ± 5.7 mL. The end-systolic ARV-3DE was 14.1 ± 5.3 mL. By linear regression analysis, 3D TTE showed good correlation with MDCT in the assessment of the aortic root volume (R2 = 0.93) (Fig. 4). The ARV-3DE showed an excellent agreement with the ARV-CT (difference = 0.5 ± 1.7 mL, % difference = 0%) (Fig. 5). There was no statistically significant difference in the distance between the annulus and the ostium of the left coronary artery, the distance between the annulus and the osti- um of the right coronary artery and the distance between the annulus and the sinus of Valsalva, which are known as useful parameters for the selection of candidates for transcatheter aor- tic valve implantation, between 3D TTE and MDCT (Table 2).
By an experienced physician, measurements of the 3D aortic root volume, using the QLAB Advanced Ultrasound Quanti- fication Software Release 8.1, took around 1 minute. The ab- solute values of the mean paired differences were 0.288 ± 0.2995, p = 0.794 and 0.522 ± 0.872, p = 0.11 for inter- and intra-observer variability of the aortic root volume measured by 3D TTE, indicating good reproducibility and feasibility.
Discussion
The present study demonstrated that 3D TTE could be used for quantification of aortic root volume. Also, we presented the new method for understanding the aortic root geometry.
Accurate assessment of the aortic root is considered as in- creasingly important. Two-dimensional echocardiography has had an important role in the assessment of the aortic root ge- ometry. The dimensions of the aortic root can be measured with 2D echocardiography. There is ambiguity about both the precise nature and the relationship between the various struc- tures composing the aortic root.2) Several studies demonstrat- ed that the aortic root geometry was asymmetric.4)11)12) In the
Table 1. Baseline characteristics
Variables Mean ± standard
deviation 2DE parameters
Quantification of the LV
LVEDV (mL) 88.4 ± 25.0
LVESV (mL) 34.9 ± 12.5
IVSd (mm) 9 ± 1.4
PWd (mm) 9 ± 1.6
EF (%) 66.5 ± 5.8
LVM (g) 156 ± 46.4
LVMI (g/m2) 90.6 ± 19.0
Quantification of the aorta
Annulus of aorta (mm) 22.4 ± 2.5 Sinus of Valsalva (mm) 33.2 ± 4.4
ST junction (mm) 27.8 ± 3.0
3DE parameters Quantification of the LV
LVEDV (mL) 87.4 ± 23.7
LVESV (mL) 31.0 ± 9.8
SV (mL) 56.5 ± 15.6
EF (%) 64.8 ± 5.0
Quantification of the aorta
Minimal diameter of aortic annulus (mm) 21.2 ± 2.7 Maximal diameter of aortic annulus (mm) 23.6 ± 2.4 Minimal diameter of ST junction (mm) 22.9 ± 3.4 Maximal diameter of ST junction (mm) 26.3 ± 3.1 ARV-3DE at end-diastole (mL) 13.6 ± 4.8 ARV-3DE at end-systole (mL) 14.1 ± 5.3
ARV-CT (mL) 14.1 ± 5.7
2DE: two-dimensional echocardiography, 3DE: three-dimensional echocardiography, LV: left ventricle, LVEDV: left ventricular end- diastolic volume, LVESV: left ventricular end-systolic volume, IVSd:
interventricular septal dimension, PWd: posterior wall dimension, EF:
ejection fraction, LVM: left ventricular mass, LVMI: left ventricular mass index, ST: sinotubular, SV: stroke volume, ARV-3DE: the aortic root volume measured by 3DE, ARV-CT: the aortic root volume measured by cardiac multidetector computed tomography
Fig. 4. Linear regression analysis for the three-dimensional echo- cardiography method versus the cardiac multi-detector computed tomography in quantification of the aortic root geometry. ARV-CT: the aortic root volume measured by computed tomography, ARV-3DE: the aortic root volume measured by three-dimensional echocardiography.
Fig. 5. Bland-Altman analysis for the three-dimensional echocardio- graphy method versus the cardiac multi-detector computed tomography in quantification of the aortic root geometry. ARV-CT: the aortic root volume measured by computed tomography, ARV-3DE: the aortic root volume measured by three-dimensional echocardiography, SD:
standard deviation.
0 -4
-3 -2 -1 0 1 2 3 4 5
5 10 15 20 25 30
0 0 5 10 15 20 25 30
Mean + 2 SD
Mean
Mean - 2 SD
5 10 15 20 25
ARV-CT (mL) Average of ARV-3DE and ARV-CT (mL)
y = 1.1303x-1.3037 R2 = 0.9264
ARV-3DE (mL) Diff (ARV-CT-ARV-3DE) (mL)
present study, we also demonstrated the asymmetry of the aor- tic root. Due to the asymmetric characteristics of the aortic root geometry, the 2D echocardiographic measurement of the aortic valve annulus may not be the ideal approach.13) The asymmetric aortic root geometry can be accurately visualized with 3D imaging techniques.4)13) Three-dimensional imaging techniques provide highly accurate measurements, by allow- ing proper orientation of the orthogonal multiplanar reforma- tion planes through all the levels of the aortic root.
Cardiac magnetic resonance imaging (CMR) and cardiac MDCT are considered the gold standard imaging techniques to evaluate the aortic root.13) However, CMR is not widely avail- able, is more costly, and cannot be used on patients with im- planted pacemakers or defibrillators and cardiac MDCT in- volves radiation exposure. Therefore, 3D echocardiography might be more suitable for clinical practice. As CMR and car- diac MDCT still have limited temporal resolutions, compared with echocardiography, the 3D echocardiography is consid- ered a promising imaging technique for accurate measurement of the aortic root geometry and for assessment of the aortic root dynamics. Many comparison studies between 3D echo- cardiography and either CMR or cardiac MDCT showed that 3D TTE was valuable for evaluating the geometry of cardiac chambers.7-9) In the present study, we validated the accuracy of 3D TTE for quantifying the aortic root geometry in compari- son with cardiac MDCT.
For a true understanding of anatomic and pathologic struc- tures, the interpretation of 2D echocardiographic images re- quires a complex mental integration of multiple planes. Three- dimensional echocardiography allows direct calculation of volumes and is more accurate and closer to the real world than 2D echocardiography, relying on geometric assumption.14) Three-dimensional volumetric quantification of the aortic root may also give information closer to reality than geometric as- sumption. Using MPR method, volumetric quantification of the aortic root is quite simple and accurate and may be easily applied in clinical settings.
There are several limitations to the present study. Firstly, using the MDCT, we could not record any data of the end-sys- tolic volume of the aortic root, due to limitation of the imag- ing acquisition protocol. Thus, in the present study, we validat- ed the aortic root volumetric quantification only at end-diastole.
Second, we manually corrected the contour of the aortic root in this study, because the accuracy of automatic measurements was questionable in many cases. Manual correction may in-
clude the possibility of researcher bias. Further development of specialized software for automatic measurements might be needed for the accurate and feasible assessment of the aortic root volume. Third, we could not validate the volumetric mea- surements of the geometry of the aorta beyond the sinotubular junction. Since the aortic valve disease usually changes the ge- ometry of the aorta, the accurate assessment of aorta geometry may also be necessary for understanding the aortic disease.
Advancement of software, which could accurately measure both the volume and dynamics of the aorta, including the aor- tic root, would be necessary for the reliable clinical application of 3D TTE volumetric quantification in aortic valve disease.
Fourth, we excluded from our study the patients with any pathologic findings that could affect the aortic root geometry.
Therefore, the results of the study could not be applied to the whole population including the diseased population. A pro- spective study including the diseased population might be needed for clinical application of 3D echocardiographic quan- tification of aortic root geometry.
Our results demonstrated both the feasibility and the accu- racy of 3D TTE for the volumetric assessment of aortic root geometry. The MPR method has been already validated for the assessment of the ejection fraction and LV volumes, and could be an effective tool for volumetric quantification of the aortic root. Thus, the volumetric assessment of the aortic root geometry by 3D TTE could be the new method for under- standing the aortic root geometry.
References
1. Nkomo VT, Gardin JM, Skelton TN, Gottdiener JS, Scott CG, En- riquez-Sarano M. Burden of valvular heart diseases: a population-based study. Lancet 2006;368:1005-11.
2. Anderson RH, Lal M, Ho SY. Anatomy of the aortic root with particular emphasis on options for its surgical enlargement. J Heart Valve Dis 1996;5 Suppl 3:S249-57.
3. Lansac E, Lim HS, Shomura Y, Lim KH, Rice NT, Goetz W, Acar C, Duran CM. A four-dimensional study of the aortic root dynamics. Eur J Cardiothorac Surg 2002;22:497-503.
4. Tops LF, Wood DA, Delgado V, Schuijf JD, Mayo JR, Pasupati S, Lamers FP, van der Wall EE, Schalij MJ, Webb JG, Bax JJ. Nonin- vasive evaluation of the aortic root with multislice computed tomography im- plications for transcatheter aortic valve replacement. JACC Cardiovasc Im- aging 2008;1:321-30.
5. Cheng A, Dagum P, Miller DC. Aortic root dynamics and surgery: from craft to science. Philos Trans R Soc Lond B Biol Sci 2007;362:1407-19.
6. Akhtar M, Tuzcu EM, Kapadia SR, Svensson LG, Greenberg RK, Roselli EE, Halliburton S, Kurra V, Schoenhagen P, Sola S. Aortic Table 2. Relation of the aortic root and the coronary arteries
Variables MDCT 3DE p value
Distance between the annulus and the ostium of the left coronary artery (mm) 12.5 ± 1.3 12.4 ± 1.6 0.947 Distance between the annulus and the ostium of the right coronary artery (mm) 13.0 ± 1.8 12.8 ± 1.6 0.378 Distance between the annulus and the sinus of Valsalva (mm) 13.8 ± 1.8 13.5 ± 1.6 0.094 MDCT: multidetector computed tomography, 3DE: three-dimensional echocardiography
root morphology in patients undergoing percutaneous aortic valve replacement:
evidence of aortic root remodeling. J Thorac Cardiovasc Surg 2009;137:
950-6.
7. Gopal AS, Keller AM, Rigling R, King DL Jr, King DL. Left ven- tricular volume and endocardial surface area by three-dimensional echocar- diography: comparison with two-dimensional echocardiography and nuclear magnetic resonance imaging in normal subjects. J Am Coll Cardiol 1993;22:258-70.
8. Ota T, Kisslo J, von Ramm OT, Yoshikawa J. Real-time, volumetric echocardiography: usefulness of volumetric scanning for the assessment of car- diac volume and function. J Cardiol 2001;37 Suppl 1:93-101.
9. Ota T, Fleishman CE, Strub M, Stetten G, Ohazama CJ, von Ramm OT, Kisslo J. Real-time, three-dimensional echocardiography: feasibility of dynamic right ventricular volume measurement with saline contrast. Am
Heart J 1999;137:958-66.
10. Bland JM, Altman DG. Statistical methods for assessing agreement be- tween two methods of clinical measurement. Lancet 1986;1:307-10.
11. Lansac E, Lim HS, Shomura Y, Lim KH, Rice NT, Goetz WA, Du- ran CM. Aortic root dynamics are asymmetric. J Heart Valve Dis 2005;
14:400-7.
12. Rankin JS, Dalley AF, Crooke PS, Anderson RH. A ‘hemispherical’
model of aortic valvar geometry. J Heart Valve Dis 2008;17:179-86.
13. Delgado V, Schuijf JD, Bax JJ. Pre-operative aortic valve implantation evaluation: multimodality imaging. EuroIntervention 2010;6 Suppl G:
G38-47.
14. Binder T. Three-dimensional echocardiography: principles and promises. J Clin Basic Cardiol 2002;5:149-52.