84 책임저자:강주섭, 133-791, 서울시 성동구 행당동 17
한양대학교 의과대학 약리학교실 Tel: 02-2220-0652, Fax: 02-2292-6686 E-mail: [email protected]
접수일:2007년 5월 11일, 게재승인일:2007년 6월 1일
Correspondence to:Ju Seop Kang
Department of Pharmacology and Institute of Biomedical Sciences, College of Medicine, Hanyang University, Seoul 133-791, Korea Tel: +82-2-2220-0652, Fax: +82-2-2292-6686
E-mail: [email protected]
Pharmacokinetic and Bioequivalence Studies of Azelastine in Korean Healthy Volunteers using
Validated LC-MS/MS Method
Jin Hee Park1, Yoo Sin Park1, Ok Hwa Jhee2, Min Ho Lee3, Duck-An Kim4, Leslie M. Shaw5 and Ju Seop Kang1
1Department of Pharmacology and Institute of Biomedical Sciences, College of Medicine, Department of Bioengineering, College of Engineering, Hanyang University, Seoul,
2Department of Practical Arts Education, Gongju National University of Education, Gongju,
3Department of Internal Medicine, 4Laboratory Medicine, College of Medicine, Hanyang University, Seoul, Korea,
5Department of Pathology and Lab Medicine, College of Medicine, University of Pennsylvania, Philadelphia, PA, USA
The pharmacokinetic (PK) and bioequivalence (BE) studies of two formulations of azelastine (AZ) was carried out in 18 healthy male Korean volunteers according to a randomized crossover-design and were performed by a new validated liquid chromatography coupled to tandem mass spectrometry (LC-MS/MS) method for quantitative analysis of plasma AZ. Subjects were given single dose of 2 tablets of 1 mg AZ of each formulation with 240 ml of water to subjects on 2 treatment days separated by one week washout period. After dosing, serial blood samples were collected for a period of 96 hours. AZ and the clomipramine (IS) were separated using a mobile phase of acetonitrile-5 mM NH4AC (8:2, v/v, pH=6.4) with flow rate of 0.25 ml/min over Luna C18 column. Analysis required 0.2 ml of plasma and involved a solid extraction with an Oasis HLB cartridge by on-line clean-up extraction automation system and then directly injected into HPLC with an API 3000 MS system by multiple reactions monitoring (MRM) mode. Several PK parameters (including AUC0-t, AUC0-infinity, Cmax, Tmax, T1/2 and Ke) were determined from the plasma concentration of AZ of both formulations. The AUC and Cmax was tested for BE after log-transformation of the data. The ionization was optimized using ESI (+) and selectivity was achieved by MS-MS analysis, m/z 112.0 and m/z 86.1 for AZ and IS, respectively. The calibration curves with r2>0.999 were linear over a working range of 20∼2000 pg/ml. No endogenous compounds were found to interfere with the analysis. The inter- and intra-day accuracy was in the ranges of 89.9∼109.3% and precision of inter- and intra-day expressed as relative standard deviation were 2.73∼8.79 %. No significant difference was found based on ANOVA; 90% confidance intervals (91.77∼101.94% for AUC0-t; 90.44∼
106.27% for AUC0-infinity; 92.22∼108.57% for Cmax) for the test and reference drugs were found within FDA guideline of 80∼125%. Based on these statistical considerations, it was concluded that test drug was bioequivalent to the reference drug and therefore, may be interchangeably in the management of allergic or bronchial asthma and prophylaxis of mucositis due to cancer chemoradiotherapy. This validated method was found to be good performance on PK and BE studies for AZ. (Cancer Prev Res 12, 84-91, 2007)
Key Words: Pharmacokinetics, Bioequivalence, Azelastine, LC-MS/MS
INTRODUCTION
Azelastine hydrochloride, 4-[4-chlorophenyl]-methyl]-hexahy-
dro-1-methyl-1H-azepin-4-yl)-1(2H)-phthalzinone hydrochlori- de (AZ, Fig. 1) is a long-acting antiallergic and antiasthmatic agents that possesses H1 receptor-blocking activity and anta- gonism of the chemical mediators like as adenosine, leukotri-
Fig. 1. Chemical structure of (A) AZ (azelastine HCl, MW=
418.4, 4-(4-chlorobenzyl)-2-(hexa-hydro-1-methyl-1H-azepine- 4-yl)-1(2H)-phthalazinone hydrochloride) and (B) IS (clomipra- mine HCl, MW=351.31, 3-chloro-10,11-dihydro-N,N-dimethyl- 5H-dibenz [b,f] azepine-5-propanamine hydrochloride).
ene, endothelin-1 and platelet activation factor, and inhibition of the generation and/or release of chemical mediators, and su- peroxide-free radicals.1,2) AZ prevents bronchoconstriction in- duced by these mediators and attenuates exercise-induced bronchoconstriction.3,4) AZ has been developed as an asthma prophylactic and antiallergic drug and effective orally or nasally with long duration of action in adults and children.5,6) AZ has corticosteroid-sparing effects that reduce the need for inhaled corticosteroids in asthma patients and not lead to deterioration in pulmonary function.7) Topical application of steroidal or non- steroidal anti-inflammatory drugs is most common treatment for radiation injury of the skin, but the results are not always satisfactory in terms of response, local toxicity, and patient com pliance.8) Application of azelastine reduces the degree of acute radiation dermatitis without affecting the antitumor effect of radiation therapy in mice tumor models.9) The therapeutic doses of AZ recommended are 4.4 mg b.i.d. and 2.2 mg b.i.d.
as tablets for bronchial asthma in adults and in children, respectively. For the treatment of allergic rhinitis, AZ 2.2 mg b.i.d. as tablets or 0.14 mg puff per nostril b.i.d. as nasal spray is recommended.
Following oral dose of film-coated tablets, rapid and good absorption of AZ was found. The bioanalytical determinations of plasma concentrations carried out with a radioimmunoassay (RIA), detects AZ and its metabolite N-demethyl-AZ, one of major metabolite after multiple dosing. Pharmacokinetic para- meters of AZ after single dose with multiple dosing or different doses showed different characteristics in the young and elderly groups.10,11) Plasma AZ and its metabolites concentrations me- asured by the RIA showed a rough time course in most of the subjects and pronounced inter- and intra-individual variations after a single dose as well as multiple doses. Until now, quan-
tificative method for AZ and several its metabolite in biological matrix was performed by RIA,10,11) HPLC-fluorescence detec- tion,12,13) and HPLC-mass spectrometry (MS)14) or electrokinetic capillary chromatography and HPLC-MS/MS.15) Most of these methods have long run times for sample preparation or analytic processes and low sensitivity as like lower limit of quantifi- cation (LLOQ) of several hundreds pg/ml and have limitation for assess accurate pharmacokinetics of AZ. In the present study, a new formulation of AZ was evaluated with respect to PK and BE test by comparing PK parameters such as AUC0-t, AUC0-infinity, Cmax, Tmax, T1/2 and Ke based on plasma AZ con- centration-time plots achieved by new sensitive and validated HPLC-MS/MS method for quantitative analysis of plasma AZ concentrations after a single oral administration of 2 tablets of 1 mg AZ formulations.
METHODS AND MATERIALS 1. Chemicals and reagents
AZ and clomipramine (IS, Fig. 1) were obtained from Think Chemical LTD (Hangzhou, China) and Sigma Co. (St. Louis, MO, USA), respectively. Acetonitrile, HPLC grade methanol and ammonium acetate were purchased from Sigma Co. (St.
Louis, MO, USA). Other agent and solvents used were of the commercial by available analytical grade. The water was purified using a Milli-Q system (Millipore Co. USA). Reference drug (AzeptinTM, Bukwang Pharm Co. South Korea) and test drug (AzelonTM, Korea United Pharma Co. South Korea) containing 1 mg AZ per tablet was used in this study.
2. Stock solutions and standards
Stock solutions and AZ and IS were prepared with 50%
methanol solution to a final concentration of 1.0 mg/ml and stored at 20oC. A set of eight non-zero calibration standards, ranging 20 to 2,000 pg/ml was prepared by spiking the blank drug-free human plasma with an appropriate amount of AZ.
The quality control (QC) samples at five concentration levels (20ㆍ50ㆍ100ㆍ1,000 and 2,000 pg/ml) were prepared in a similar manner to the calibration standards. Blank human plasma was tested before spiking to ensure that no endogenous interference was found at retention times of AZ and IS.
3. Preparation for plasma samples
An 0.2-ml aliquot of human plasma was pipetted into a
Fig. 2. Full-scan mass spec- tra of the (A) precursor ions and (B) product ions of (1) AZ and (2) IS.
screw cap glass tube. Then, 0.02 ml of standard solution of IS (20 ng/ml) and 0.02 ml of phosphate buffer was added and vortex- mixed. After centrifugation at 4000 rpm for 5 min, 0.02 ml of upper layer was injected into solid phase extraction cartridge (SPE, OasisTM HLB 10×1.0 mm, 30μm Prospekt-2 cartridge, Waters Co., Milford, MA, USA) after condition with methanol and automatic extraction system (Symbiosis Pharma, SparkHolland, analysis method Report). Final analysis was car- ried out by LC with MS/MS detection.
4. LC-MS/MS conditions and quantifications
The LC system used was a SYMBIOSISTM Pharma system (SPARK Holland, Inc., Emmen, Netherlands) chromatograph equipped with an isocratic pump, reliance autosampler (HTC PAL system, CTC analytics AG, Switzerland) and Peak Simple LC Data System with Analyst 1.4 (Lab Alliance Co., State College, PA, USA) with Analyst 1.4. MS analysis was perfor- med using an API 3000TM mass spectrometer system (Applied
Biosystems/MDS SCIEX, Foster City, CA, USA) that was equipped with a turbo ion spray (ESI, 5500.0 V) interface operating in the positive ion mode with a cross-flow counter electrode. This system was set to MRM mode that is, selecting parent ions dissociating them and finally analyzing the daughter selective ions reaching great selectivity and sensitivity of this mode for mass analysis and detection. The analytical column was a Luna C18 Phenyl-Hexyl column (2.1×50 mm, 5μm;
Waters Co. Milford, MA, USA). The mobile phase consisted of acetonitrile and 5 mM ammonium acetate (8:2, v/v, pH 6.4). The flow rate was 0.25 ml/min with the injection volume of 20μl. The dwell time was set at 2.0 sec, and the probe temperature was set at 350oC with ultra-high-purity nitrogen as the curtain gas (11.0 L/min) and collision gas (8.0 L/min).
A full-scan positive ion spectrum showed that the precursor ions were the protonated molecules, [M+H]+, of m/z 382.2 for AZ and m/z 315.1 for IS (Fig. 2). After collision-induced dis- sociation, the most abundant ion in the product ion mass spect- rum was at m/z 315.1→112.0 for AZ at a collision energy of 36.0 eV, and m/z 315.1→ 86.1 for IS at a collision energy of 29.0 eV for the identification and quantification in MRM.
The strongest fragment of each compound was selected and used as Q3 ion to be monitored. Unit resolution was used for both Q1 and Q3 mass detection. The ion source parameters were set as follows; nebulizer gas=10.0 p.s.i., curtain gas=11.0 p.s.i., collision gas=8.0 p.s.i., ion spray voltage=5,500 V, temperature=350oC, ion source=6,500 cc/min. No significant interferences at the retention times of AZ or IS were observed in the MS chromatograms of blank plasma under the aforementioned LC-MS/MS conditions.
5. Assay validation
Calibration curves were based on peak area ratios of AZ to IS for seven calibration standards over the range of 20∼2,000 pg/
ml for AZ in human plasma analyzed in duplicate. Linearity was determined to assess the performance of the method. Line- ar least-squares regression with a weighting index of 1/x2 was performed on the peak area ratios of AZ/IS versus AZ nominal concentrations of the seven plasma standards (20 (LLOQ), 50, 100, 200, 500, 1,000 and 2,000 pg/ml) to generate a cali- bration curve. Accuracy and precision were based on assay of six replicates of QC samples analyzed on 5 different days and calculated using one-way ANOVA.
6. PK and BE studies in healthy volunteers
We used most common statistical design for comparing two formulations that is a randomized, standard 2×2 crossover design16) with one week washout period in 18 healthy male volunteers for assessment of bioequivalence between test and reference formulations of AZ. AZ was given to healthy male volunteers after having obtained their informed consents before enrollment to participate to the study. Participants had not taken medications (including over-the-counter) 2 weeks prior to or during the study period. The study was performed according to the revised Declaration of Helsinki17) for biome- dical research involving human subjects and the rules of Good Clinical Practice (GCP). Subjects were informed of the aims and risks of the study by the clinical investigator; based on this, they provided written informed consent before participating in the study. In addition, the Institutional Review Board (IRB) of Hanyang University Medical Center approved the protocol prior to the start of the study. Eighteen volunteers aged bet- ween 19 and 27 years (22.1±2.0 years), with body weight between 57.0 and 85.0 kg (69.6±6.9 kg) and with height between 169.0 and 187.0 cm (177.9±6.2 cm) were included in this study with a 1-week washout period between periods.
The participants were non-alcoholic and free from diseases, assessed their health status by clinical evaluation such as phy- sical examination and the following laboratory tests; albumin, alkaline phosphatase, ALT, AST, blood glucose, creatinine, blood urea nitrogen, total cholesterol, protein, total bilirubin, hemoglobin, hematocrit, total and differential white cell counts, routine urinalysis. During each period, the volunteers were hospitalized to the clinical pharmacokinetic laboratory in Han- yang University Medical Center at 18:00 pm and had an evening meal before 20:00 pm. After an overnight fasting, they received two tablets of 1 mg AZ formulation of test or reference drugs at 7:00 am along with 240 ml of water.
Subjects were then in the seated position for at least 1 h and then fast for 4 h. A standard lunch and evening meal were provided at 4 and 10 h after dosing. Liquid consumption was allowed ad libitum after lunch except liquid that contains xanthine and acidic beverages including tea, coffee and cola.
At 0 and 1.5, 5, 12, 24, 48, 72 and 96 h after dose, blood pressure, heart rate and body temperature were recorded. Blood samples (8 ml) were withdrawn by indwelling catheter into heparin-containing tubes from a suitable antecubital vein before
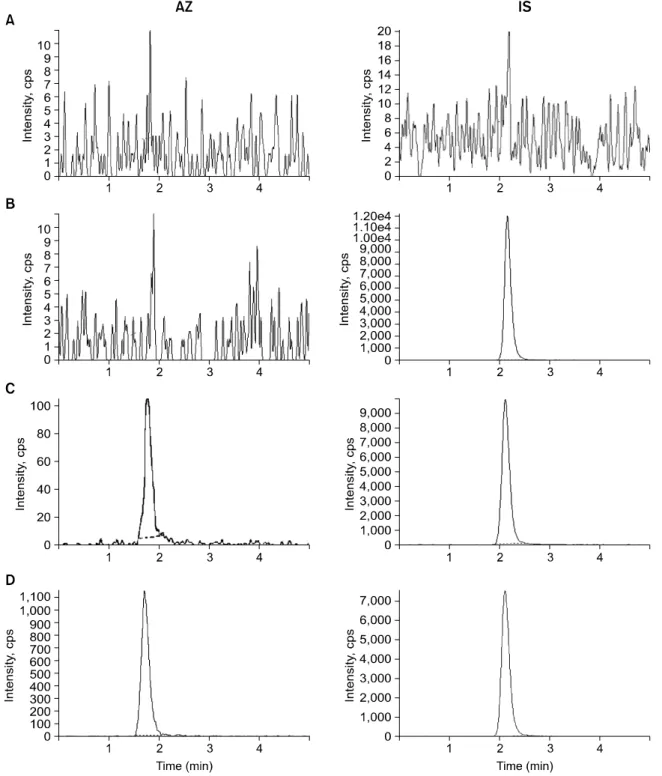
Fig. 3. Chromatograms of (A) blank plasma, (B) with IS (20 ng/ml), (C) with AZ (20 pg/ml) and IS (20 ng/ml), and (D) human plasma taken 6 h after single oral administration of 2 tablets of 1 mg AZ spiked with IS (20 ng/ml).
and at 0.5, 1, 2, 4, 6, 10, 24, 48, 72 and 96 h after dosing.
The blood samples were centrifuged at 2,500χg for 10 min at room temperature and plasma was stored at 70oC until analysis. The total plasma AZ concentrations were anayzed and the maximal concentration (Cmax) and time for maximal con- centrations (Tmax) were determined by visual inspection from
each subject’s plasma concentration versus time plots for AZ.
The area under the plasma concentration versus time curve (AUC0-t) was calculated by the linear trapezoidal rule from 0 to 96 h. The AUC extrapolated to infinity (AUC0-infinity) was calculated as AUC0-t+Ct/Ke, where Ct is the last measurable concentration and the elimination constant (Ke) was obtained
Table 1. Precision and accuracy of the method for analysis of AZ in human plasma, n=5
Precision (CV%) Accuracy (CV%)
Nominal
concentration (pg/ml)
Intra-day Inter-day Intra-day Inter-day
20 (LLOQ) 8.750 8.785 93.5 109.3
50 6.272 6.268 89.9 107.1
100 6.179 6.994 101.7 97.6
1000 6.710 4.349 95.0 101.0
2000 6.235 2.728 96.4 99.9
LLOQ: lower limit of quantification, CV: coefficient of variation.
Fig. 4. Profiles of mean (±S.D.) plasma concentrations versus time for both AZ (reference vs test) formulations following single oral administration of 2 tablets of 1 mg AZ in 18 healthy male volunteers.
Table 2. 90% confidence interval for AUCt, AUCinfinityand Cmax
of AZ after a single dose of 2 tablets of 1 mg AZT in 18 male healthy subjects
Pharmacokinetic parameters
AUCt AUC0-infinity Cmax
90% CI 91.77∼101.94 90.44∼106.27 92.22∼108.57 AUC: area under plasma concentration-time curve, Cmax: maximal plasma concentration, AZ: azelastine.
from the least square fitted terminal log-linear portion of the plasma concentration versus time profile.18∼21) Plasma elimina- tion half-life (T1/2) was calculated as ln2/Ke.
RESULTS AND DISCUSSION 1. Separation
The molecular structures of AZ and IS were shown in the Fig. 1. The chromatograms of blank human plasma, blank plasma spiking with 20 ng/ml of IS, blank plasma spiking with 20 pg/ml (LLOQ) of calibration standard of AZ and 20 ng/ml of IS, and subject’s plasma of 6 hours after administration of 2 tablets of 1 mg of AZ is shown in Fig. 3. No significant interference around retention time of AZ (1.7 min) or IS (2.1 min) in the mass chromatogram of human blank plasma under LC-MS/MS conditions. Using MRM mode, the transitions m/z
382.2→112.0 and m/z 315.1→86.1 were used for quantifica- tion of AZ and IS, respectively. The most suitable collision energy were 36.0 eV for AZ and 29.0 eV for IS from each protonated compounds.
2. Method validation and linearity of calibration
As shown in Fig. 3A, no endogenous peaks were observed in the chromatogram of blank plasma. The chromatogram for standard sample at the LLOQ (20 pg/ml) is shown in Fig. 3B.
The retention times of AZ and IS were 1.7 and 2.1 min, respectively. The calibration curves showed good linearity within the range of 20 (LLOQ) to 2000 pg/ml. AZ: Y=
2.28×10⁴ㆍX+2.35×10³, r2=0.9999 (n=7). Here, Y repre- sents peak area ratio of AZ to IS, and X describes plasma concentration of AZ. As shown in Table 1, method allowed good precision and accuracy. The intra- and inter-day precisions were below 8.75 and 8.79%, respectively. The intra- and inter-day accuracies were below 101.7 and 109.3%, respecti- vely. The analytical calibration curves were constructed with 7 non-zero standards ranging from 20 to 2,000 pg/ml. Under the described analytical conditions, the lower limit quantification (LLOQ), defined as the lowest concentration at which both precision and accuracy were less than or equal to 20%,19) was
Table 3. Pharmacokinetic parameters (mean±S.D. of n=18) of 2 tablets of 1 mg AZ formulations based on plasma AZ conc- entrations
Parameters Reference Test
AUC0-t (pgㆍh/ml) 17679.75±3956.53 17244.64±4452.54
AUC0-infinity (pgㆍh/ml) 19427.72±4037.27 19820.62±3977.11
Extrapolation (%) 9.02±2.22 13.01±4.51
Cmax (pg/ml) 580.05±114.62 590.04±158.57
Tmax (h) 6.0 (4.0∼10.0) 6.0 (4.0∼6.0)
T1/2 (h) 23.42±5.95 26.44±6.92
Ke (h1) 0.0296±0.0036 0.0262±0.0042
AUC: area under plasma concentration-time curve, Cmax: maximal plasma concentration, Tmax: time for the maximal plasma concentration, T1/2: half-life, Ke: elimination rate constant, AZ: azelastine.
20 pg/ml.
3. Clinical application in healthy subjects
The proposed method was applied to the determination of AZ in plasma samples for the purpose of establishing the PK and BE of two tablets of 1 mg AZ in 18 healthy male volunteers. Typical plasma concentration versus time profiles is shown in Fig. 4.
The average plasma concentrations of AZ were in the standard curve range and remained above the LLOQ (20 pg/ml) for the entire sampling period. The PK parameters for the reference and test drug obtained were described as follows. For the BE assessment, a standard BE range for basic PK para- meters including AUC0-t and Cmax of 0.8∼1.25 has been generally accepted.22∼23) Table 2 shows the 90% confidence interval obtained by analysis of variance (ANOVA) for these parameters after log-transformation of the data. The geometric mean and respectively 90% confidence interval (CI) of test/
reference percent ratios were 100.0% (92.22∼108.57%) for Cmax, 96.7% (91.77∼101.94%) for AUC0-t and 94.6% (90.17
∼103.79%) for AUC0-infinity. Residing within the BE limit proposed by the FDA, 80∼125% for the ratio of product averages (Table 2). No differences between the reference and test drugs were detected (p-value greater than 0.05 for the formulation effect in all tested parameters).
The profiles of the plasma AZ concentration versus time after single oral administration of 2 tablets of 1 mg AZ of both formulations in 18 subjects exhibited closely similar patterns, which were nearly superimposable (Fig. 4). The PK parameters of 2 formulations were shown in Table 3. The mean (±SD) value of AUC (pgㆍh/ml) from time 0 to the last sampling
time (AUC0-96 h) was 17670.75 (±3956.53) for the reference and 17244.64 (±4452.54) for the test, and AUC from time 0 to infinity (AUC0-infinity) was 19427.72 (±4037.27) for the reference and 19820.62 (±3977.11) for the test. The mean (±SD) observed maximum plasma concentration (Cmax, pg/ml) that is independent to sampling time was 580.05 (±114.62) for the reference and 590.04 (±158.57) for the test. The me- dian time (range) to observed maximum plasma concentration (Tmax, h) was 6.0 (4.0∼10.0) for the reference and 6.0 (4.0∼
6.0) for the test, and elimination half-life (T1/2, h) was 23.42 (±5.95) for the reference and 26.44 (±6.92) for the test. After the oral administration of AZ, the Cmax and Tmax values were some different from those reported in the literature.9∼11) In conclusion, the method consisted of a simple, sensitive solid-phase extraction procedure and LC-MS/MS successfully applied to study for PK and BE studies of two types of 1 mg AZ formulations in healthy 18 male volunteers. The reference and test drugs can be considered bioequivalent from the obtained plasma AZ concentrations and their corresponding PK parameters and therefore, can be used interchangeably in clinical situations.
REFERENCES
1) Perhach JL, Chand N, Diamantis W, Sofia RD, Rosenberg A.
Azelastine: a novel oral antiasthma compound with several modes of action. In: eds, by Kad AB, Allergy and Asthma.
New Trends and Approaches to Therapy, Oxford, Lodon, Blackwell Scientific Publications, pp 230-248, 1989.
2) Szelenyi I. Phamacological profile of azelastine. Drug Today 25, 3-8, 1989.
3) Magnussen H, Reuss G, Jorres R, Aurich R. The effect of azelastine-induced asthma. Chest 93, 937-940, 1988.
4) Motojima S, Ohashi Y, Otsuka T, Fukuda T, Makino S.
Effects of azelastine on allergen- and exercise-induced asthma.
Asian Pac J Allergy Immunol 3, 174-178, 1985.
5) Rafferty P, Harrison PJ, Aurich R, Holgate ST. The in vivo potency and selectivity of azelastine as an H1 histamine- receptor antagonist in human airway and skin. J Allergy Clin Immunol 82, 1113-1118, 1988.
6) Kemp JP, Meltzer EO, Orgel HA, Welch MJ, Bucholtz GA, Middleton E Jr, Spector SL, Newton JJ, Perhach JL Jr. A dose-response study of the bronchodilator action of azelastine in asthma. J Allergy Clin Immunol 79, 893-899, 1987.
7) Busse WW, Middleton E, Storms W, Dockhorns RJ, Chu TJ, Grossman J, Weiler JM, Bronsky EA, Mansfield LE, Bell TD, Hemsworth GR, Perhach JL, D’Eletto TA, Dam A. Cortico- steroid-sparing effect of azelastine in the management of bronchial asthma. Am J Respir Crit Care Med 153, 122-127, 1996.
8) Barkham AM. Radiotherapy skin reactions and treatments.
Professional Nurse 8, 732-736, 1993.
9) Murakami R, Baba Y, Nishimura R, Furusawa M, Yokoyama T, Yamashita Y, Takahahi M, Yamashita N, Ono T. The effect of azelastine on acute radiation dermatitis in mice mo- dels. Int J Radiation Oncology Biol Phys 37, 907-911, 1997.
10) Peter G, Romeis P, Borbe HO, Buker KM, Reithmuller- Winzen H. Tolerability and pharmacokinetics of single and multiple doses of azelastine hydrochloride in elderly volun- teers. Arzeimittelforschung 45, 576-581, 1995.
11) Reithmuller-Winzen H, Peter G, Bucker KM, Romeis P, Borbe HO. Tolerability, pharmacokinetics and dose linearity of azelastine hydrochloride in healthy subjects. Arzneimittel- forschung 44, 1136-1140, 1994.
12) Pivonaka J, Segelman FH, Hartman CA, Segl WE, Ku- charczyk N, Sofia RD. Determination of azelastine and desmethylazelastine in human plasma hy high-performance liquid chromatography. J Chromatogr 420, 89-98, 1987.
13) Langevin CN, Pivonka J, Wichmann JK, Kucharczyk N, Sofia RD. High performance liquid chromatographic determination
of azelastine and desmethylazelastine in guinea pig plasma and lung tissue. Biomed Chromatogr 7, 7-11, 1993.
14) Mano N, Oda Y, Ohe H, Asakawa N, Yoshida Y, Sato T.
Resolution of 4-(4-chlorobenzyl)-2-(hexahydro-1-methyl-1H- azepin-4yl)-1(2H)-phthalazinone enantiomers in plasma with frit-FAB LC-MS using a conalbumin column. J Pharm Biomed Anal 12, 557-567, 1994.
15) Heinemann U, Blaschke G, Knebel N. Simultaneous ena- ntioselective separation of azelastine and three of its meta- bolites for the investigation of the enantiomeric metabolism in rats. I. Liquid chroamtograpgy-ionspray tandem mass spec- trometry and electrokinetic capillary chromatography. J Chro- matogr B 793, 389-404, 2003.
16) Chow SS, Liu JP. Design and analysis of bioavailability and bioequivalence studies. New York, Marcel Dekker, INC., 1992.
17) Hyder AA, Human D, Crawley F, IJesselmuiden C, Singer PA, Benatar SR. Revised Declaration of Helsinki. BMJ 203, 283, 2001.
18) Shargel I, Yu-Pong S, Yu A. Applied biopharmaceutics and pharmacokinetics: 15. Bioavailability and bioequivalence. 5th Ed. New York, McGraw Hill, 2005.
19) Chen M, Shah V, Patnaik R, Adams W, Hussain A, Conner D, Mehta M, Malinowski H, Lazor J, Huang S, Hare D, Lesko L, Sporn D, Williams R. Bioavailability and bioe- quivalence: an FDA regulatory overview. Pharm Res 18, 1645-1650, 2001.
20) FDA guidance for industry. Bioanalytical method validation, CDER, CVM, 2001.
21) Summit Research Services, PK solutions 2.0. Noncomparmen- tal pharmacokinetics data analysis software. Montrose, USA, 2006.
22) FDA guidlance for industry. Statistical approaches to esta- blishing bioequivalence, USDHHS, CDER, CVM, 2001.
23) Federal register part 320, Bioavailability and bioequivalence requirements. 67, 1, 2002.