ORIGINAL ARTICLE
만성 B형간염, 비알코올성 지방간 질환 환자에서 혈청 Asialo-α1-acid Glycoprotein의 진행성 간섬유화, 간경변증 예측력 연구
김승업1,2,3, 전미영1,3, 임태섭1,3
연세대학교 의과대학 내과학교실1, 소화기병 연구소2, 세브란스병원 연세간센터3
Diagnostic Performance of Serum Asialo-α1-acid Glycoprotein for Advanced Liver Fibrosis or Cirrhosis in Patients with Chronic Hepatitis B or Nonalcoholic Fatty Liver Disease
Seung Up Kim1,2,3, Mi Young Jeon1,3 and Tae Seop Lim1,3
Department of Internal Medicine1, Institute of Gastroenterology2, Yonsei University College of Medicine; Yonsei Liver Center, Severance Hospital3, Seoul, Korea
Background/Aims: The utility of asialo-α1-acid glycoprotein (AsAGP) for assessing the fibrotic burden is unknown. This study ex- amined the diagnostic performance of the AsAGP level for advanced liver fibrosis or cirrhosis in patients with chronic hepatitis B (CHB) or nonalcoholic fatty liver disease (NAFLD).
Methods: From July to December 2018, 48 patients with CHB and 75 with NAFLD were recruited prospectively. Transient elastog- raphy was used as the reference standard for liver fibrosis, and the cutoff liver stiffness values were defined as 10.0 kilopascal (kPa) for ≥F3 and 12.0 kPa for F4 in CHB patients, and 9.0 kPa for ≥F3 and 11.8 kPa for F4 in NAFLD patients.
Results: To predict stage ≥F3 and F4 fibrosis, the areas under the receiver operating characteristic curves of the AsAGP level in patients with CHB were 0.788 (95% CI 0.647-0.930; p=0.005) and 0.825 (95% CI 0.674-0.976; p=0.004), respectively. The cut- off AsAGP levels in patients with CHB that maximized the sum of the sensitivity and specificity values were 1.31 (sensitivity 100.0%, specificity 52.6%) and 1.55 (sensitivity 75.0%, specificity 80.0%), respectively. In contrast, the AsAGP level was similar regardless of the fibrosis stage in patients with NAFLD (all p>0.05 between the stages).
Conclusions: The AsAGP level showed acceptable diagnostic accuracy in predicting advanced liver fibrosis and cirrhosis in pa- tients with CHB but not in those with NAFLD. Further studies will be needed to validate the diagnostic performance of the AsAGP level in patients with NALFD. (Korean J Gastroenterol 2019;74:341-348)
Key Words: Fibrosis; Hepatitis B; Non-alcoholic fatty liver disease; Liver cirrhosis
Received April 26, 2019. Revised July 9, 2019. Accepted August 13, 2019.
CC This is an open access article distributed under the terms of the Creative Commons Attribution Non-Commercial License (http://creativecommons.org/licenses/
by-nc/4.0) which permits unrestricted non-commercial use, distribution, and reproduction in any medium, provided the original work is properly cited.
Copyright © 2019. Korean Society of Gastroenterology.
교신저자: 김승업, 03722, 서울시 서대문구 연세로 50-1, 연세대학교 의과대학 내과학교실
Correspondence to: Seung Up Kim, Department of Internal Medicine, Yonsei University College of Medicine, 50-1 Yonsei-ro, Seodaemun-gu, Seoul 03722, Korea.
Tel: +82-2-2228-1944, Fax: +82-2-393-6884, E-mail: [email protected], ORCID: https://orcid.org/0000-0002-9658-8050
Financial support: This study was supported by Diagen Inc. The funders had no role in study design, data collection and analysis, decision to publish, or manuscript preparation.
Conflict of interest: None.
INTRODUCTION
An accurate assessment of the severity of liver fibrosis in patients with chronic hepatitis B (CHB) is essential not only
for predicting the long-term clinical course but also for de- termining if and when to begin antiviral therapy. The most recent guidelines on the management of CHB propose that the presence of significant fibrosis and detectable HBV DNA
indicate the need for antiviral therapy because the main- tenance of viral suppression can reduce the incidence of liv- er-related complications, including hepatocellular carcinoma (HCC), in patients with CHB who have significant fibrosis or cirrhosis.1-3
Among the categories of nonalcoholic fatty liver disease (NAFLD), nonalcoholic steatohepatitis (NASH) is the most pro- gressive and severe condition.4 NASH is defined as steatosis in the presence of hepatocyte damage, inflammation, and/or subsequent scarring and a replacement of tissue with type I collagen. In contrast to the benign prognosis of simple stea- tosis, approximately 10-29% of patients with NASH develop cirrhosis within 10 years, which is often followed by liver-re- lated complications, including HCC.5 Therefore, similar to CHB, the assessment of fibrosis progression in patients with NAFLD is important for identifying those at high risk and determining the optimal time to commence medical interventions.
Thus far, liver biopsy is the gold standard for assessing liver fibrosis, but it has disadvantages, such as invasiveness, cost, risk of complications, lack of available expert practi- tioners, and intra/interobserver variability.6 A recent study re- ported that the serum asialo-α1-acid glycoprotein (desialylated α1-acid glycoprotein; AsAGP) level is elevated in patients with liver diseases compared to healthy controls.7 In addition, the AsAGP level showed acceptable diagnostic accuracy for liver cirrhosis and HCC.8 On the other hand, its ability to predict the fibrotic burden in patients with chronic liver diseases is not known. Therefore, this study examined the diagnostic per- formance of the AsAGP level for the fibrotic burden, as assessed by transient elastography (TE, FibroScan®; EchoSens, Paris, France), in patients with CHB or NAFLD.
SUBJECTS AND METHODS
1. Patients
Patients with CHB and NALFD, who underwent TE (FibroScan®; EchoSens) at Yonsei Liver Center, Severance Hospital, Yonsei University College of Medicine, Seoul, South Korea, from July 2018 to December 2018 were recruited into this prospective study. CHB was defined as the presence of the serum HBV surface antigen for >6 months.9 NAFLD was defined as a controlled attenuation parameter (CAP) value
>250 dB/m, as assessed by TE (FibroScan®; EchoSens), which indicates the presence of fat in the liver after excluding
the secondary causes of fat accumulation in the liver, such as significant alcohol consumption.10
The exclusion criteria were as follows: 1) age <19 years, 2) alcohol ingestion in excess of 40 g/day for >5 years, 3) malignancy, 4) an ALT level >5×the upper limit of normal, 5) total bilirubin level >2.0 mg/dL, 6) HCV infection, 7) TE (FibroScan®; EchoSens) failure or invalid liver stiffness (LS) values, 8) heart failure, 9) ascites, 10) pregnancy, 11) decom- pensated liver diseases, 12) refusal to provide informed con- sent, and 13) deviations from the protocol.
The study was conducted in accordance with the ethical guidelines of the 1975 Declaration of Helsinki. Written in- formed consent was obtained from each participant or re- sponsible family member. The Institutional Review Board of Severance Hospital approved the study (2018-0483-001).
2. Recruitment information
Initially, this prospective clinical trial assessed the diag- nostic accuracy of AsAGP in patients with HBV and NAFLD using the LS values determined using TE (FibroScan®; EchoSens) as the gold standard. The calculated sample size of each fibrosis stage from F0 to F4 was 21 (105 each for HBV and NAFLD; 210 in total). On the other hand, this clinical trial was terminated earlier than expected because of the de- layed enrollment beyond the planned study period, which led to a final sample size of 123 (48 with HBV and 75 with NAFLD).
3. Assessment of LS by TE (FibroScan®; EchoSens) LS was assessed by TE (FibroScan®; EchoSens), which re- lies on a calculation of the liver elasticity from the velocity of a low-frequency elastic wave transmitted through the liver, has good diagnostic accuracy for advanced fibrosis or cir- rhosis in patients with various chronic liver diseases, including CHB and NAFLD.11,12 Therefore, the LS values determined by TE (FibroScan®; EchoSens) were used as a reference.
A well-trained technician, who was blinded to the patients’
clinical and laboratory data, performed TE (FibroScan®; EchoSens). Details of the technique and examination proce- dure are reported elsewhere.13-20 The results are expressed in kilopascal (kPa). The interquartile range is an index of the intrinsic variability among the LS values and corresponds to the range of LS values encompassing 50% of the valid meas- urements (i.e., between the 25th and 75th percentiles). The
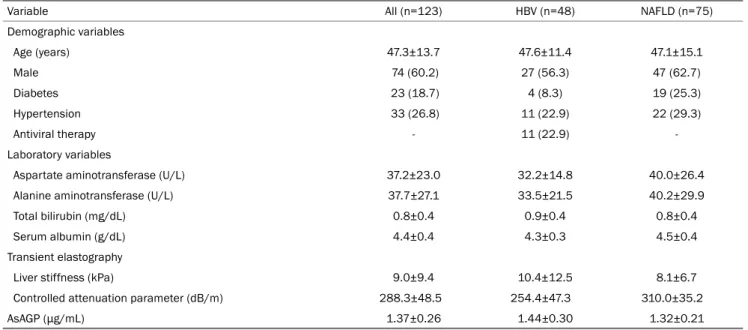
Table 1. Baseline Characteristics of the Study Population
Variable All (n=123) HBV (n=48) NAFLD (n=75)
Demographic variables
Age (years) 47.3±13.7 47.6±11.4 47.1±15.1
Male 74 (60.2) 27 (56.3) 47 (62.7)
Diabetes 23 (18.7) 4 (8.3) 19 (25.3)
Hypertension 33 (26.8) 11 (22.9) 22 (29.3)
Antiviral therapy - 11 (22.9) -
Laboratory variables
Aspartate aminotransferase (U/L) 37.2±23.0 32.2±14.8 40.0±26.4
Alanine aminotransferase (U/L) 37.7±27.1 33.5±21.5 40.2±29.9
Total bilirubin (mg/dL) 0.8±0.4 0.9±0.4 0.8±0.4
Serum albumin (g/dL) 4.4±0.4 4.3±0.3 4.5±0.4
Transient elastography
Liver stiffness (kPa) 9.0±9.4 10.4±12.5 8.1±6.7
Controlled attenuation parameter (dB/m) 288.3±48.5 254.4±47.3 310.0±35.2
AsAGP (μg/mL) 1.37±0.26 1.44±0.30 1.32±0.21
Values are presented as mean±standard deviation or n (%).
HBV, hepatitis B virus; NAFLD, nonalcoholic fatty liver disease; kPa, kilopascal; AsAGP, asialo-α1-acid glycoprotein.
median value was considered representative of the elastic modulus of the liver. Only procedures with at least 10 valid measurements, a success rate of at least 60%, and a ratio of the interquartile range to median <30% were considered reliable.
4. Grading of fibrosis stage according to LS and fib- rosis-4 index
The fibrosis stage was determined based on the estab- lished cutoff LS values (10.0 kPa for ≥F3 and 12.0 kPa for F4 in patients with CHB; 9.0 kPa for ≥F3 and 11.8 kPa for F4 in patients with NAFLD).21,22 To validate the results based on the LS value, the fibrosis-4 index was also calculated using the following formula: age (years)×AST (U/L)/[platelets (109/L)×ALT (U/L)]1/2. The fibrosis-4 index ≥2.67 indicated a high probability of advanced fibrosis.23
5. Measurement of the serum AsAGP level
The serum AsAGP level was measured by an antibody-lectin sandwich immunoassay using an AceGP® ELISA kit (Diagen Inc., Seoul, Korea), as described previously.8
6. Statistical analyses
The data are expressed as the mean±standard deviation,
median (range), or number (%), where appropriate. When comparing the baseline characteristics between the two groups, a chi-squared test and a Fisher’s exact test were used for the categorical variables, and a Student's t-test and a Mann-Whitney U-test was used for the continuous variables.
The correlation between AsAGP and other continuous varia- bles was assessed using Pearson’s correlation. The diagnostic performance of the noninvasive indices was assessed using the receiver operating characteristic (ROC) curves and the areas under the ROC curves (AUCs). The cutoff values that maximized the sum of the sensitivity and specificity were cal- culated from the ROC curves. Multivariable binary logistic re- gression was used to identify the independent predictors of advanced fibrosis or cirrhosis. Statistical analyses were per- formed using SAS software version 9.1.3 (SAS institute, Cary, NC, USA). A p-value <0.05 was considered significant.
RESULTS
1. Baseline characteristics of the study population This study screened 131 patients (49 with CHB and 82 with NAFLD) for inclusion. After exclusion of eight patients, the remaining 123 (48 with CHB and 75 with NAFLD) were analyzed. Table 1 lists the baseline characteristics of the study population. The mean age of the study population (74
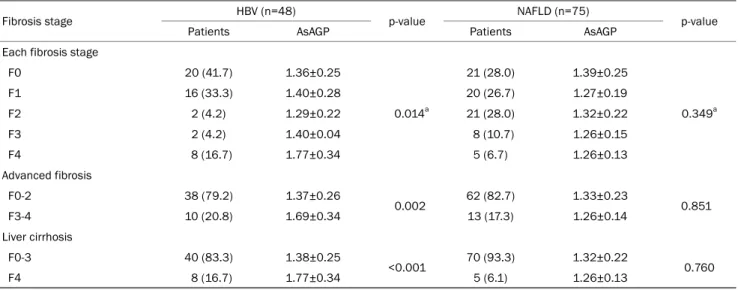
Table 3. Distribution of Liver Stiffness-based Fibrosis Stage and Corresponding AsAGP Level
Fibrosis stage HBV (n=48)
p-value NAFLD (n=75)
p-value
Patients AsAGP Patients AsAGP
Each fibrosis stage
F0 20 (41.7) 1.36±0.25
0.014a
21 (28.0) 1.39±0.25
0.349a
F1 16 (33.3) 1.40±0.28 20 (26.7) 1.27±0.19
F2 2 (4.2) 1.29±0.22 21 (28.0) 1.32±0.22
F3 2 (4.2) 1.40±0.04 8 (10.7) 1.26±0.15
F4 8 (16.7) 1.77±0.34 5 (6.7) 1.26±0.13
Advanced fibrosis
F0-2 38 (79.2) 1.37±0.26
0.002 62 (82.7) 1.33±0.23
0.851
F3-4 10 (20.8) 1.69±0.34 13 (17.3) 1.26±0.14
Liver cirrhosis
F0-3 40 (83.3) 1.38±0.25
<0.001 70 (93.3) 1.32±0.22
0.760
F4 8 (16.7) 1.77±0.34 5 (6.1) 1.26±0.13
Values are presented as mean±standard deviation or n (%).
AsAGP, asialo-α1-acid glycoprotein; HBV, hepatitis B virus; NAFLD, nonalcoholic fatty liver disease.
aOne-way analysis of variance test.
Table 2. Correlation between the AsAGP, Liver Stiffness, and Other Variables
Variable AsAGP Liver stiffness
Correlation coefficient p-value Correlation coefficient p-value
Age (years) 0.176 0.052 0.130 0.150
Aspartate aminotransferase (U/L) -0.006 0.946 0.419 <0.001
Alanine aminotransferase (U/L) -0.124 0.179 0.305 0.001
Total bilirubin (mg/dL) 0.146 0.111 0.180 0.049
Serum albumin (g/dL) -0.207 0.024 -0.114 0.216
Liver stiffness (kPa) 0.124 0.170 - -
Controlled attenuation parameter (dB/m) -0.291 <0.001 0.075 0.412
AsAGP (μg/mL) - - 0.124 0.170
kPa, kilopascal; AsAGP, asialo-α1-acid glycoprotein.
males and 49 females) was 47.3 years. Diabetes and hyper- tension were identified in 23 (18.7%) and 33 (26.8%) pa- tients, respectively. The mean AST and ALT levels were 37.2 and 37.7 U/L, respectively. The mean LS and CAP values were 9.0 kPa and 288.3 dB/m, respectively. The mean AsAGP level was 1.37 μg/mL. The mean AsAGP levels of the patients with HBV and those with NAFLD were 1.44 and 1.32 μg/mL, respectively. Among the patients with HBV, 11 (22.9%) were receiving antiviral therapy.
2. Correlations among the AsAGP level, LS, and other variables
Table 2 lists the correlations among the AsAGP level, LS, and other variables. The AsAGP level showed a significant neg- ative correlation with the serum albumin level (r=-0.207, p=0.024) and CAP value (r=-0.291, p<0.001). LS showed a significant positive correlation with the AST level (r=0.419), ALT level (r=0.305), and total bilirubin level (r=0.180) (all p<0.05). On the other hand, the LS did not correlate sig- nificantly with the AsAGP level (p=0.170).
3. Distributions of the LS-based fibrosis stage and corresponding AsAGP level
Table 3 lists the distributions of the LS-based fibrosis stage
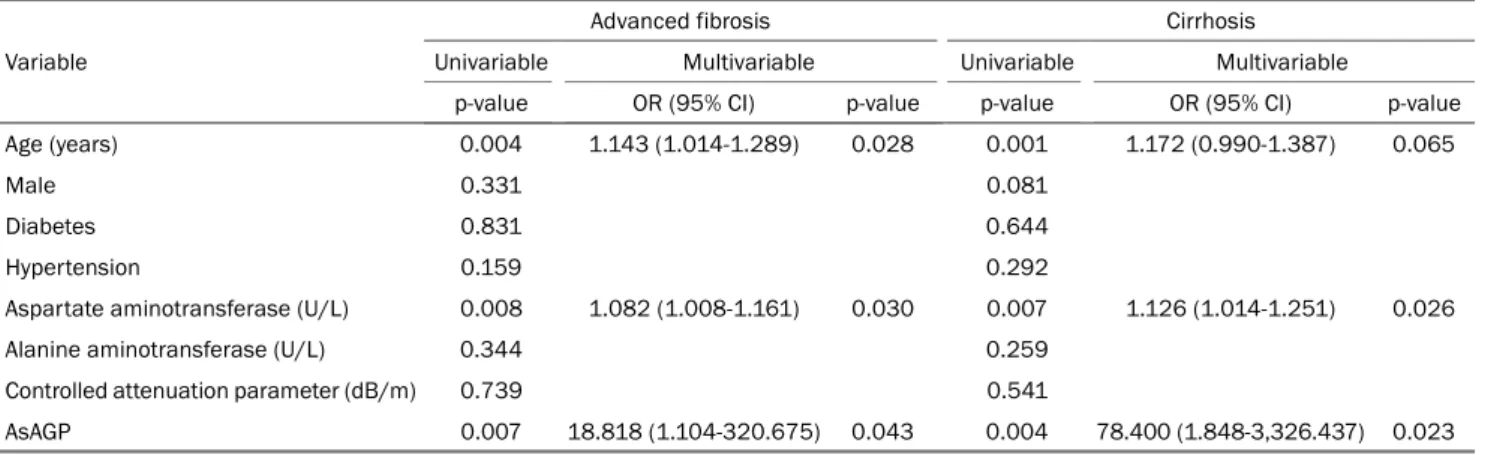
Table 4. Predictors of Advanced Fibrosis Stage (F3-4) and Cirrhosis (F4) in Patients with HBV Variable
Advanced fibrosis Cirrhosis
Univariable Multivariable Univariable Multivariable
p-value OR (95% CI) p-value p-value OR (95% CI) p-value
Age (years) 0.004 1.143 (1.014-1.289) 0.028 0.001 1.172 (0.990-1.387) 0.065
Male 0.331 0.081
Diabetes 0.831 0.644
Hypertension 0.159 0.292
Aspartate aminotransferase (U/L) 0.008 1.082 (1.008-1.161) 0.030 0.007 1.126 (1.014-1.251) 0.026
Alanine aminotransferase (U/L) 0.344 0.259
Controlled attenuation parameter (dB/m) 0.739 0.541
AsAGP 0.007 18.818 (1.104-320.675) 0.043 0.004 78.400 (1.848-3,326.437) 0.023
HBV, hepatitis B virus; OR, odds ratio; CI, confidence interval; AsAGP, asialo-α1-acid glycoprotein.
Table 5. Diagnostic Accuracy of AsAGP to Predict Liver Stiffness-based Advanced Fibrosis Stage (F3-4) and Cirrhosis (F4) in Patients with HBV
Diagnostic index F3-4 F4
AUC 0.788 0.825
95% CI 0.647-0.930 0.674-0.976
p-value 0.005 0.004
Cutoff value 1.31 1.55
Sensitivity 100.0% 75.0%
Specificity 52.6% 80.0%
AsAGP, asialo-α1-acid glycoprotein; HBV, hepatitis B virus; AUC, area under curve; CI, confidence interval.
and corresponding AsAGP level. Among the 48 patients with CHB, the mean AsAGP level increased with increasing fibrosis stage (1.36 μg/mL for F0 [n=20, 41.7%], 1.40 μg/mL for F1 [n=16, 33.3%], 1.29 μg/mL for F2 [n=2, 4.2%], 1.40 μg/mL for F3 [n=2, 4.2%], and 1.77 μg/mL for F4 [n=8, 16.7%];
p=0.014 by one-way ANOVA). The mean AsAGP level of the patients with stage F0-2 (n=38, 79.2%) or F0-3 (n=40, 83.3%) fibrosis was significantly lower than that of the patients with F3-4 (n=10, 20.8%) (1.37 vs. 1.69 μg/mL, p=0.002) or F4 (n=8, 16.7%) fibrosis (1.38 vs. 1.77 μg/mL; p<0.001).
Among the 75 patients with NAFLD, 21 (28.0%), 20 (26.7%), 21 (28.0%), 8 (10.7%), and 5 (6.7%) had F0, F1, F2, F3, and F4 fibrosis, respectively. The AsAGP level did not differ significantly according to the fibrosis stage (mean AsAGP 1.26-1.39) (p=0.349 by one-way ANOVA). No significant differ- ence in the AsAGP level was observed between the patients with F0-2 (n=62, 82.7%) or F3-4 (n=13, 17.3%) fibrosis and those with F0-3 (n=70, 93.3%) or F4 (n=5, 6.1%) fibrosis (all p>0.05).
4. Independent predictors of advanced fibrosis and cir- rhosis
Table 4 lists the results of univariable and subsequent multi- variable analysis. Older age (OR=1.143; 95% CI 1.014-1.289;
p=0.028), higher AST level (OR=1.082; 95% CI 1.008-1.161;
p=0.030), and higher AsAGP level (OR=18.818; 95% CI 1.104-320.675; p=0.043) were selected as independent pre- dictors of advanced fibrosis (F3-4), whereas a higher AST level (OR=1.126; 95% CI 1.014-1.251; p=0.007) and higher AsAGP level (OR=78.400; 95% CI 1.848-3,326.437; p=0.023) were selected as independent predictors of cirrhosis (F4).
5. Diagnostic performance of AsAGP for LS-based ad- vanced fibrosis and cirrhosis
The ability of the AsAGP level to predict LS-based advanced fibrosis and cirrhosis in patients with CHB was next evaluated (Table 5). The AUCs for the AsAGP level for predicting LS- based advanced fibrosis and cirrhosis was 0.788 (95% CI 0.647-0.930, p=0.005) and 0.825 (95% CI 0.674-0.976, p=0.004), respectively. The cutoff values that maximized the
sum of the sensitivity and specificity were 1.31 for advanced fibrosis (sensitivity 100% and specificity 52.6%) and 1.55 for cirrhosis (sensitivity 75.0% and specificity 80.0%). When the fibrosis-4 index was used to define the fibrotic burden in the subgroup with the availability of the fibrosis-4 index value (n=21 with HBV), the AUC value to predict the advanced fib- rosis stage was 0.947 (95% CI 0.847-1.000; p=0.042).
DISCUSSION
Several noninvasive surrogates, such as TE (FibroScan®; EchoSens), FibroTest (Biopredictive, Paris, France), and en- hanced liver fibrosis, have been proposed to assess the de- gree of liver fibrosis. On the other hand, the patency and high cost of the device have limited their widespread use in clinical practice. Recently, altered glycosylation of plasma glyco- proteins has been reported in various liver pathologies.24 For example, increased AGP fucosylation in the ascitic fluid of patients with cirrhosis,24,25 haptoglobin fucosylation in pa- tients with alcoholic liver disease,26,27 serum cholinesterase fucosylation in patients with cirrhosis,28,29 fucosylation of α-fetoprotein and other serum glycoproteins in patients with HCC,30,31 and serum AsAGP in patients with cirrhosis and HCC7,8 have been reported.
In this study, the AsAGP level was not associated with the AST or ALT level. Furthermore, the AsAGP level increased sig- nificantly with the fibrosis stage in patients with CHB but not in those with NAFLD. In addition, the AsAGP level showed ac- ceptable diagnostic performance for advanced fibrosis and cirrhosis. To the best of the authors’ knowledge, this is the first study to assess the diagnostic performance of AsAGP and define the optimal cutoff values for advanced fibrosis and cirrhosis in a homogenous population of Asian patients with CHB.
These findings have several clinical implications. First, pa- tients who underwent AsAGP testing and an LS-based fibrosis assessment, which shows excellent diagnostic performance in Asian patients with CHB, were recruited prospectively as a reference.11 In addition, the optimal cutoff AsAGP levels for advanced fibrosis and cirrhosis for patients with CHB were proposed. Although validation studies will be needed, the pro- posed cutoff values can be used as a reference in future studies involving Asian patients with CHB. Second, the diag- nostic performance of AsAGP was acceptable (AUCs of 0.788
for advanced fibrosis and 0.825 for cirrhosis), despite the relatively small population. Future studies involving more pa- tients will be needed to validate these results. Third, the mean AsAGP level increased with increasing liver fibrosis stage.
Although longitudinal validation will be required, these results suggest that the AsAGP level can be used to trace the changes in the fibrotic burden in patients with CHB. Fourth, in contrast to LS, which can be overestimated in the presence of hepatic necroinflammation or congestion,32 the AsAGP level was not correlated significantly with the AST or ALT level (p>0.05).
On the other hand, patients with a higher ALT level (>5×up- per limit of normal) were excluded to maintain the diagnostic accuracy of TE (FibroScan®; EchoSens) in assessing the fi- brotic burden as the gold standard, but further validation will be needed to confirm the lack of a correlation between AsAGP and high ALT levels. Fourth, although the exact reason is un- clear, several issues, such as an unbalanced distribution of fibrosis stage and early termination of trial leading to a rela- tively small sample size, might potentially be associated with the negative results in patients with NAFLD. Well-designed studies will be needed to solve this issue.
This study had several limitations. First, although the partic- ipants were recruited prospectively, the study was limited by its cross-sectional design. Therefore, it is unclear if repeated measurements of the AsAGP level would enable tracking of the progression of fibrosis and related clinical outcomes, such as the occurrence of hepatic decompensation and HCC.
Therefore, the prognostic value of AsAGP should be evaluated.
Second, the distribution of the fibrosis stage was skewed be- cause of the relatively small sample size and recruitment from a tertiary hospital, possibly resulting in spectrum bias. Third, the AsAGP level was not correlated significantly with the fi- brotic burden in patients with NAFLD. Because the diagnostic performance of a given noninvasive test tends to increase with the prevalence of higher-stage fibrosis, a study involving more patients with advanced fibrosis or cirrhosis will be needed. Fourth, the use of antivirals and hepatotonics was permitted. On the other hand, this probably did not influence the results because the LS measured by TE (FibroScan®; EchoSens) represents the remaining fibrotic burden in the liv- er at a particular point in time. Finally, the LS value assessed using TE (FibroScan®; EchoSens), not liver biopsy, was used as the gold standard for assessing the fibrotic burden in this study. Thus, these results should be interpreted cautiously.
In conclusion, the AsAGP level predicted advanced fibrosis or cirrhosis acceptably in Asian patients with CHB but not in those with NAFLD. The proposed optimal cutoff AsAGP level for patients with CHB may have utility as a reference in future research. Further largescale studies will be needed to validate the results.
REFERENCES
1. Lok AS, McMahon BJ. Chronic hepatitis B. Hepatology 2007;
45:507-539.
2. Degertekin B, Lok AS. Indications for therapy in hepatitis B.
Hepatology 2009;49(5 Suppl):S129-S137.
3. Liaw YF, Sung JJ, Chow WC, et al. Lamivudine for patients with chronic hepatitis B and advanced liver disease. N Engl J Med 2004;351:1521-1531.
4. Lee YH, Kim SU, Song K, et al. Sarcopenia is associated with sig- nificant liver fibrosis independently of obesity and insulin resist- ance in nonalcoholic fatty liver disease: nationwide surveys (KNHANES 2008-2011). Hepatology 2016;63:776-786.
5. Fan JG, Kim SU, Wong VW. New trends on obesity and NAFLD in Asia. J Hepatol 2017;67:862-873.
6. Poynard T, Halfon P, Castera L, et al. Variability of the area under the receiver operating characteristic curves in the diagnostic evaluation of liver fibrosis markers: impact of biopsy length and fragmentation. Aliment Pharmacol Ther 2007;25:733-739.
7. Song EY, Kim KA, Kim YD, et al. Elevation of serum asialo-al- pha(1) acid glycoprotein concentration in patients with hepatic cirrhosis and hepatocellular carcinoma as measured by anti- body-lectin sandwich assay. Hepatol Res 2003;26:311-317.
8. Kim KA, Lee EY, Kang JH, et al. Diagnostic accuracy of serum asia- lo-alpha1-acid glycoprotein concentration for the differential di- agnosis of liver cirrhosis and hepatocellular carcinoma. Clin Chim Acta 2006;369:46-51.
9. Jung KS, Kim SU, Ahn SH, et al. Risk assessment of hepatitis B virus-related hepatocellular carcinoma development using liver stiffness measurement (FibroScan). Hepatology 2011;53:
885-894.
10. Jung KS, Kim BK, Kim SU, et al. Factors affecting the accuracy of controlled attenuation parameter (CAP) in assessing hepatic steatosis in patients with chronic liver disease. PLoS One 2014;9:e98689.
11. Chon YE, Choi EH, Song KJ, et al. Performance of transient elas- tography for the staging of liver fibrosis in patients with chronic hepatitis B: a meta-analysis. PLoS One 2012;7:e44930.
12. Karlas T, Petroff D, Sasso M, et al. Individual patient data meta-analysis of controlled attenuation parameter (CAP) tech- nology for assessing steatosis. J Hepatol 2017;66:1022-1030.
13. Kim DS, Jeon MY, Lee HW, et al. Influence of hepatic steatosis on the outcomes of patients with chronic hepatitis B treated with en- tecavir and tenofovir. Clin Mol Hepatol 2019;25:283-293.
14. Ferro Y, Carè I, Mazza E, et al. Protein and vitamin B6 intake are associated with liver steatosis assessed by transient elastog- raphy, especially in obese individuals. Clin Mol Hepatol
2017;23:249-259.
15. Jeon MY, Lee HW, Kim SU, et al. Feasibility of dynamic risk pre- diction for hepatocellular carcinoma development in patients with chronic hepatitis B. Liver Int 2018;38:676-686.
16. Kim BS, Seo YS, Kim YS, et al. Reduced risk of hepatocellular car- cinoma by achieving a subcirrhotic liver stiffness through anti- viral agents in hepatitis B virus-related advanced fibrosis or cirrhosis. J Gastroenterol Hepatol 2018;33:503-510.
17. Jeon MY, Lee HW, Kim SU, et al. Subcirrhotic liver stiffness by FibroScan correlates with lower risk of hepatocellular carcinoma in patients with HBV-related cirrhosis. Hepatol Int 2017;11:
268-276.
18. Yo IK, Kwon OS, Park JW, et al. The factors associated with longi- tudinal changes in liver stiffness in patients with chronic hep- atitis B. Clin Mol Hepatol 2015;21:32-40.
19. Kim HS, Kim BK, Kim SU, et al. Association between level of fib- rosis, rather than antiviral regimen, and outcomes of patients with chronic hepatitis B. Clin Gastroenterol Hepatol 2016;14:
1647-1656.e6.
20. You SC, Kim KJ, Kim SU, et al. Hepatic fibrosis assessed using tran- sient elastography independently associated with coronary ar- tery calcification. J Gastroenterol Hepatol 2015;30:1536-1542.
21. Kim SU, Kim JK, Park YN, Han KH. Discordance between liver bi- opsy and Fibroscan® in assessing liver fibrosis in chronic hep- atitis B: risk factors and influence of necroinflammation. PLoS One 2012;7:e32233.
22. Kumar R, Rastogi A, Sharma MK, et al. Liver stiffness measure- ments in patients with different stages of nonalcoholic fatty liver disease: diagnostic performance and clinicopathological correlation. Dig Dis Sci 2013;58:265-274.
23. Shah AG, Lydecker A, Murray K, et al. Comparison of noninvasive markers of fibrosis in patients with nonalcoholic fatty liver disease. Clin Gastroenterol Hepatol 2009;7:1104-1112.
24. Turner GA. N-glycosylation of serum proteins in disease and its investigation using lectins. Clin Chim Acta 1992;208:149-171.
25. Biou D, Wieruszeski JM, Konan D, Fournet B, Durand G.
Hyperfucosylation of alpha 1-acid glycoprotein during cirrhosis.
Prog Clin Biol Res 1989;300:215-218.
26. Thompson S, Matta KL, Turner GA. Changes in fucose metabo- lism associated with heavy drinking and smoking: a preliminary report. Clin Chim Acta 1991;201:59-64.
27. Mann AC, Record CO, Self CH, Turner GA. Monosaccharide com- position of haptoglobin in liver diseases and alcohol abuse: large changes in glycosylation associated with alcoholic liver disease.
Clin Chim Acta 1994;227:69-78.
28. Kondo M, Hada T, Fukui K, Iwasaki A, Higashino K, Yasukawa K.
Enzyme-linked immunosorbent assay (ELISA) for Aleuria aur- antia lectin-reactive serum cholinesterase to differentiate liver cirrhosis and chronic hepatitis. Clin Chim Acta 1995;243:1-9.
29. Hada T, Kondo M, Yasukawa K, Amuro Y, Higashino K.
Discrimination of liver cirrhosis from chronic hepatitis by meas- uring the ratio of Aleuria aurantia lectin-reactive serum chol- inesterase to immunoreactive protein. Clin Chim Acta 1999;
281:37-46.
30. Naitoh A, Aoyagi Y, Asakura H. Highly enhanced fucosylation of serum glycoproteins in patients with hepatocellular carcinoma.
J Gastroenterol Hepatol 1999;14:436-445.
31. Aoyagi Y, Saitoh A, Suzuki Y, et al. Fucosylation index of alpha-feto- protein, a possible aid in the early recognition of hepatocellular carcinoma in patients with cirrhosis. Hepatology 1993;17:50-52.
32. Kim SU, Han KH, Park JY, et al. Liver stiffness measurement using FibroScan is influenced by serum total bilirubin in acute hepatitis. Liver Int 2009;29:810-815.