• 검색 결과가 없습니다.

The Impact of Capital Structure on Firm Performance: Evidence from Pakistan

N/A
N/A
Protected

Academic year: 2021

Share "The Impact of Capital Structure on Firm Performance: Evidence from Pakistan"

Copied!
8
0
0

로드 중.... (전체 텍스트 보기)

전체 글

(1)

Abstract

Purpose – The purpose of this study is to empirically inves - tigate the impact of capital structure on firm performance.

Research design, data, and methodology – This study exam - ined the impact of capital structure on the performance of ce- ment companies listed on the Karachi Stock Exchange during the period 2009-2013. The authors hypothesize that there is a negative relationship between capital structure and firm performance. To examine the association, the authors run a Pearson correlation and multiple regression analysis.

Results – Results reveal a strong negative relationship be - tween debt to asset and firm performance variables (GPM, NPM, ROA, and ROE). Further, there is a positive relationship between debt to equity and firm performance variables (GPM and NPM), anda negative relationship between debt to equity and firm performance variables (ROA and ROE). Moreover, cap- ital structure variables significantly impact firm performance.

Conclusions – This study concluded that financial analysts and managers should emphasize on the optimal level of capital structure and efficient utilization and allocation of resources to achieve the targeted level of productive efficiency in business.

Keywords: Capital Structure, Firm Performance, Cement Industry, Pakistan.

JEL Classifications: G1, G3.

* The authors are thankful to the Managing Editor Myoung Kil Youn and the three anonymous reviewers for their helpful comments and suggestions that have substantially improved the article.

** Corresponding Author, Research Scholar, Department of Management Sciences, Hazara University Mansehra, Pakistan. Tel:

+92-33-3850-8159. E-mail: [email protected].

*** Chairman, Department of Management Sciences, Hazara University Mansehra, Pakistan.

**** Research Scholar, Department of Management Sciences, Hazara University Mansehra, Pakistan.

1. Introduction:

Capital structure plays a vital role in financial decision making process, maximizing the firm’s performance and its value. The term capital structure is the mix of different securities issued by firm to finance its operations. These mixes of different financing methods issued by firm are called firm’s capital structure. Saad (2010) argue that in financial term capital structure means the way a firm finance their assets through the mix of equity, debt or hybrid securities. Similarly, capital structure is used to signify the proportionate relationship between debt and equity.

The origin of capital structure theory begins from Modigliani &

Miller (1958), capital structure theories operates under perfect market. They argue that under various assumptions of perfect capital market, such as investors, homogenous expectations, no taxes, no transaction costs, and efficient market, capital struc- ture is irrelevant in determining firm’s value. Therefore, Modigliani & Miller (MM) theorem is famous for "Theory of ir- relevance" of capital structure and reveals that capital structure is independent of firm performance.

The expansions of capital structure theory relax some as- sumptions of the original MM theory of irrelevance. MM (1963) 1 & Miller (1977) 2 publish articles relax the assumptions that there is no personal and corporate taxes. They conclude that firms are encouraged to use debt in their capital structure, be- cause tax regulation allows firms to deduct debt interest pay- ments as an expense. Similarly, tax deductibility of interest pay- ment protects the pre-tax income of the firm and eventually low- ers the weighted average cost of capital. However, the extent literature is full of theories on capital structure since the seminal work of MM.

The main focus of this study is that no prior research work was done in Pakistani market on the impact of capital structure decisions on firm performance in the Cement Industry, which is considered capital intensive industry where optimal capital struc- ture decisions are primary to the firm performance. The current study uses two measures of capital structure including debt to assets and debt to equity.

1.1. Debt to Assets

The debt to assets ratio measures the percentage of funds Print ISSN: 2233-4165 / Online ISSN: 2233-5382

doi: http://dx.doi.org/10.13106/jidb.2014.vol5.no2.13.

The Impact of Capital Structure on Firm Performance: Evidence from Pakistan*

2)
Hussain Muhammad**, Bahadar Shah***, Zia ul Islam****

Received: March 19, 2014. Revised: April 08, 2014. Accepted: May 07, 2014.

(2)

provided by creditors (Brigham & Houston, 2011). It also refers to the percentage of all assets that are financed by debt (Fraser & Ormiston, 1998).

Debt to Assets = Total Liabilities / Total Assets 1.2. Debt to Equity

The debt to equity ratio measures the riskiness of the com- pany’s capital structure in terms of the relationship between the funds supplied by creditors (Fraser & Ormiston, 1998).

Debt to Equity = Total Liabilities / Total Shareholder’s Equity

2. Firm Performance:

Performance concept is a contentious matter in finance most- ly due to its multidimensional meanings. Murphy, Trailer, & Hill, (1996) argue that research on firm performance originates from strategic management and organization theory. Chakravarthy (1986) demonstrates that performance is measures either organ- izational or financial. The core of the firm’s effectiveness is fi- nancial performance such as profit maximization, maximizing profit on assets, and maximizing shareholder’s benefits.

Sandberg & Hoffer (1987) evaluate that operational performance measures, such as growth in market share and sales give a broad meaning of performance that focus on the factors that fi- nally direct to financial performance. Therefore, financial perform- ance is considered a major standard to measure a company operational and financial efficiency. The current study uses four measures of performance including gross profit margin, net profit margin, return on assets and return on equity.

2.1. Gross Profit Margin

Gross Profit Margin shows the total increase between cost of goods sold and sales revenue. It also reflects the efficiency with which management produces each unit of product (Stapleton et al., 1981).

Gross Profit Margin = Sales – Cost of Goods Sold / Sales 2.2. Net Profit Margin

Net Profit Margin signifies the overall measure of a com- pany’s ability to turn each rupee/dollar sales into net profit. It al- so establishes relationship between sales and net profit. Further it indicates management’s efficiency in administering, manu- facturing and selling the products (Stapleton et al., 1981).

Net Profit Margin = Net Income / Sales 2.3. Return on Assets

Return on Assets or Investment is the estimated raise in the

cash flows produced by the operating cycle as a result of asset or investment outlays. It is the return for forsaking immediate spending (Vernimmen et al., 2005).

Return on Assets = Net Income / Total Assets 2.4. Return on Equity

Return on Equity is an accounting indicator of value creation and measures the profitability of equity invested in the business.

It is equal to net income dividing by shareholders equity (Vernimmen et al., 2005).

Return on Equity = Net Income / Shareholder’s Equity

3. Literature Review:

Based on literature review there is an abundance of research which intends to enlighten the relationship between capital struc- ture and firm performance, empirical evidence yields contra- dictory and inconsistent findings. Empirical results and argu- ments have gone both ways. Some researchers document that there is positive relationship between capital structure and firm performance, whereas others oppose by arguing that there is a negative effect on firm performance. For instance, Gleason et al.

(2000) reveal that firm’s capital structure has a significant and negative relationship with firm’s performance measured by return on assets (ROA) and profit margin in the European countries.

By contrast, Hadlock & James (2002) find a positive relationship between capital structure and firms performance. Further, they note that firms with high level of profitability use high level of debts. Similarly, Holz (2002) also show a positive relationship between capital structure and firms performance.

Deesomsak et al. (2004) report a negative relationship be- tween capital structure and firms performance measured by gross profit margin in the Malaysian firms. They indicate that in Singapore, Taiwan and Australian the relation of leverage with firm’s performance is negative but statistically insignificant.

Moreover, the effect of firm size on leverage is significant and positive for all the countries except Singapore, because in Singapore firms have government support and are less exposed to financial distress costs. On the same manner, Frank & Goyal (2004) also find a negative relationship between capital structure and firms performance by giving the predictions of pecking order theory in contrast to the off theory.

Abor (2005) investigate the relationship between capital struc- ture and profitability of listed firms on Ghana Stock Exchange.

He reveals a positive relationship between short term debt to to- tal assets and return on equity due to low interest rates.

Further, he suggests that in Ghanaian firm’s short term financing

shows 85 percent of total debt and is considered a main ele-

ment of financing for them. Moreover, a negative relationship

find between long term financing and equity returns, and a pos-

itive relation exists between total debt and profitability. He also

(3)

suggests that debt is considered as a major source of financing for high profitable firms.

Huang & Song (2006) find a negative relationship between capital structure measured by long term debt and total debt and performance measured by return on assets. They indicate that Chinese markets are, in developing phase for equity financing and firms should depend on debt capital from banks. However, Chinese most firms are state controlled and favor equity financ- ing rather than debt financing because they still hold the con- trolling interest and weak laws exist to keep shareholders rights.

Further, profitable firms use more debt and increase leverage due to increase in firm size.

Weill (2008) examines the relationship between financial lever- age and firm’s performance in seven European countries. He finds that in Spain and Italy financial leverage related sig- nificantly and positively with firms performance, while significantly and negatively in France, Norway, Germany and Belgium, but insignificantly in Portugal. Li Meng et al.(2008) also investigate that financial leverage has a negative relation with firm perform- ance measured by return on assets, but has a positive relation with return on equity.

Ebaid (2009) reveal that capital structure has a very weak re- lationship with performance on the emerging market economy of Egypt. He shows that capital structure measured by short term, long term and total debt to total assets related insignificantly with firm’s performance measured by return on equity. While short term debt and total debt to total assets related negatively and significantly with firms performance. Further, long term debt related negatively and insignificantly with performance measured by return on assets. Moreover, he also shows insignificant rela- tionship between capital structure and gross profit margin.

Nimalathasan & Brabete (2010) evaluate the relationship be- tween capital structure and profitability for listed manufacturing companies in Sri Lanka. They reveal that capital structure measured by debt to equity related positively and significantly with firms profitability measured by gross profit, operating profit and net profit margin.

San & Heng (2011) study the relationship between capital structure and performance of Malaysian Construction Industry in the financial crises of 2007-2008 that badly affect the econo- mies of Malaysia. They demonstrate a weak relationship exists between leverage and performance measured by return on as- sets and return on equity of Malaysian Construction Industry.

Further, Pratheepkanth (2011) find a negative relationship be- tween capital structure and financial performance of business companies in Sri Lanka during 2005-2009.

Khan (2012) shows the relationship of capital structure deci- sion with performance of 36 engineering firms in Pakistani mar- ket listed on Karachi Stock Exchange during 2003-2009. He finds a negative and significant relationship between financial leverage measured by short term debt to total assets (STDTA) and total debt to total assets (TDTA) and firm performance measured by return on assets (ROA), gross profit margin (GPM) and Tobin’s Q. By contrast, Taani (2013) examines the impact

of capital structure on performance of 12 commercial banks list- ed on Amman Stock Exchange during 2007-2011. He finds that bank performance measured by net profit, return on capital em- ployed and net interest margin related significantly and positively with total debt, whereas total debt is found insignificant with re- turn on equity in the banking industry of Jordan.

<Table 1> Summary Table for Literature Review

S# Year Authors Name Relationship b/w Capital Structure and Firm Performance 1 2000 Gleason, Mathur, &

Mathur Negative

2 2002 Hadlock & James Positive

3 2002 Holz Positive

4 2004 Deesomsak, Paudyal, & Pescetto Negative

5 2004 Frank & Goyal Negative

6 2005 Abor Both Positive & Negative

7 2006 Huang & Song Negative

8 2008 Weill Both Positive & Negative 9 2008 Meng et al Both Positive & Negative

10 2009 Ebaid Negative

11 2010 Nimalathasan &

Brabete Positive

12 2011 San & Heng Both Positive & Negative

13 2011 Pratheepkanth Negative

14 2012 Khan Negative

15 2013 Taani Positive

4. Objectives of the Study:

The present study is planned to accomplish the following ob- jectives;

To identify the nature of relationship between capital struc

y -

ture and firm performance.

y To investigate the impact of capital structure on firm performance.

5. Research Methodology:

The present study uses secondary data, because of the main

purpose is to empirically investigate the impact of capital struc-

ture on performance of cement companies in Pakistan listed on

Karachi Stock Exchange for the period 2009-2013. Secondary

data is defined as data that are already available i.e. it refer to

the data which have already been collected and analyzed by

someone else (Kothari, 2004). Secondary data are typically past

data and do not need access to subjects or respondents be-

cause it is already assembled. The current data is obtained

from the annual reports and financial statements of 25 cement

companies listed on Karachi Stock Exchange for the period

2009-2013.

(4)

5.1. Conceptual Framework

Empirical literature uses many variables in a capital structure choice which will affect a firm performance. Abor (2005 & 2007) and Ebaid (2009) used the three (Short term, long term and to- tal debt) to total assets as measures of capital structure. This study uses two of the most important measures of capital struc- ture i.e. debt to assets and debt to equity. Moreover, literature also uses a number of different measures of firm performance include accounting based measures calculated from firm financial statements such as GM, NM, ROA and ROE (Abor, 2005;

Meng et al., 2008; Ebaid, 2009). This study uses four account- ing based measures of performance include GPM, NPM, ROA and ROE. The figure 1 shows the conceptual framework of the study.

<Figure 1> Conceptual Framework

5.2. Hypothesis of the Study

Based on conceptual framework and previous studies this study formulates the following hypothesis.

H

1

: There is a negative relationship between debt to asset and firm performance variables (GPM, NPM, ROA and ROE).

H

2

:There is a negative relationship between debt to equity and firm performance variables (GPM, NPM, ROA and ROE).

H

3

: There is a significant impact of capital structure on firm performance.

6. Data Analysis:

For data analysis, this study uses descriptive statistics, corre- lation and regression analysis. Correlation analysis is used to find out the relationship between dependent and independent variables, whereas regression analysis is used to investigate the impact of capital structure on firm performance.

6.1. Descriptive Statistics

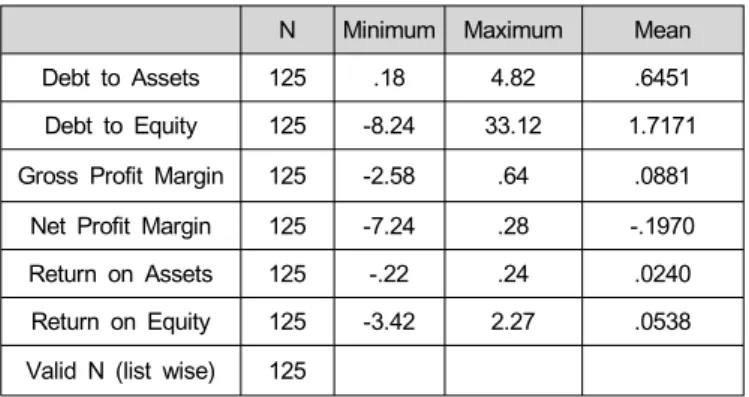
Table 2 reveals the summary of descriptive statistics for all dependent and independent variables of the study. The results of descriptive statistics indicate that mean of debt to assets for cement companies listed on Karachi Stock Exchange during 2009-2013 is 64.51%, whereas mean of debt to equity is 171.71%. It shows that about 64.51 percent of total assets of cement companies are financed by debt. Further the table shows that mean of gross profit margin, net profit margin, return on asset and return on equity are 8.81%, -19.7%, 2.4% and 5.38% respectively. These results indicate a poor performance by cement companies during 2009-2013.

<Table 2> Descriptive Statistics

N Minimum Maximum Mean

Debt to Assets 125 .18 4.82 .6451

Debt to Equity 125 -8.24 33.12 1.7171

Gross Profit Margin 125 -2.58 .64 .0881

Net Profit Margin 125 -7.24 .28 -.1970

Return on Assets 125 -.22 .24 .0240

Return on Equity 125 -3.42 2.27 .0538

Valid N (list wise) 125

6.2. Correlation Analysis

Correlation Analysis describes the strength of relationship be- tween two variables. This study uses Pearson Correlation Analysis to find out the relationship between dependent varia- bles (Debt to Asset & Debt to Equity) and independent varia- bles (GPM, NPM, ROA and ROE). The results reveal the amount of relationship exist between dependent and in- dependent variables.

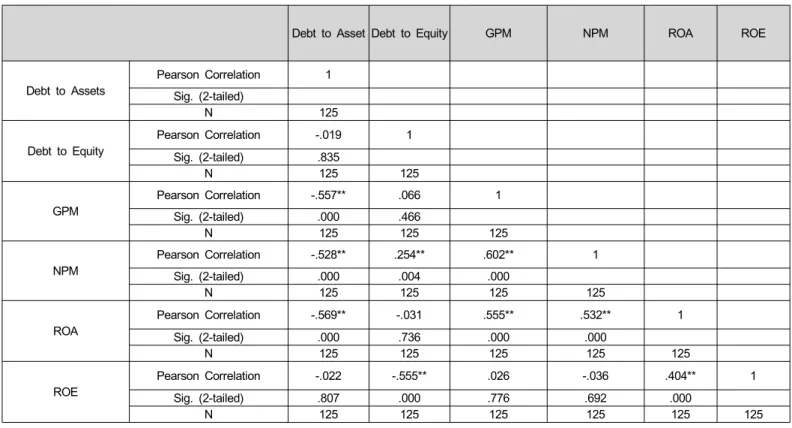
Table 3 shows a strong negative correlation between debt to asset and firmperformance variables, because R values of debt to asset and gross profit margin is -0.557**, debt to asset and net profit margin is -0.528**, debt to asset and return on asset is -0.569**, debt to asset and return on equity is -0.022. Further it reveals high significant relationship between all variables ex- cept debt to asset and return on equity.

Table 3 further indicates a positive relationship between firm-

performance variables (GPM & NPM) and debt to equity, where-

as negative relationship between (ROA &ROE) and debt to

equity. The R values of debt to equity and gross profit margin

is 0.066, debt to equity and net profit margin is 0.254**, debt to

equity and return on asset is -0.031, and debt to equity and re-

turn on equity is -0.555**.

(5)

<Table 3> Correlation Analysis

Based on above results hypothesis H1 is accepted because the results reveal a negative relationship between debt to asset and firm performance variables. Further, the relationship between debt to equity and firmperformance variables show different results. The relationship between debt to equity and firmperform- ance variables (GPM & NPM) is positive and research hypoth- esis H2 is rejected. Whereas the relationship between debt to equity and firm performance variables (ROA & ROE) is negative and the research hypothesis H2 is accepted.

6.3. Regression Analysis

Regression analysis is a statistical method to measure the impact of one (independent) variable on other (dependent) variable. Therefore, this study uses regression analysis to test the hypothesis H3 to measure the impact of capital structure on firm performance.

Table 4 indicates the regression analysis between dependent variable (debt to asset) and independent variables (GPM, NPM, ROA, and ROE). The beta coefficient shows that gross profit margin and return on asset significantly predict debt to asset when all variables included. It also indicates collinearity statistics where tolerance and VIF give the same information (Tolerance

= 1/VIF). If the tolerance value is low (< 1-R2), then there is probably a problem with multicollinearity. The tolerance value is 0.553 (1-R2) which shows no problem with multicollinearity.

The model summary reveal the correlation coefficient R, using

all the predictors simultaneously is 0.669, R2 = 0.447 and the adjusted R2is 0.429 that indicate 42.9% of the variance in debt to asset can be predicted from independent variables (GPM, NPM, ROA, and ROE), whereas the remaining 57.1% influenced by others which are not considered for this study. According to Cohen (1988), this is a large effect.

The table further uses Durbin Watson statistic to find out the existence of autocorrelation in the residuals. According to Al saeed (2006), if Durbin Watson values are between 1 and3, then there is no autocorrelation problem. As shown in table, Durbin Watson value is 2.131, which represent no autocorrela- tion problem in the regression models. In addition, it also dem- onstrates that overall F statistics is 24.244, which indicates the combination of independent variables (GPM, NPM, ROA, and ROE) significantly predict debt to asset.

Table 5 indicates the regression analysis between dependent variable (debt to equity) and independent variables (GPM, NPM, ROA, and ROE). The beta coefficient represents that net profit margin and return on equity significantly predict debt to equity when all variables included. It also shows collinearity statistics where tolerance and VIF give the same information (Tolerance

= 1/VIF). If the tolerance value is low (< 1-R

2

), then there is probably a problem with multicollinearity. The tolerance value is 0.615 (1-R

2

) which reveals no problem with multicollinearity.

Debt to Asset Debt to Equity GPM NPM ROA ROE

Debt to Assets

Pearson Correlation 1 Sig. (2-tailed)

N 125

Debt to Equity Pearson Correlation -.019 1

Sig. (2-tailed) .835

N 125 125

GPM Pearson Correlation -.557** .066 1

Sig. (2-tailed) .000 .466

N 125 125 125

NPM

Pearson Correlation -.528** .254** .602** 1

Sig. (2-tailed) .000 .004 .000

N 125 125 125 125

ROA Pearson Correlation -.569** -.031 .555** .532** 1

Sig. (2-tailed) .000 .736 .000 .000

N 125 125 125 125 125

ROE

Pearson Correlation -.022 -.555** .026 -.036 .404** 1

Sig. (2-tailed) .807 .000 .776 .692 .000

N 125 125 125 125 125 125

**. Correlation is significant at the 0.01 level (2-tailed).

(6)

The model summary reveal the correlation coefficient R, using all the predictors simultaneously is 0.621, R

2

= 0.385 and the adjusted R

2

is 0.365 that indicate 36.5% of the variance in debt to equity can be predicted from independent variables (GPM, NPM, ROA, and ROE), whereas the remaining 63.5% influenced by others which are not considered for this study. According to Cohen (1988), this is a large effect. As shown in table 4, Durbin Watson value is 1.532,which represents no autocorrela- tion problem in the regression models. In addition, it also reveal that overall F statistics is 18.787, which indicates the combina- tion of independent variables (GPM, NPM, ROA, and ROE) sig- nificantly predict debt to equity.

Based on above results, hypothesis H3 is accepted because it indicates that capital structure variables have significantly im- pact on firm performance.

7. Conclusions:

The main objective of this study is to empirically investigate the impact of capital structure on firmperformance using 25 ce- ment companies listed on Karachi Stock Exchange during 2009-2013. Descriptive statistics results show a poor perform- ance by cement companies, because about 64.51 percent of to- tal assets of cement companies are financed by debt. Based on correlation results this study finds a negative relation between debt to asset and firm performance variables (GPM, NPM, ROA, and ROE). It also indicates a positive relation between debt to equity and firm performance variables (GPM & NPM), whereas a negative relationship between debt to equity and firm perform- ance variables (ROA & ROE). Besides, regression results reveal that there is a significant impact of capital structure on firm’s

<Table 4> Regression Analysis between Debt to Assets and Independent Variables Coefficients Model Unstandardized Coefficients Standardized

Coefficients t Sig. Collinearity Statistics

B Std. Error Beta Tolerance VIF

1

(Constant) .687 .036 19.180 .000

GPM -.255 .099 -.235 -2.569 .011 .550 1.817

NPM -.085 .048 -.164 -1.784 .077 .547 1.827

ROA -1.800 .438 -.409 -4.111 .000 .465 2.150

ROE .133 .074 .144 1.811 .073 .550 1.817

Model Summary

R .669

R Square .447

Adjusted R Square .429

Durbin Watson 2.131

F - Statistics 24.244

Predictors: (Constant), GPM, NPM, ROA, ROE Dependent Variable: Debt to Asset

<Table 5> Regression Analysis between Debt to Equity and Independent Variables Coefficients

Model Unstandardized

Coefficients Standardized

Coefficients t Sig. Collinearity Statistics

B Std. Error Beta Tolerance VIF

1

(Constant) 2.163 .338 6.398 .000

GPM -1.542 .936 -.159 -1.648 .102 .550 1.817

NPM 1.063 .449 .229 2.369 .019 .547 1.827

ROA 7.303 4.134 .185 1.767 .080 .465 2.150

ROE -5.136 .695 -.618 -7.393 .000 .550 1.817

Model Summary

R .621

R Square .385

Adjusted R Square .365

Durbin Watson 1.532

F - Statistics 18.787

Predictors: (Constant), GPM, NPM, ROA, ROE

Dependent Variable: Debt to Equity

(7)

performance. Because the adjusted R2 demonstrates that 42.9%

of the variance in debt to asset can be predicted from in- dependent variables (GPM, NPM, ROA, and ROE), whereas the remaining 57.1% influenced by others. On the other hand 36.5%

of the variance in debt to equity can be predicted from in- dependent variables (GPM, NPM, ROA, and ROE), whereas the remaining 63.5% influenced by others which are not considered for this study.

Based on empirical literatures and findings the study con- cludes that there is significant impact of capital structure on firm performance. Although business companies generally depend on the debt capital therefore financial analyst and managers should be cautious while using debt as a source of finance, since exist almost negative relationship between capital structure and firm performance of cement industry. The managers must an attempt to finance their activities and behaviors with retained earnings and employ debt as a final alternative. Consequently, this study suggests that financial analyst and managers should emphasize on optimal level of capital structure decision and efficient uti- lization and allocation of resources to achieve the targeted level of productive efficiency in cement industry of Pakistan.

8. Recommendations:

The main recommendations of this study include;

The investors should be communicated and established with y

the performance standards to take better decisions and achieve good standard. One of best standard to improve the firm performance is to identify weaknesses of invest- ment, as it shows the region, in which problems occurred.

Investors should be stimulated by firms through different y

programs (conferences) to get high level of firm performance.

Debt capital of firms should be control, because high level y

of debt capital tends to worst performance. By controlling debt capital, firms can get the preferred level of performance.

Firm performance should be motivated by increasing the y

equity capital. However, it also helps to increase the meas- ures of firm performance.

The government should notice the economic growth to con

y -

trol the inflation, because inflation rate also affect the firm performance.

The government should also consider improving the effi

y -

ciency of Karachi Stock Exchange, because international fi- nancial crisis and ethnic problem are also main cause for the inefficiency of the share market.

The government and banks should encourage the owners y

to increase the firm performance.

The government should also build a facilitating business y

friendly environment so that businesses can boom and thus raise firm performance level.

9. Limitations

The main limitations of this study include;

First, it only focuses on one sector of developing market so y

it can not signify the overall markets of transition economies. However there are many other sectors in Pakistan, therefore the results are limited to the selected sample only and not cover the other sectors.

Secondly, the time period for this study includes only five y

year data. In order to get more accurate and defined re- sults, the long time series data should be collected.

Thirdly, we can get the impact of capital structure on firm y

performance by sector and then evaluate the findings to recognize the actual picture of the relationship.

Competing Interests: The authors declare that they have no competing interests.

References

Abor, J. (2005). The effect of capital structure on profitability: an empirical analysis of listed firms in Ghana. Journal of Risk Finance, 6, 438-447.

Abor, J. (2007). Debt policy and performance of SMEs: evi- dence from Ghanaian and South Africa firms. Journal of Risk Finance, 8, 364-79.

Alsaeed, K. (2006). The association between firm-specific char- acteristics and disclosure: the case of Saudi Arabia.

Managerial Auditing Journal, 21(5), 476-496.

Brigham, E., & Houston, J. (2011). Fundamentals of financial management. South Western : Cengage Learning.

Chakravarthy, B. S. (1986). Measuring strategic performance.

Strategic Management Journal, 7, 437-58.

Cohen, J. (1988). Statistical power analysis for the behavioral sciences: Psychology Press.

Deesomsak, R., Paudyal, K., & Pescetto, G. (2004). The deter- minants of capital structure: evidence from the Asia Pacific region. Journal of multinational financial manage- ment, 14(4), 387-405.

Demsetz, H., and K. Lehn (1985). The Structure of Corporate Ownership: Causes and Consequences. Journal of Political Economy, 93, 1155-1177.

Ebaid, I. E. (2009). The impact of capital-structure choice on firm per- formance: empirical evidence from Egypt. The Journal of Risk Finance, 10(5), 477-487. doi:10.1108/15265940911001385 Frank, M., and Goyal, V. (2003). Testing the pecking order

theory of capital structure. Journal of Financial Economics, 67, 217-48.

Fraser, L. M., & Ormiston, A. (1998). Understanding financial statements. NJ : Prentice Hall.

Gleason, K. C., Mathur, L. K., & Mathur, I. (2000). The

Interrelationship between Culture, Capital Structure, and

Performance: Evidence from European Retailers. Journal

(8)

of Business Research, 50(2), 185-191.

Hadlock, C. J., & James, C. M. (2002). Do Banks Provide Financial Slack? The Journal of Finance, 57(3), 1383–

1419.

Holz, Carsten A. (2002). The Impact of the Liability-Asset Ratio on Profitability in China's Industrial State-Owned Enterprises. China Economic Review, 13, 1-26.

Huang, G., & Song, F. M. (2006). The determinants of capital structure: Evidence from China. China Economic Review, 17(1), 14 36. –

Khan, A. G. (2012). The relationship of capital structure deci- sions with firm performance: A study of the engineering sector of Pakistan. International Journal of Accounting and Financial Reporting, 2(1), 245-262.

Kothari, C. R. (2004). Research methodology: methods and techniques. New Delhi, India : New Age International.

Li, H., Meng, L., Wang, Q., & Zhou, L. A. (2008). Political con- nections, financing and firm performance: Evidence from Chinese private firms. Journal of development econom- ics, 87(2), 283-299.

Miller, M. H. (1977). Debt and Taxes. The Journal of Finance, 32(2), 261 275. –

Modigliani, F., & Miller, M. (1958). The cost of capital, corpo- ration finance and the theory of investment. American Economic Review, 48, 261-97.

Modigliani, F., and Miller, M. H. (1963). Corporate Income Taxes and the Cost of Capital: A Correction. American Economic Review, 53, 433 443. –

Murphy, G. B., Trailer, J. W., & Hill, R. C. (1996). Measuring performance in entrepreneurship research. Journal of Business Research, 36(1), 15 23. –

Nimalathasan, B., & Brabete, V. (2010). Capital structure and its

impact on profitability: A study of listed manufacturing companies in Sri Lanka. Young Economists Journal/Revista Tinerilor Economisti, 8(15), 121-221.

Pratheepkanth, P. (2011). Capital structure and financial perform- ance: evidence from selected business companies in Colombo Stock Exchange, Sri Lanka. Journal of arts, Science and Commerce, 2(2), 171-173.

Saad, N. M. (2010). Corporate Governance Compliance and the Effects to Capital Structure in Malaysia. International Journal of Economics & Finance, 2(1), 105-114.

Sandberg, W. R., & Hofer, C. W. (1988). Improving new venture performance: The role of strategy, industry structure, and the entrepreneur. Journal of Business venturing, 2(1), 5-28.

San, O.T., and Heng, T.B. (2011). Capital Structure and Corporate Performance of Malaysian Construction Sector.

International Journal of Humanities and Social Science, 1(2), 28-36.

Stapleton, R. C., Brealey, R., & Myers, S. (1981). Principles of Corporate Finance. The Journal of Finance, 36(4), 982-997.

Taani, K. (2013). Capital Structure Effects on Banking Performance: A Case Study of Jordan. International Journal of Economics, Finance and Management Sciences, 1(5), 227-233.

Vernimmen, P., Quiry, P., Le Fur, Y., & Dallochio, M. (2005).

Corporate Finance: Theory & Practice. Chichester: John Wiley & Sons.

Weill, L. (2008). Leverage and corporate performance: does in-

stitutional environment matter? Small Business

Economics, 30(3), 251-265.

수치

Table 2 reveals the summary of descriptive statistics for all dependent and independent variables of the study
Table 4 indicates the regression analysis between dependent variable (debt to asset) and independent variables (GPM, NPM, ROA, and ROE)

참조

관련 문서

Table 5 shows that cooperatives more rely on long-term debt than IOUs, as indicated by higher portion of long-term debt in total assets. While long-term debt accounts for

In this study, we examine a variety of firm’s attributes such as collateralized assets, profitability, corporate income tax, non – debt tax shield, size, growth

From the short-run equation, the study finds the negative and statistically significant impact of economic globalization on financial development in India whereas Sri Lanka

Moreover, firm growth (FG) has significant negative impact on capital structure (leverage) and firm size (FS) has insignificant impact on capital structure in both the

This study was conducted on financial data of 38 economic groups listed on Vietnam’s stock market for the period 2009 – 2019 and it aims to provide an empirical evidence on

However, in the Bangladeshi context, there is a dearth of research regarding the impact of intellectual capital disclosure on firm performance in the annual

(i) when firms have a higher debt ratio than the target debt ratio, capital surplus firms adjust toward target capital structure faster than the capital shortage firms; (ii)

Overall, the results indicate that profitability, firm size, financial leverage, sales growth, business risk and government ownership are the main factors influencing