• 검색 결과가 없습니다.

Liquidity and Solvency Management and its Impact on Financial Performance: Empirical Evidence from Jordan

N/A
N/A
Protected

Academic year: 2021

Share "Liquidity and Solvency Management and its Impact on Financial Performance: Empirical Evidence from Jordan"

Copied!
7
0
0

로드 중.... (전체 텍스트 보기)

전체 글

(1)

Print ISSN: 2288-4637 / Online ISSN 2288-4645 doi:10.13106/jafeb.2021.vol8.no5.0135

Liquidity and Solvency Management and its Impact on Financial Performance: Empirical Evidence from Jordan

Ahmad Abdelrahim DAHIYAT

1

, Sulaiman Raji WESHAH

2

, Mohammad ALDAHIYAT

3

Received: January 15, 2021 Revised: March 21, 2021 Accepted: April 01, 2021

Abstract

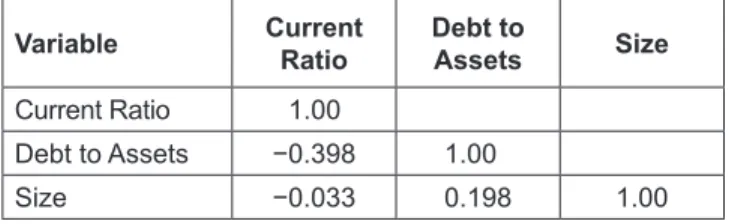
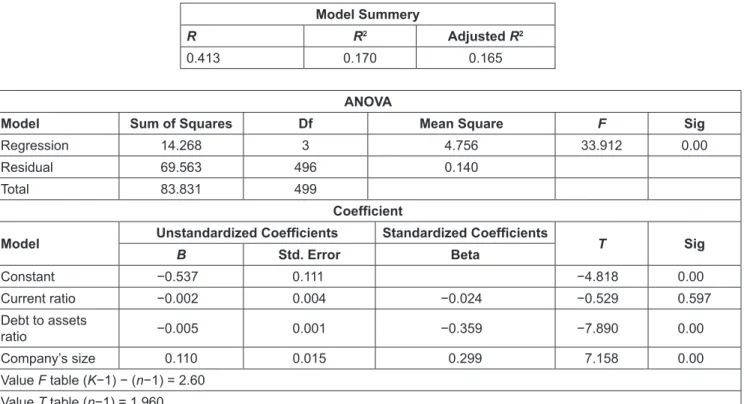
The study aims to examine the impact of liquidity and solvency management on the financial performance of Jordanian manufacturing companies listed on the Amman Stock Exchange, for a period of 10 years from 2010 to 2019. The size of the company was used as a control variable. The study employs Return on Assets (ROA) and Earnings Per Share (EPS) to measure financial performance. Current ratio (CR) and total debts to total assets were used as proxies for liquidity and solvency management, while logarithm of total assets was used to measure the size. Correlation and multi regression analyses have been applied to analyze the data. The results show a statistically significant impact of independent and control variables (liquidity and solvency management and the size of the company) on financial performance, while the detailed results of the hypotheses indicate that liquidity has an insignificant reverse impact on financial performance.

With respect to other variables, there is a significant positive impact of size on performance and a significant negative impact of solvency on performance. The study suggests in light of results, increasing investments in companies’ assets by focusing on internal financing, such that large-sized companies with low leverage will have a good performance.

Keywords: Liquidity, Solvency, Performance, Size, Manufacturing Companies, Jordan JEL Classification Code: G30, G34, D24, O16

revised theory of Modigliani and Miller (1963). Researchers are interested in studying liquidity and solvency, due to its implication on the economy in general, and due to its sensitivity because of probable impact on the performance and reputation of the institution.

Achieving a good financial performance through enhancing profitability, is an important goal of any commercial institution, and it is necessary to achieve their survival and continuity. It is considered an important tool for stakeholders in measuring the efficiency of management in its use of its resources.

A liquidity management strategy means the business has a plan for meeting its short-term and immediate cash obligations without experiencing significant losses.

It means the company is managing its assets, including cash to meet all liabilities, cover all expenses and maintain financial stability. For over-leveraged companies, a liquidity management strategy includes developing steps to reduce the gap between the cash available on hand and their debt obligations. Liquidity management is a set of ongoing strategies and processes that ensure your business is able to access cash as needed — to pay for goods and services, make payroll, and invest in new opportunities that arise.

1

First Author and Corresponding Author. Associate Professor, Accounting and Accounting Information System Department, Amman University College for Financial and Managerial Science, Al-Balqa Applied University, Jordan [Postal Address: P.O. Box 45,11831 Amman, Jordan] Email: [email protected]

2

Assistant Professor, Accounting and Accounting Information System Department, Amman University College for Financial and Managerial Science, Al-Balqa Applied University, Jordan.

Email: [email protected]

3

Associate Professor, Accounting Department, Business School, Al-Ahliyya Amman University, Jordan.

Email: [email protected]

© Copyright: The Author(s)

This is an Open Access article distributed under the terms of the Creative Commons Attribution Non-Commercial License (https://creativecommons.org/licenses/by-nc/4.0/) which permits unrestricted non-commercial use, distribution, and reproduction in any medium, provided the original work is properly cited.

1. Introduction

The study literature showed great interest in liquidity and

solvency management. Some theories dealt with liquidity

management and its implications on performance, such as

shiftability theory, commercial loan theory, and the theory

of anticipated income, and other theories that studied

solvency management, such as pecking-order theory and the

(2)

Liquidity also plays a big role in making investment decisions because most investment decisions are associated with the amount of available liquidity.

In Jordan, manufacturing companies play an important role in the economy. Investment in the industrial sector represents about 60% of the total investments and contributes significantly to the strength of the Jordanian dinar and the stability of the exchange rate by supplying reserves of foreign currency (by more than 8.0 billion dollars per year in the year 2017). The industry sector also contributes to consolidating financial stability in Jordan by subsidizing the treasury with more than one billion dinars annually in the form of direct or indirect taxes, as every dinar invested in the industry provides the treasury with more than eight piasters of tax revenues (Jordan Investment Commission 2021). While the contribution of the industrial sector to the GDP 24.5% Exports of this sector amounted to 4.9 billion dinars (external trade Journal 2018–2020) (The Ministry of Industry, Trade, and Supply, 2021).

Despite the importance of the industrial sector in the Jordanian economy, the return on assets (ROA) and the earnings per share (EPS) in the last four years reached modest numbers in 2016. The return on assets reached 0.85% in 2016, then it reached 1.62%, 4.18%, 3.18% during the following three years respectively, whereas earning per share reached 0.03 JD per share in 2016, then it reached 0.07, 0.18, 0.14 during the following three years respectively (ASE, 2021).

Therefore, due to the importance of the industrial sector in Jordan, and the importance of studying the factors that affect the financial performance of these companies, this paper will examine the impact of liquidity and solvency management on the financial performance of manufacturing companies listed on the Amman Stock Exchange (ASE).

It also examines the role of size as the control variable in achieving good financial performance.

2. Literature Review and Hypotheses 2.1. Theories of Liquidity and Solvency

Several theories investigated liquidity and solvency management; the famous theories related to liquidity management are:

The shiftability theory of bank liquidity was propounded by Moulton (1918) who asserted that if the commercial banks maintain a substantial amount of assets that can be shifted on to the other banks for cash without a material loss in case of necessity, then there is no need to rely on maturities. According to this view, an asset to be perfectly shiftable must be immediately transferable without capital loss when the need for liquidity arises. According to this

theory, banks will have liquidity if it owns assets that can be shifted readily to others for cash at satisfactory prices when funds are needed regardless of the assets’ nature (Udoka &

Anyingang, 2012). For banks, this theory encourages retaining fewer investments in long-term assets and reserves.

The commercial loan or the real bills doctrine theory states that a commercial bank should forward only short-term self-liquidating productive loans to business organizations.

Loans meant to finance the production, and evolution of goods through the successive phases of production, storage, transportation, and distribution are considered self-liquidating loans. This theory also states that whenever commercial banks make short-term self-liquidating productive loans, the central bank should lend to the banks on the security of such short-term loans. This principle assures that the appropriate degree of liquidity for each bank and appropriate money supply for the whole economy (Emmanuel, 1997).

Contrary to Commercial loan theory, the anticipated income theory was developed based on the practice of extending term loans by the US commercial banks. According to this theory, regardless of the nature and character of a borrower’s business, the bank plans the liquidation of the term-loan from the anticipated income of the borrower.

The bank puts restrictions on the financial activities of the borrower while granting this loan. At the time of granting a loan, the bank takes into consideration not only the security but the anticipated earnings of the borrower. According to previous theories, the commercial loan theory focused on short term assets, while anticipated income theory focused on long term assets, shiftability theory focused on the ability of the assets to be converted to cash regardless of the asset’s nature, while liability management theory relies on liability and assets to provide liquidity.

The famous theory related to solvency management that suggests a negative relationship between solvency and performance was developed by Myers and Majluf (1984).

Incorporate finance, the pecking order theory (or pecking

order model) postulates that the cost of financing increases

with asymmetric information. Financing comes from three

sources, internal funds, debt, and new equity. Companies

prioritize their sources of financing, first preferring internal

financing, and then debt, lastly raising equity as a “last

resort”. Hence: internal financing is used first; when that is

depleted, then the debt is issued; and when it is no longer

sensible to issue any more debt, equity is issued. This theory

maintains that businesses adhere to a hierarchy of financing

sources and prefer internal financing when available, and

debt is preferred over equity if external financing is required

(equity would mean issuing shares which meant ‘bringing

external ownership’ into the company). Thus, the form of

debt a firm chooses can act as a signal of its need for external

finance (Myers, 1984; Ahmeti & Prenaj, 2015).

(3)

2.2. Relationship Between Liquidity, Solvency (Leverage) and Financial Performance

Several studies linked liquidity ratios and/or solvency ratios with financial performance. Masdupi et al. (2018) found a negative significant impact of liquidity and leverage on the financial distress of manufacturing companies in Indonesia. Ali (2020) found that there is no relationship between financial leverage and financial performance measured by ROA. Ali and Faisal (2020) and Minnema and Andersson (2018) found that solvency has a significant impact on profitability, while Dahiyat (2016) found that liquidity has a significant negative impact on profitability, whereas solvency has no impact on profitability.

Sumani and Roziq (2020) found a significant negative impact of capital structure (debts to assets ratio and debt to equity ratio) on corporate performance, while liquidity policy (cash ratio, cash holding, liquid assets) has no significant impact on performance where performance was defined by ROA, ROE & Tobin’s Q. Madushanka and Jathurika (2018) applied their study to industrial companies listed on the Colombo Stock Exchange from 2012 to 2016. They concluded a positive and significant impact of liquidity on profitability. Ehiedu (2014) concluded a significant positive association between liquidity measured by current ratio and profitability.

Dalci (2018) applied his study on Chinese manufacturing companies and concluded that leverage affects profitability in “inverted U-shaped”, this means, that there is a positive and negative impact of leverage on profitability, financial distress, and bankruptcy and the positive impact could be attributed to tax shield.

2.3. Relationship Between the Size of Company and Financial Performance

Kouser et al. (2012) found that the relationship between the size of the non-financial company in Pakistan and profitability is negative. While Ozcan et al. (2017), John and Adebayo (2013), and Pervan and Višić (2012) found a significant positive relationship between the size of manufacturing companies and performance. Vinasithamby (2015) found a positive relationship between a firm’s size and profitability. Niresh and Velnampy (2014) and Ali (2020) found that firm size has no significant impact on profitability.

According to the above, the researcher formulates the following hypothesis:

H1: “There is no statistically significant impact (0.05  ≥  α)  of  liquidity  measured  by  (Current  ratio),  solvency measured by (debts to assets) and the size of the 

company measured by logarithm of total assets (control  variable) on performance measured by (return on assets)  for manufacturing companies listed on the Amman Stock  Exchange.”

H2: “There is no statistically significant impact at (0.05 ≥ α) of liquidity measured by (current ratio), solvency  measured  by  (debt  to  assets  ratio)  and  the  size  of  the  company  measured  by  logarithm  of  total  assets  (control  variable) on performance measured by (earnings per share)  for  manufacturing  companies  listed  on  the  Amman  Stock  Exchange.”

3. Research Methods

3.1. Study Population and Sample

The population of the study consists of 56 manu- facturing companies (Securities Depository Center Report, 2021), while the sample of the study involves 50 companies. These companies were selected because their annual reports were available for the study period.

This study relied on secondary data derived from the annual reports, during the period 2010–2019 that are available on the ASE website, for Jordanian manufacturing companies listed on the ASE.

3.2. Operationalization of Variables 3.2.1. Independent and Control Variables

Liquidity and solvency management:

Liquidity measured by Current ratio = Current Assets/

Current Liabilities (Dahiyat, 2012; Sumani & Roziq, 2020).

Solvency: Total Liabilities/Total Assets (Ahmad et al., 2015; Tahir et al., 2020; Sumani & Roziq, 2020).

Size of Company: Logarithm of total Assets (Ozcan et al., 2017; Pervan & Višić, 2012; Pattitoni et al., 2014).

3.2.2. Dependent Variable

Financial performance measured by:

Return on Assets: Net income/average Assets (Masadeh et al., 2015; Velnampy et al., 2014; Sumani & Roziq, 2020).

Earnings Per Share: Net Income/weighted average of the number of outstanding shares (Graham et al., 2005; Kumar, 2017; Yuliza, 2018).

3.3. Multicollinearity Test

Multicollinearity is the occurrence of high intercorre-

lations among two or more independent variables in a

multiple regression model. The variance inflation factor (VIF)

identifies the correlation between independent variables and

(4)

the strength of that correlation. Multicollinearity can also be detected with the help of tolerance and its reciprocal, called variance inflation factor (VIF). If the value of tolerance is less than 0.2 or 0.1 and, simultaneously, the value of VIF 10 and above, then multicollinearity is problematic. As shown in Table 1, it was found that the value of (VIF) is less than (10) and the value of (Tolerance) is greater than (0.1) for all variables. Therefore, these values are suitable for testing the statistical analysis and there is no high correlation between them (Hair et al., 2018).

3.4. Pearson Correlation Coefficient

The correlation coefficient (Pearson) was extracted between the independent variables to identify the strength of the relationship between them, and the results were as shown in Table 2.

It is clear from Table 2 that the values of the correlation coefficient between the independent variables are less than (80%) This means that the values are suitable for statistical analysis and are free from the problem of multiple correlations between the independent variables (Gujarati et al., 2017).

4. Results 4.1. Hypothesis 1

The hypothesis of the study states

HO.1: “There is no statistically significant impact (0.05 ≥ α) of liquidity measured by (Current ratio), solvency  measured (by debts to assets) and the size of the company  (control variable) on performance measured by (return on  assets) for manufacturing companies listed on the Amman  Stock Exchange).”

This hypothesis was tested using (Multiple Linear Regression) tests, and its results were as shown in Table 3.

Correlation coefficient R = (38.5%), indicating a moderate relationship between the variables. The value of R

2

= 0.148 indicates that the independent variables explain 14.8% of the variance in return on assets (ROA).

The results indicate the existence of a statistically significant impact of liquidity, solvency, and size of the company (combined) on ROA, as it is clear from the value of (F. Sig) of (0.00) < (0.05). Furthermore, the value of (F)

“calculated” is (28.783) > (2.60) “tabular value”, which also represents the significance of this hypothesis at a freedom degree (496/3).

The value of beta coefficient (β) (for the current ratio) is (β = −0.074) (in the reverse direction) and the value of computed (T ) is (−0.252) while the value in the table is (−1.960) at (Sig = 0.102) which is not significant; the value of the β (for debt to assets) is −0.337 (in the reverse direction) and the value of (T) calculated is (−8.174) > “tabular value”

at the level of (Sig = 0.00) which is significant. The value of β (for the size of the company) = 0.533, and the value of (T ) calculated is (5.666) > “tabular value” at the level of (Sig = 0.00), which is significant. Based on the above, the null hypothesis was rejected (Ho) with respect to the impact of solvency measured by (debt to assets) and the size of the company on performance measured by (return on assets) and therefore there is a significant effect at (0.05 ≥ α).

The null hypothesis (Ho) with respect to the impact of liquidity measured by (current ratio) on performance measured by (return on assets) is not significant at (0.05 ≥ α).

The form of the prediction equation is as follows.

Return on assets = 14.553 − 0.252 × current ratio

− 0.170 × debt to assets + 3.019 × company size 4.2. Hypothesis 2

The second hypothesis of the study states

HO.2: “There is no statistically significant impact at (0.05 ≥ α) of liquidity measured by (current ratio), solvency  measured  by  (debt  to  assets  ratio)  and  the  size  of  the  company  (control  variable)  on  performance  measured  by  (earnings per share) for manufacturing companies listed on  the Amman Stock Exchange.” 

This hypothesis was tested using (Multiple Linear Regression) tests, and its results were as shown in Table 4.

R = (41.3%), which expresses a moderate relationship between the variables. The value of the R

2

= 0.170 indicates that the independent variables explain 17% of the variance in earnings per share (EPS).

Table 1: VIF

Variables Tolerance VIF

Current Ratio 0.839 1.192

Debts to Assets Ratio 0.807 1.239

Size of Company 0.958 1.044

Table 2: Pearson for Independent Variables

Variable Current

Ratio Debt to

Assets Size

Current Ratio 1.00

Debt to Assets −0.398 1.00

Size −0.033 0.198 1.00

(5)

Table 3: Results of the Multiple Linear Regression Model of the Effect of Current Ratio and Debt to Assets Ratio on Profitability Measured with Return on Assets

Model Summery

R R

2

Adjusted R

2

0.385 0.148 0.143

ANOVA

Model Sum of Squares Df Mean Square F Sig

Regression 14572.324 3 4857.441 28.783 0.00

Residual 83706.078 496 168.762

Total 98278.402 499

Coefficient

Model Unstandardized Coefficients Standardized Coefficients

T Sig

B Std. Error Beta

Constant −14.553 3.864 −3.766 0.00

Current Ratio −0.252 0.154 −0.074 −1.638 0.102

Debt to Assets −0.170 0.021 −0.377 −8.174 0.00

The size 3.019 0.533 0.240 5.666 0.00

Value F “table” (K−1) − (n−1) = 2.60 Value T “table” (n−1) = 1.960

Table 4: Results of the Multiple Linear Regression Model for the Effect of the Current Ratio and Debt Ratio on Performance Measured by Earnings Per Share

Model Summery

R R

2

Adjusted R

2

0.413 0.170 0.165

ANOVA

Model Sum of Squares Df Mean Square F Sig

Regression 14.268 3 4.756 33.912 0.00

Residual 69.563 496 0.140

Total 83.831 499

Coefficient

Model Unstandardized Coefficients Standardized Coefficients

T Sig

B Std. Error Beta

Constant −0.537 0.111 −4.818 0.00

Current ratio −0.002 0.004 −0.024 −0.529 0.597

Debt to assets

ratio −0.005 0.001 −0.359 −7.890 0.00

Company’s size 0.110 0.015 0.299 7.158 0.00

Value F table (K−1) − (n−1) = 2.60

Value T table (n−1) = 1.960

(6)

The results show the existence of a statistically significant impact of independent variables on the dependent variable

“earnings per share”, from (F. Sig) of (0.00) more than (0.05).

Furthermore, the value of calculated (F) is (33.912) > than (2.60) “tabular value”, which also represents the significance of this hypothesis at freedom degree (496/3).

The value of the β (of the current ratio) = −0.024 (in a reverse direction) and the value of (T ) computed is (−0.529) < (−1.960) “tabular value” at the level of (Sig = 0.597) which is not significant; the value β (for debt assets) = −0.359 (in a reverse direction) and the calculated value of (T ) is (−7.890) > than “tabular value” at the level of (Sig = 0.00) which is significant. The value of β (for the size of the company) = 0.299, and the computed value of (T ) is (7.158) > than the “tabular value” at (Sig = 0.00), which is significant. Based on the above:

Null hypothesis (Ho) with respect to liquidity measured by (current ratio) on performance measured by (earnings per share) was accepted, hence, there is no significant effect at (0.05 ≥ α). The form of the prediction equation is as follows.

Null hypothesis (Ho) with respect to solvency measured (debt to assets) and the size of the company on performance measured by (earnings per share) was rejected; hence, there is a significant effect at (0.05 ≥ α).

Earnings per share = 0.537 − 0.002 × Trading ratio

− 0.005 × Debt to assets + 110 × Company size

5. Conclusion

This paper has examined the impact of liquidity and solvency management of Jordanian manufacturing companies on financial performance, in the existence of the size of the company as a control variable from 2010–2019. It demonstrated a significant negative impact of solvency measured by total liabilities to total assets’ ratio on performance measured by Return on Assets (ROA) and earnings per share (EPS), which means that companies with low debt have better performance, and this may be justified by the pecking-order theory which proposed by Myers and Majluf (1984), that suggests a negative relationship between the debt size and performance, and agreed with several studies such as Minnema and Andersson (2018), Ali and Faisal (2020), and Sumani and Roziq (2020).

The study also found a positive impact of the size of the company measured by the logarithm of total assets, on performance. The researchers justify this result since the company can efficiently use its assets so that the increase of assets will lead to an increase in performance. This result was consistent with several studies such as Ozcan et al. (2017) and Vinasithamby (2015). Liquidity has an insignificant impact on profitability and this result agreed with Sumani and Roziq (2020).

Whereas, the study found a reverse but insignificant impact of liquidity measured by current ratio on performance, which means that liquidity is not considered a powerful factor of financial performance in Jordanian manufacturing companies. This result agreed with Sumani and Roziq (2020).

Our paper contributed by presenting important factors affecting the performance of Jordanian manufacturing companies, where solvency affects the performance negatively. The study suggests in light of results, increasing investments in companies’ assets by focusing on internal financing, such that large-sized companies with low leverage will have a good performance.

References

Ahmad, N., Salman, A., & Shamsi, A. (2015). Impact of financial leverage on firms’ profitability: An investigation from cement sector of Pakistan. Research Journal of Finance and  Accounting,  6(7), 2222–1697. https://core.ac.uk/download/

pdf/234630643.pdf

Ahmeti, F., & Prenaj, B. (2015). A critical review of Modigliani and Miller’s theorem of capital structure. International Journal  of  Economics,  Commerce,  and  Management,  3(6), 914–924.

https://ssrn.com/abstract=2623543

Ali, M. (2020). Impact of leverage on financial performance:

Evidence from Pakistan food and fertilizer sector. Journal of  Critical  Reviews,  7(13), 447–456. http://www.jcreview.com/

fulltext/197-1593082784.pdf

Ali, A., & Faisal, S. (2020). Capital structure and financial performance: A Case of Saudi petrochemical industry. The Journal  of  Asian  Finance,  Economics,  and  Business,  7(7), 105–112. https://doi.org/10.13106/jafeb.2020.vol7.no7.105 Amman Stock Exchange (ASE). (2021). Cumulative data report.

https://www.ase.com.jo/en/Investors/Companies-Guide/

Cumulative-Data

Dahiyat, A. (2016). Do liquidity and solvency affect banks’

profitability? Evidence from listed banks in Jordan.

International  Journal  of  Academic  Research  in  Accounting,  Finance  and  Management  Sciences,  6(1), 35–40. https://doi.

org/10.6007/IJARAFMS/v6-i1/1954

Dalci, I. (2018). Impact of financial leverage on the profitability of listed manufacturing firms in China. Pacific  Accounting  Review, 30(4), 410–432. https://doi.org/10.1108/PAR-01- 2018-0008

Ehiedu, V. C. (2014). The impact of liquidity on the profitability of some selected companies: The financial statement analysis (FSA) approach. Research Journal of Finance and Accounting,  5(5), 81–90. https://www.iiste.org/Journals/index.php/RJFA/

article/view/11414

Emmanuel, N. R. (1997). Commercial  banking  in  an  era  of  deregulation (3

rd

ed.). Westport, CT: Greenwood Publishing Group.

Gujarati D, Porter, D., & Gunasekar, S. (2017). Basic econometrics

(5

th

ed). New York: The McGraw- Hill Gunasekar.

(7)

Graham, J. R., Harvey, C. R., & Rajgopal, S. (2005). The economic implications of corporate financial reporting.  Journal  of  Accounting and Economics, 40(1–3), 3–73.

Hair, J. F., Black, W. C., Babin, B. J., Anderson, R. E., & Tatham, R. L. (2018). Multivariate data analysis (8

th

ed). London, UK:

Cengage Learning EMEA.

John, A. O., & Adebayo, O. (2013). Effect of firm size on profitability: Evidence from Nigerian manufacturing sector.

Prime  Journal  of  Business Administration  and  Management,  3(9), 1171–1175. https://mtu.edu.ng/mtu/oer/journals/38- AkinyomiandOlagunju.pdf

Investment Commission. (2021). Industrial sector. https://www.jic.

gov.jo/wp-content/uploads/2018/07/Sector-Profile-Industry- Final-Mar-2018-JIC-1.pdf

Kouser, R., Bano, T., Azeem, M., & Hassan, M. (2012). Inter- relationship between profitability, growth, and size: A case of non-financial companies from Pakistan. Pakistan  Journal  of  Commerce  and  Social  Sciences,  6(2), 405–419. http://hdl.

handle.net/10419/188068

Kumar, P. (2017). Impact of earning per share and price earning ratio on the market of share: A study on the auto sector in India. International Journal of Research: Granthaalayah, 5(2), 113–118. https://doi.org/10.5281/zenodo.345456

Masadeh, R., Tayeh, M., Al-Jarrah, I. M., & Tarhini, A. (2015).

Accounting vs. market-based measures of firm performance related to information technology investments. International Review of Social Sciences and Humanities, 9(1), 129–145.

Niresh, A., & Thirunavukkarasu, V. (2014). Firm size and profitability: A study of listed manufacturing firms in Sri Lanka. International  Journal  of  Business  and  Management,  9(4), 57–64. https://ssrn.com/ abstract=242244

Ozcan, I. S. İ. K., Unal, E. A., & Yener, U. N. A. L. (2017). The effect of firm size on profitability: evidence from Turkish manu- facturing sector. Journal  of  Business  Economics  and  Finance,  6(4), 301–308. https://doi.org/10.17261/Pressacademia.2017.762 Pattitoni, P., Petracci, B., & Spisni, M. (2014). Determinants of

profitability in the EU-15 area. Applied  Financial  Economics,  24(11), 763–775. https://doi.org/10.1080/09603107.2014.904488 Pervan, M., & Višić, J. (2012). Influence of firm size on its business

success. Croatian Operational Research Review, 3(1), 213–223.

Securities Depository Center. (2021). Public shareholding companies  report-industry  sector. https://www.sc.com.jo/english/index.

php?option=com_public&member_cat=900&member_sub_

cat=4

Tahir, H., Masri, R., & Rahman, M. (2020). Corporate board attributes and dividend pay-out policy: Mediating role of financial leverage. The Journal of Asian Finance, Economics,  and  Business,  7(1), 167–181. https://doi.org/10.13106/

jafeb.2020.vol7.no1.167

The Ministry of Industry Trade and Supply. (2021). External trade  journal  2018–2020. http://www.mit.gov.jo/ebv4.0/root_

storage/ar/eb_list_page/trade_mag_2018_2020.pdf

Madushanka, K. H. I., & Jathurika, M. (2018). The impact of liquidity ratios on profitability. International Research Journal  of Advanced Engineering and Science, 3(4), 157–161. https://

www.semanticscholar.org/paper/The-Impact-of-Liquidity- Ratios-on-Profitability-(-)-Madushanka-Jathurika

Masdupi, E., Tasman, A., & Davista, A. (2018, July). The influence of liquidity, leverage, and profitability on financial distress of listed manufacturing companies in Indonesia. Advances  in  Economics,  Business  &  Management, 5(8), 389–394.

https://doi.org/10.2991/piceeba-18.2018.51

Minnema, J., & Andersson, A. (2018). The  relationship  between  leverage  and  profitability: A  quantitative  study  of  consulting  firms  in  Sweden. https://www.diva-portal.org/smash/get/

diva2:1234028/FULLTEXT01.pdf

Modigliani, F., & Miller, M. H. (1963). Corporate income taxes and the cost of capital: A correction. American Economic Review,  53, 433–443. https://www.jstor.org/stable/1809167

Moulton, H. G (1918). Commercial banking and capital formation.

The  Journal  of  Political  Economy.  26(7). 32–38. https://doi.

org/10.1086/253118

Myers, S. C. (1984). Capital structure puzzle (Working Paper Series No 1393). National Bureau of Economic Research. https://

www.nber.org/system/files/working_papers/w1393/w1393.pdf Myers, S. C., & Majluf, N. S. (1984). Corporate financing and

investment decisions when firms have information that investors do not have. Journal of Financial Economics, 13(2), 187–221. https://doi.org/10.1016/0304-405X(84)90023-0 Sumani, S., & Roziq, A. (2020). Reciprocal capital structure and

liquidity policy: Implementation of corporate governance toward corporate performance. The  Journal  of  Asian  Finance,  Economics,  and  Business,  7(9), 85–93. https://doi.

org/10.13106/jafeb.2020.vol7.no9.085

Udoka, C. O., & Anyingang, R. (2012). An analytical and theoretical investigation of the determinants of deposit money bank’s investment in treasury bills in Nigeria. European  Journal  of  Business  and  Management,  4(21), 42–48. https://www.iiste.

org/Journals/index.php/EJBM/article/view/3615

Velnampy, T., Nimalthasan, M. P., & Kalaiarasi, M. K. (2014).

Dividend policy and firm performance: Evidence from the manufacturing companies listed on the Colombo stock exchange.  Global  Journal  of  Management  and  Business  Research, 14(10), 63–68. https://globaljournals.org/GJMBR_

Volume14/10-Dividend-Policy-and-Firm.pdf

Vinasithamby, S. (2015). Does firm size influence on firm’s profitability? Evidence from listed firms of Sri Lankan hotels and travels sector. Research Journal of Finance and Accounting,  6(6), 201–207. https://www.iiste.org/Journals/index.php/RJFA/

article/view/21176

Yuliza, A. (2018). The effects of earning per share and firm size on stock price LQ45 company listed in Indonesian securities.

International  Journal  of  Engineering  &  Technology,  7(4–9),

247–249. https://doi.org/10.14419/ijet.v7i4.9.21089

수치

Table 1: VIF
Table 4: Results of the Multiple Linear Regression Model for the Effect of the Current Ratio and Debt Ratio on Performance  Measured by Earnings Per Share

참조

관련 문서

The findings of this study suggest that, since the positive effect of continuously-increased disclosure on firm performance leads to the reversal (negative) impact