Journal of Magnetics 22(2), 227-233 (2017) https://doi.org/10.4283/JMAG.2017.22.2.227
©2017 Journal of Magnetics
Effects of Physical Factors on Computed Tomography Image Quality
Min-Cheol Jeon1, Man-Seok Han2*, Jae-Uk Jang3, and Dong-Young Kim4
1Department of Radiology, Daejeon Health Institute of Technology, Daejeon 34504, Korea 2Department of Radiological Science, Kangwon National University, Samcheok 25949, Korea 3Department of Radiation Oncology, Chungnam National University Hospital, Daejeon 35015, Korea
and Department of Health Medical Science, Graduate School, Kangwon National University, Samcheok 25913, Korea
4Department of Biomedical Engineering, Chungnam National University, Daejeon 35015, Korea
(Received 24 February 2017, Received in final form 11 April 2017, Accepted 11 April 2017)
The purpose of this study was to evaluate the effects of X-ray photon energy, tissue density, and the kernel essential for image reconstruction on the image quality by measuring HU and noise. Images were obtained by scanning the RMI density phantom within the CT device, and HU and noise were measured as follows: images were obtained by varying the tube voltages, the tube currents and eight different kernels. The greater the volt-age-dependent change in the HU value but the noise was decreased. At all densities, changes in the tube cur-rent did not exert any significant influence on the HU value, whereas the noise value gradually decreased as the tube current increased. At all densities, changes in the kernel did not exert any significant influence on the HU value. The noise value gradually increased in the lower kernel range, but rapidly increased in the higher kernel range. HU is influenced by voltage and density, and noise is influenced by voltage, current, kernel, and density. This affects contrast resolution and spatial resolution.
Keywords : Hounsfield unit (HU), noise, kernel, tube voltage, tube current, density
1. Introduction
Computed Tomography (CT) scanning is an imaging procedure, wherein an object is imaged using the differ-ences in X-ray attenuation when X-rays penetrate the object. Attenuation refers to the reduction in the intensity of X-rays due to absorption or scattering within matter [1]. Physical factors determining the degree of attenuation during a CT scan include the X-ray photon energy, tissue density, tissue atomic number, and number of electrons per unit mass of material (electrons/gram) [2]. These factors influence parameters of the CT image quality, such as Hounsfield units (HU) and noise. CT image quality plays an important role in diagnosing diseases because clear and precise imaging of the microstructures of the human body is essential for accurate diagnosis [3]. A CT scan makes use of the fact that the degree of X-ray attenuation varies in different tissues of the human body, which is expressed by HU or the CT number.
(1) The HU scale differs slightly from one CT scanner to another, but it is based on the attenuation coefficients of air (−1000 HU) and water (0 HU). The attenuation coefficients of a material and water are defined by µ and µw, respectively, where µ depends on the atomic number
(cm−1) (2)
where Ne is the electron density expressed in terms of the number of electrons per unit volume, E is the photon energy, Zτ and ZR are the effective atomic numbers for
photoelectric absorption and Rayleigh scattering, respec-tively, and a, b, m, n, k, l are calibration constants [5]. CT image quality is also influenced by the kernel used for converting raw data into image data [6]. This study was conducted to evaluate the effects of X-ray photon energy, tissue density, and the kernel essential for image recon-struction on the image quality by measuring HU and noise, the two major components of CT image quality.
HU = 1000 µ µ– w µw ---× µ = Ne aZτ m Ek --- bZR n El --- c E( ) + + ⎝ ⎠ ⎛ ⎞
©The Korean Magnetics Society. All rights reserved. *Corresponding author: Tel: +82-33-540-3383 Fax: +82-33-540-3389, e-mail: [email protected]
2. Materials and Methods
2.1. Equipment and materials
1. SOMATOM definition AS open (Siemens, Germany) CT
2. RMI CT density phantom (Gammex, USA)
3. PACS (Picture Archiving and Communication System) using m-view (INFINITT, Korea)
2.2. Experimental
All of the experiments in this study were conducted using a CT Electron Density Phantom (Gammex RMI, USA), a cylinder of 33 cm diameter, into which plugs of 12 different densities (0.28, 0.48, 0.943, 0.983, 1.016, 1.053, 1.106, 1.129, 1.146, 1.334, 1.599, and 1.822 g/cm3) representing different human organs and structures (brain, liver, breast, etc.) can be placed. As X-ray equipment, the CT system SOMATOM Definition AS Open (Siemens, Germany) was used. Images were obtained by scanning the RMI density phantom within the CT device, and HU and noise were measured as follows:
1. Under a fixed tube current of 200 mAs and a slice thickness of 5 mm, images were obtained by varying the tube voltages (70, 80, 100, 120, and 140 kVp), This was followed by HU and noise measurements.
2. Under a fixed tube voltage of 100 kVp and a slice thickness of 5 mm, images were obtained by varying the tube currents (30, 60, 90, 120, 150, 180, 210, 240, 270, and 300 mAs). This was followed by HU and noise measurements.
3. Image reconstruction was performed on the images obtained under the conditions of slice thickness of 100 kVp, 210 mAs, and 5 mm, applying eight different kernels [B10 (very smooth), B20 (smooth), B30 (medium smooth), B40 (medium), B50 (medium sharp), B60 (sharp), B70 (very sharp), and B80 (ultrasharp)]. This was followed by HU and noise measurements.
The CT scan images were transferred to M-view, a PACS viewing software, and HU and noise values were measured after selecting regions of interest (ROIs).
3. Results
3.1. HU and noise according to tube voltage and den-sity
After fixing the tube current at 200 mAs and choosing the kernel (B30), HU and noise values were measured by applying various tube voltages (70, 80, 100, 120, and 140 kVp) and densities (0.28, 0.48, 0.943, 0.983, 1.016, 1.053, 1.106, 1.129, 1.146, 1.334, 1.599, and 1.822 g/cm3). Depending on the density, the HU values measured ranged −711.3-1877.3 HU at 70 kVp, −712.7-1645.3 HU at 80 kVp, −717.3-1355.0 HU at 100 kVp, −716.3-1188.3 HU at 120 kVp, and −719.7-1095.3 HU at 140 kVp. As the density increased from 0.28 g/cm3 to 1.822 g/cm3, the HU value increased. The lower the density, the smaller
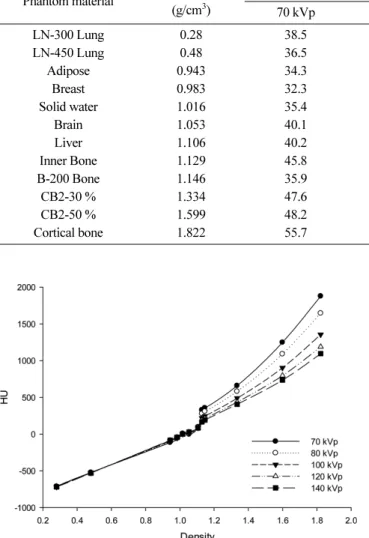
Table 1. HU according to tube voltage and density. Phantom material Density
(g/cm3) HU 70 kVp 80 kVp 100 kVp 120 kVp 140 kVp LN-300 Lung 0.28 −711.3 −712.7 −717.3 −716.3 −719.7 LN-450 Lung 0.48 −523.3 −525.0 −528.3 −526.7 −531.0 Adipose 0.943 −115.7 −106.3 −94.7 −88.3 −83.7 Breast 0.983 −60.3 −54.7 −49.3 −46.3 −44.3 Solid water 1.016 8.3 7.3 2.0 0.3 0.0 Brain 1.053 −4.0 3.7 15.3 23.7 28.3 Liver 1.106 95.0 91.7 86.7 85.3 83.3 Inner Bone 1.129 328.0 277.3 218.3 186.0 165.7 B-200 Bone 1.146 357.0 307.7 244.3 211.0 191.3 CB2-30 % 1.334 659.0 581.3 489.0 436.3 406.7 CB2-50 % 1.599 1247.7 1090.3 902.7 796.0 735.0 Cortical bone 1.822 1877.3 1645.3 1355.0 1188.3 1095.3
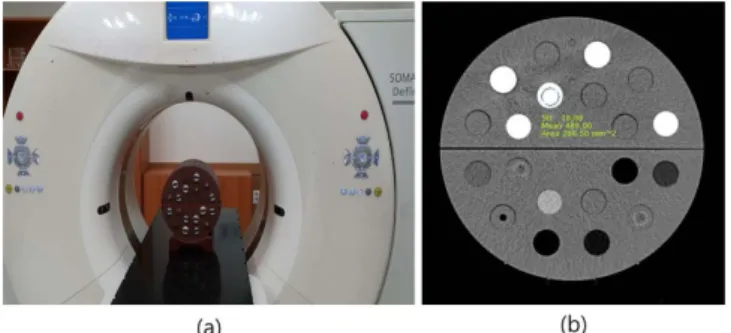
Fig. 1. (Color online) The RMI CT density phantom was scaned with SOMATOM definition AS open CT (a). The HU and Noise of image scaned was measured with ROI of PACS (b).
the voltage-dependent change in the HU value, and accordingly, the higher the density, the greater the voltage-dependent change in the HU value (Table 1).
Depending on the density, the measured noise ranged 32.3-55.7 at 70 kVp, 21.6-35.0 at 80 kVp, 13.0-26.4 at 100 kVp, 9.8-25.1 at 120 kVp, and 7.8-24.6 at 140 kVp. As the tube voltage increased from 70 kVp to 140 kVp, the noise decreased (Table 2).
3.2. HU and noise according to tube current and den-sity
After fixing the tube voltage at 100 kVp and choosing the kernel (B30), HU and noise values were measured, applying various tube currents (30, 60, 90, 120, 150, 180, 210, 240, 270, and 300 mAs) and densities (0.28, 0.48, 0.943, 0.983, 1.016, 1.053, 1.106, 1.129, 1.146, 1.334, 1.599, and 1.822 g/cm3). The measured values of HU and
noise ranged −718.3-1353.3 HU and 33.7-50.4 at 30 mAs, 1361.7 HU and 22.7-37.8 at 60 mAs, −718.3-1358.7 HU, 19.4-30.2 at 90 mAs, −717.0-1354.3 HU and 17.5-28.1 at 120 mAs, −716.7-1353.7 HU and 15.3-28.0 at 150 mAs, −717.0-1354.7 HU and 13.8-25.9 at 180 mAs, −717.7-1354.3 HU and 12.0-26.2 at 210 mAs, 1354.7 HU and 12.0-26.6 at 240 mAs, −716.3-1353.0 HU and 10.9-25.5 at 270 mAs, and −716.0-1355.7 HU and 10.6-26.5 at 300 mAs. At all densities, changes in the tube current did not exert any significant influence on the HU value, whereas the noise value gradually decreased as the tube current increased from 30 mAs to 300 mAs (Tables 3 and 4).
3.3. HU and noise according to kernel
CT images were obtained with X-ray photon energy
Table 2. Noise according to tube voltage and density. Phantom material Density
(g/cm3) NOISE 70 kVp 80 kVp 100 kVp 120 kVp 140 kVp LN-300 Lung 0.28 38.5 31.5 26.4 25.1 24.6 LN-450 Lung 0.48 36.5 26.2 18.0 14.8 14.0 Adipose 0.943 34.3 22.4 13.5 10.0 8.3 Breast 0.983 32.3 21.6 13.0 9.8 7.8 Solid water 1.016 35.4 24.6 13.8 10.9 8.2 Brain 1.053 40.1 26.9 15.5 10.9 9.2 Liver 1.106 40.2 25.9 15.1 11.6 9.8 Inner Bone 1.129 45.8 33.7 17.7 13.3 10.2 B-200 Bone 1.146 35.9 25.6 13.9 10.5 8.4 CB2-30 % 1.334 47.6 34.2 19.0 13.0 10.8 CB2-50 % 1.599 48.2 33.7 17.8 12.4 10.2 Cortical bone 1.822 55.7 35.0 20.6 15.0 12.3
Fig. 2. Graph plotting the HU in the various tube voltages (70
kVp-140 kVp) and densities (0.28 g/cm3-1.822 g/cm3). Fig. 3. Graph plotting the noise in the various tube voltages (70 kVp-140 kVp) and densities (0.28 g/cm3-1.822 g/cm3).
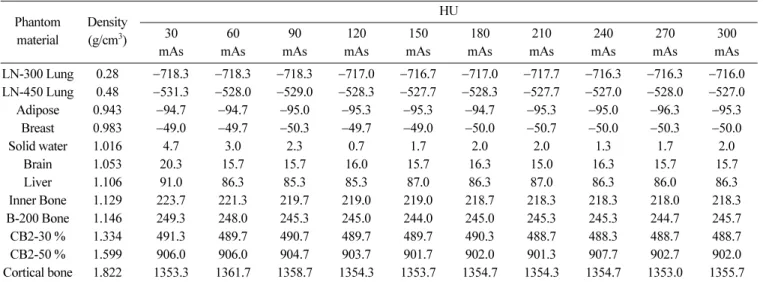
Table 3. HU according to tube current and density. Phantom material Density (g/cm3) HU 30 mAs 60 mAs 90 mAs 120 mAs 150 mAs 180 mAs 210 mAs 240 mAs 270 mAs 300 mAs LN-300 Lung 0.28 −718.3 −718.3 −718.3 −717.0 −716.7 −717.0 −717.7 −716.3 −716.3 −716.0 LN-450 Lung 0.48 −531.3 −528.0 −529.0 −528.3 −527.7 −528.3 −527.7 −527.0 −528.0 −527.0 Adipose 0.943 −94.7 −94.7 −95.0 −95.3 −95.3 −94.7 −95.3 −95.0 −96.3 −95.3 Breast 0.983 −49.0 −49.7 −50.3 −49.7 −49.0 −50.0 −50.7 −50.0 −50.3 −50.0 Solid water 1.016 4.7 3.0 2.3 0.7 1.7 2.0 2.0 1.3 1.7 2.0 Brain 1.053 20.3 15.7 15.7 16.0 15.7 16.3 15.0 16.3 15.7 15.7 Liver 1.106 91.0 86.3 85.3 85.3 87.0 86.3 87.0 86.3 86.0 86.3 Inner Bone 1.129 223.7 221.3 219.7 219.0 219.0 218.7 218.3 218.3 218.0 218.3 B-200 Bone 1.146 249.3 248.0 245.3 245.0 244.0 245.0 245.3 245.3 244.7 245.7 CB2-30 % 1.334 491.3 489.7 490.7 489.7 489.7 490.3 488.7 488.3 488.7 488.7 CB2-50 % 1.599 906.0 906.0 904.7 903.7 901.7 902.0 901.3 907.7 902.7 902.0 Cortical bone 1.822 1353.3 1361.7 1358.7 1354.3 1353.7 1354.7 1354.3 1354.7 1353.0 1355.7
Table 4. Noise according to tube current and density. Phantom material Density (g/cm3) NOISE 30 mAs 60 mAs 90 mAs 120 mAs 150 mAs 180 mAs 210 mAs 240 mAs 270 mAs 300 mAs LN-300 Lung 0.28 38.8 33.1 28.6 28.1 28.0 25.9 26.2 26.6 25.5 26.5 LN-450 Lung 0.48 37.6 29.4 23.7 20.3 15.3 19.0 18.6 18.0 15.0 16.7 Adipose 0.943 35.6 24.1 20.6 17.5 15.3 14.1 13.4 12.5 11.7 12.0 Breast 0.983 33.7 22.7 19.4 18.2 15.6 13.8 12.0 12..1 10.9 10.6 Solid water 1.016 36.6 26.9 22.6 17.6 16.0 15.4 12.4 12.1 11.5 11.1 Brain 1.053 39.0 28.4 24.2 21.0 17.9 16.4 15.0 15.1 13.5 12.4 Liver 1.106 40.2 27.6 22.3 21.4 17.9 16.3 15.4 14.2 12.9 13.6 Inner Bone 1.129 44.9 33.4 27.5 23.0 20.5 18.7 17.4 17.4 15.5 15.0 B-200 Bone 1.146 36.7 25.3 21.2 20.3 16.7 15.1 13.5 12.0 12.4 11.7 CB2-30 % 1.334 44.2 35.4 27.9 25.4 22.5 20.1 19.3 17.2 16.1 15.5 CB2-50 % 1.599 44.0 33.9 26.2 21.7 20.0 18.2 16.8 16.1 14.3 14.0 Cortical bone 1.822 50.4 37.8 30.2 26.6 22.0 20.1 19.8 18.4 17.1 15.8
Fig. 4. Graph plotting the HU in the various tube currents (30 mAs-300 mAs) and densities (0.28 g/cm3-1.822 g/cm3).
Fig. 5. Graph plotting the noise in the various tube currents (30 mAs-300 mAs) and densities (0.28 g/cm3-1.822 g/cm3).
fixed at 100 kVp and 210 mAs, and HU and noise were measured, applying eight different kernels (B10-B80). HU and noise ranged −712.3-1362.3 HU and 8.1-16.5 at
B10, −710.3-1340.7 HU and 10.4-18.2 at B20, −717.7-1354.3 HU and 12.0-26.2 at B30, −709.0-1337.0 HU and 15.1-21.9 at B40, −707.3-1335.0 HU and 36.2-51.1 at
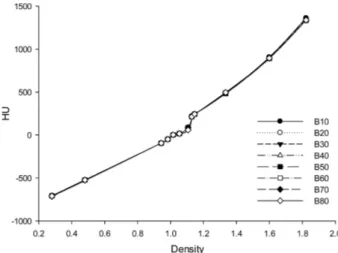
Table 5. HU according to kernel. Phantom material Density (g/cm3) HU B10 B20 B30 B40 B50 B60 B70 B80 LN-300 Lung 0.28 −712.3 −710.3 −717.7 −709.0 −707.3 −707.0 −707.0 −710.0 LN-450 Lung 0.48 −530.7 −525.7 −527.7 −524.0 −522.3 −522.7 −523.3 −524.3 Adipose 0.943 −95.0 −95.0 −95.3 −94.7 −94.0 −95.0 −94.3 −94.3 Breast 0.983 −50.3 −49.0 −50.7 −49.0 −49.0 −49.7 −49.3 −49.7 Solid water 1.016 2.3 2.3 2.0 2.3 2.0 1.3 1.3 2.0 Brain 1.053 15.7 15.7 15.0 15.7 15.3 17.0 17.0 16.0 Liver 1.106 86.3 86.3 87.0 86.0 86.0 86.0 85.7 85.0 Inner Bone 1.129 218.7 215.7 218.3 216.3 214.3 213.3 213.3 214.3 B-200 Bone 1.146 244.3 243.3 245.3 243.0 243.0 243.7 243.7 243.7 CB2-30 % 1.334 486.3 484.7 488.3 483.7 483.0 492.3 492.7 496.3 CB2-50 % 1.599 906.0 895.3 901.3 893.3 891.3 893.0 893.0 894.7 Cortical bone 1.822 1362.3 1340.7 1354.3 1337.0 1335.0 1336.3 1336.3 1338.3
Table 6. Noise according to kernel. Phantom material Density (g/cm3) NOISE B10 B20 B30 B40 B50 B60 B70 B80 LN-300 Lung 0.28 16.5 18.2 26.2 21.9 41.2 76.5 85.9 89.6 LN-450 Lung 0.48 14.1 13.1 18.6 19.1 41.7 81.8 91.8 95.0 Adipose 0.943 8.8 11.1 13.4 16.2 38.2 75.8 85.1 87.3 Breast 0.983 8.5 10.4 12.0 15.1 36.2 74.0 82.7 83.6 Solid water 1.016 9.3 10.7 12.4 15.9 38.4 76.7 86.2 88.4 Brain 1.053 8.1 10.6 15.0 16.7 40.5 84.8 94.9 95.2 Liver 1.106 9.4 12.1 15.4 18.1 40.3 80.1 90.1 92.3 Inner Bone 1.129 11.3 13.9 17.4 20.2 44.6 89.7 100.4 102.3 B-200 Bone 1.146 9.6 11.9 13.5 17.1 39.8 79.7 89.8 91.1 CB2-30 % 1.334 10.7 13.8 19.3 20.7 47.4 94.6 108.1 109.2 CB2-50 % 1.599 12.0 13.7 16.8 19.9 47.2 94.5 105.2 107.8 Cortical bone 1.822 14.4 15.3 19.8 21.6 51.1 100.8 113.3 116.1
Fig. 6. Graphs plotting the HU values in the various kernels (B10-B80) and densities (0.28 g/cm3-1.822 g/cm3).
Fig. 7. Graphs plotting the noise values in the various kernels (B10-B80) and densities (0.28 g/cm3-1.822 g/cm3).
B50, 1336.3 HU and 74.0-100.8 at B60, −707.0-1336.3 HU and 82.7-113.3 at B70, and −710.0-1338.3 HU and 83.6-116.1 at B80. At all densities, changes in the kernel did not exert any significant influence on the HU value. The noise value gradually increased in the lower kernel range (B10-B40), but rapidly increased in the higher kernel range (B50-B80) (Tables 5 and 6).
4. Discussion
CT scan plays an important role in diagnostic and therapeutic decision-making because it has high diagno-stic accuracy [7-9]. Since CT images should depict micro-structures with great precision, it is of paramount impor-tance to evaluate the effects of factors determinant of image quality [10]. This study investigated the effects of X-ray photon energy, tissue electron density, and kernel on the image quality by varying their values in the ranges of 70-140 kVp, 0.28-1.822 g/cm3 and B10-B80, respec-tively.
Attenuation occurs as a result of absorption and scatter-ing. As is the case with general radiography, attenuation by the photoelectric effect or scattering by the Compton effect is involved in CT. The total attenuation can thus be defined by the equation below.
Here, I is the intensity after the permeation, I0 is the original intensity, e is the base of natural logarithm, µp is the linear attenuation coefficient resulting from the photo-electric effect, and µc is the linear attenuation coefficient resulting from the Compton effect. In a CT device, such a
distribution of the attenuation values is expressed by the CT number [6].
According to the experimental results of this study, as the tube voltage increases from 70 kVp to 140 kVp, X-ray energy attenuation is not large at low densities, result-ing in low HU values; the HU value increases at higher densities, owing to increased X-ray energy attenuation. A higher HU value yielded at 70 kVp because of the smaller X-ray energy than at 140 kVp results in higher attenuation. Moreover, given that X-ray radiation is polychromatic with diverse energies, the HU value increases expon-entially with increasing density, as depicted in Fig. 2, unlike monochromatic radiation with a homogeneous beam. The difference in HU contributes to increasing the image contrast. Table 2 shows that noise decreases as the tube voltage increases. This may be interpreted as the result of decreased quantum noise due to the increased number of photons reaching the sensor owing to the effect of increased X-ray permeability with increasing X-ray energy.
While the increase in tube current from 30 mAs to 300 mAs does not affect the HU value significantly at the same density, noise is reduced. This is due to the fact that a higher tube current does not boost the beam quality, but increases the beam quantity, which results in quantum noise reduction, which increases the image contrast re-solution.
CT scan data are converted into image data using kernel. According to the experimental results of this study, an increase in kernel from B10 to B80 does not change the HU value significantly, but increases noise. This is ascrib-able to the noise generation through the filter applied in the reconstruction kernel. Owing to the fact that HU and noise change little in the lower kernel range, kernels B10-B40 are applied to the regions with low attenuation coefficients, such as the abdomen, and kernels B60 or higher are well-suited for bones with clear boundaries, organs with pneumatic anatomy, and regions with high attenuation coefficients. As a mid-range kernel, B50 has characteristics that lie between the kernels with high con-trast resolution suitable for regions with low attenuation coefficients such as abdomen and kernels with high spatial resolution suitable for bone and air, and should be used for soft tissue and regions of the spine for bone observation.
As a limitation of this study, it should be pointed out that only one phantom type and one slice thickness were used. Therefore, noise measurements according to object and slice thicknesses could not be made, although they affect noise. A follow-up study can be performed varying the object and slice thicknesses as well.
I = I0e–(μp+μc)x
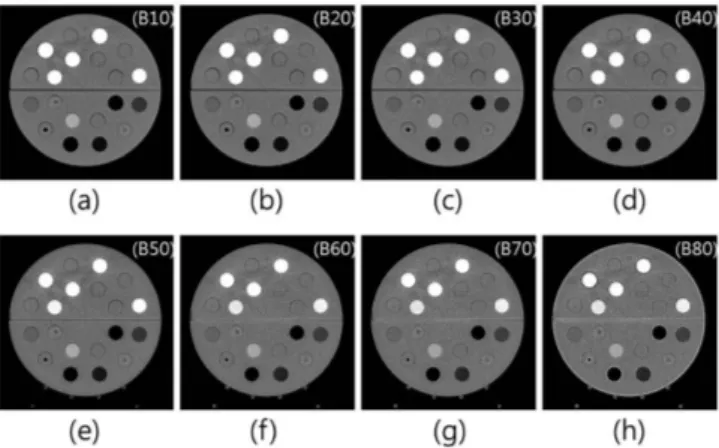
Fig. 8. The image of the phantom reconstructed with kernels. Eight images were reconstructed with various kernels as fol-lows: (a) very smooth, (b) smooth, (c) medium smooth, (d) medium, (e) medium sharp, (f) sharp, (g) very sharp, (h) ultra sharp.
5. Conclusion
This study found that HU is influenced by voltage and density, and noise is influenced by voltage, current, kernel, and density. This affects contrast resolution and spatial resolution. Therefore, in order to improve resolution, X-ray photon energies and kernels appropriate for each scan region and purpose should be selected. As a result, the improvement of resolution enhance accuracy of diagnosis by distinguishing micro lesions.
References
[1] H. C. Jang, Y. S. Kim, and H. J. Kim, J. The Korea Aca-demia-Industrial Cooperation Soc. 15, 1584 (2014). [2] S. M. Ha, S. H. Jung, H. J. Chang, E. A. Park, and H. J.
Shim, J. Progress in Med. Phys. 26, 28 (2015).
[3] E. J. Balthazar, A. J. Megibow, D. Hulnick, D. P. Naid-ich, Am. J. Roentgenol. 150, 301 (1988).
[4] H. M. Lee, B. G. Yoo, and D. C. Keon, J. Radiological Science and Technol. 31, 71 (2008).
[5] K. Ogden, W. Huda, E. M. Scalzetti, and M. L. Roskopf, Health Phys. 86, 397 (2004).
[6] G. N. Hounsfield, Br. J. Radiol. 68, H166 (1995). [7] S. W. Lee, H. J. Kim, T. H. Kim, S. J. Jo, and C. L. Lee,
J. Med. Phys. 20, 145 (2009).
[8] S. K. Kang, B. C. Cho, H. C. Park, and H. S. Bae, J. Med. Phys. 15, 23 (2004).
[9] J. U. Jang, M. S. Han, M. J. Kim, and H. S. Kang, J. Magn. 26, 173 (2016).
[10] Y. Watanabe, Phys. Med. Biol. 44, 2201 (1999). [11] Chung-ku Publishing, Textbook of Computed
Tomogra-phy, Korea (2009) pp. 47-75.
[12] E. Gallagher, T. Lukens, S. Colussiello, D. Morgan, S. Cantrill, and M. Campbell, Ann. Emerg. Med. 36, 406 (2000).
[13] B. Siewert, V. Raptopoulos, M. F. Mueller, M. P. Rosen, and M. Steer, Am. J. Roentgenol. 168, 173 (1997). [14] R. K. Zeman, S. H. Fox, P. M. Silverman, W. J. Davros,
L. M. Carter, and D. Griego, Am. J. Roentgenol. 160, 719 (1993).
[15] M. C. Jeon, M. S. Han, J. U. Jang, Y. K. Kim, S. Y. Seo, and G. J. Kim, Cluster Comput. 19, 931 (2016).