Print ISSN: 2288-4637 / Online ISSN 2288-4645 doi:10.13106/jafeb.2020.vol7.no1.291
The Effect of Social Capital on Personal Happiness:
A Focus on Service Inderstry Employees
Myung-Hee JUNG1
Received: October 10, 2019 Revised: November 01, 2019 Accepted: November 15, 2019
Abstract
The purpose of this study focuses on finding the influences of social capital on personal happiness by studying service industry employees. This current study utilized a questionnaire survey method which was used to collect the analysis data, from July 20 to August 10 in 2019. 281 questionnaires were gathered in Korea and the statistical analysis was conducted. This study recognized social capital as 3 independent variables and personal happiness as a dependent variable. Social capital is composed of the social network, social trust and social norms. First, the social network consisted of the satisfaction degree in one`s social relations and the social interaction degree. Second, social trust is composed of the trust degree with ones neighbors in the same local area. Last, social norms are consisted of reciprocity, participation and a sense of belonging one feels in the same society. The findings of this study were as follows: first, it was found that social network, social trust, and social norms made affirmative influences on personal happiness of the employees. Second, the social network and social norms made statistically significant influences with personal happiness, but social trust was shown to not have similar influence.
Keywords : Personal Happiness, Social Capital, Service Industry Employee, Social Network, Social Trust JEL Classification Code : I3, O1
1. Introduction
12Alvin Toffler described the process of human civilization development into three major stages in his third wave:
agricultural society, industrial society, and information society. But now, it is becoming a much more advanced society than he had originally claimed it to be. One of them is the expansion of individualism. In line with this, people are becoming more interested in the happiness of individuals, and the phenomena for maximizing individualism are starting to appear as a cultural phenomena. In other words, there is a strong tendency in the modern era to pursue individualistic happiness, but one of the main problems is that the factors affecting it are very diverse.
1 First Author and Corresponding Author, Professor, Department of Social Welfare, Jungwon University, Korea. [Postal Address: 85 Munmu-ro, Goesan-eup, Goesan-gun, Chungcheongbuk-do, 28024, Korea] Email: [email protected]
ⓒ Copyright: Korean Distribution Science Association (KODISA)
This is an Open Access article distributed under the terms of the Creative Commons Attribution Non-Commercial License (http://Creativecommons.org/licenses/by-nc/4.0/) which permits unrestricted noncommercial use, distribution, and reproduction in any medium, provided the original work is properly cited.
According to Oswald (1997), Frey and Stutzer (2002), and Layard (2005), there are three major factors that affect personal well-being. First, it is formed by microeconomic and macroeconomic factors such as employment, inflation and income (Easterlin, 1974, 1995; Clark & Oswald, 1994;
DiTella, MacCulloch, & Oswald, 2001; Alesina, DiTella, &
MacCulloch, 2004). Second, they are formed by personal and demographic factors such as gender, age, marital status, education and health (Oswald, 1997; Gerdtham &
Johannesson 2001; Frey & Stutzer, 2002). Third, it is formed by institutional factors, such as political decentralization or citizens' direct political participation (Frey & Stutzer, 2002).
These classifications may vary depending on the researcher's disposition, but generally, research is conducted by individual and demographic factors such as gender, age, marital status, education and health. Until now, there has not been any studies conducted on the significance of the specialty of the profession. Especially, the importance of distribution management is emphasized with the arrival of the 4th Industrial Revolution, which has been given much interest in recent years.
Additionally, social activities are carried out in the
relationships between individuals and their interactions, as well as those that are collectively living together in a group life, naturally living together with neighbors or conducting economic activities. As a result, a kind of social capital is accumulated from these relationships. This is a type of intangible capital, which plays a key role in resolving social conflicts, thereby increasing the personal happiness of the individual. Therefore, social capital and personal happiness are closely related to each other, but studies on how social capital and personal happiness interact are limited. Studies regarding this topic focuses on individual countries such as the United States (Putnam, 2000), Canada (Helliwell &
Barrington-Leigh, 2010; Leung, Kier, Fung, Fung, &
Sproule, 2010) or Germany (Bartolini, Bilancini, & Pugno, 2008; Winkelmann, 2009).
However, at the present time, in pursuit of the expansion of individualism and strong personal happiness, research that focuses on the individual rather than on the national level is necessary. Thus, the purpose of this study is as follows. This research will aim to introduce the concept of work in evaluating social capital and personal well-being, with a focus on retail workers. Additionally, the relationship between social capital and personal well-being will be analyzed.
2. Review of Literature
2.1. Concept and Composition of Social Capital
Social capital is an intangible concept and is generally described as an interaction between many individuals and social groups (Smelser & Swedberg, 1994). That is, individuals and groups are formed through their interactions.
The scholars who mainly conducted such research include Coleman, Putnam and Olson.
First, Coleman (1988) commented that social capital was a resource that people in economics could use to increase productivity. He mentions many features of social organization, such as: trust and duty, channels of information, norms and effective sanctions, saying that these three dimensions affect society's efficiency by encouraging coordination and cooperation between individuals and social groups. Trust in social capital is based on the credibility of the social environment, and the social structure also plays an important role in building trust as well. In addition, general confidence in the quality of political, legal and institutional environments affects not only individuals but also social group interactions, increasing the overall efficiency of society (Paxton, 1999; Paldam, 2001; North, 1990).
Moreover, information channels, such as colleagues, friends, or family members can form a sort of social capital that will be able to provide information where action might be promoted to the individual (Coleman, 1988). Frequent access to interpersonal networks speeds up the spread of information as well and can act as an important knowledge
resource and in turn, these interactions tend to lead to trust and cooperation. Finally, norms and effective sanctions are the third major form of social capital. Societies with set norms and transparent yet effective sanctions are able to reduce incentives for criminal action. Individuals who feel no fear but feel safe in the environment in which they live in can develop stronger ties within their communities. Thus, effective norms can facilitate exchanges, reduce transaction costs, reduce information costs, allow transactions in the absence of contracts, and encourage collective management of responsible citizenship and resources (Woolcock &
Narayan, 2000).
Second, Putnam (2000) expanded Coleman's theory of social capital by focusing on the positive added value of interpersonal networks. He assessed the effects of formal (political or occupational) and informal (interaction with family and friends) associations and argued that tighter, larger personal networks would bring great benefits to society. If an individual is a member of more than one social network, the frequency of interaction increases.
Third, Olson (1982) disagreed with Putnam's (2000) idea, and in particular tends to regard social groups, such as trade unions, professional groups, lobbying groups or political parties, as special interests and consequently interest groups.
This behavior is likely to lead to redistribution mechanisms that lead to the loss of efficiency, reduced output, and the overall rate of innovation from the transfer of wealth from nonmembers to members (Keefer & Knack, 1997; Knack, 2003). Thus, conflicts of interest between social groups would weaken economic stability and limit economic growth, resulting in costs for the rest of society (Knack, 2003). After analysis of the representative views on the above three scholars, this paper aimed to utilize Coleman's view of social capital.
2.2. Social Capital and Personal Happiness
Regarding the relationship between social capital and personal well-being, some researchers have found that general life satisfaction at the individual level is through various forms of channels (Putnam, 2000; Helliwell &
Barrington-Leigh 2010; Leung et al., 2010). We found that social capital has a significant positive impact on personal well-being. Social capital is more important than economic differences when describing "the strongest correlations of subjective well-being" (Helliwell & Putnam, 2004) and "the differences in life satisfaction" (Helliwell & Barringtron- Leigh, 2010). Other scholars, on the other hand, convey that it has an indirect effect on social capital, but often focus on relationships with health, wealth or economic growth. For example, Helliwell and Putnam (2004) show strong positive effects on physical health and increase life satisfaction. Zak and Knack (2001) consider it the driving force behind the growth of economic growth, and Rodrik (1998) assessed social capital as a tool to better absorb external shocks.
Helliwell and Lee (2010) and Winkelmann (2009) have also identified micro-data from Canada and Germany as
predictors of well-being.
On the other hand, Bjørnskov (2003) stressed a strong and strong relationship between social capital and happiness.
He finds that high levels of social capital, especially in Nordic countries, improve economic growth, stability and well-being. But, Ram (2010) refutes and argues that only a fragile relationship exists between social capital and happiness. However, there is an important issue in the study of social capital that needs to be taken into account when evaluating the literature on the relationship to happiness.
Recent studies are generally unclear and tend to criticize the robustness of social capital research in that they are relevant only when the analyzed countries have reached certain income standards (Bjørnskov, 2008). However, the definition of social capital, in which the object of most criticism in the study of happiness, is ambiguous. The lack of consensus or consistency in the definition of social capital has resulted in a variety of outcomes.
Second, empirical studies analyzing this linkage tend to focus on specific aspects of social capital rather than the entire spectrum. In other words, some studies focus only on one-dimensional social capital indices such as trust (Helliwell, 2006), while others integrate two aspects, such as trust and information channels (Bjørnskov, 2008). Therefore, the results are very different depending on how social capital is defined. One of the most commonly reviewed aspects of social capital is trust. Research linking trust to personal well-being tends to have a positive impact on public and institutional trust (Helliwell & Putnam, 2004; Helliwell, 2006; Bjørnskov, 2008). The community level or social trust defined by Coleman has a very important positive effect on happiness. "If we share a high enough level of social trust at the social level, people can interact with people they don't know, resulting in a safer, more predictable and happier life"
(Bjørnskov, 2008).
These results were not only strongly demonstrated in the cross-regional analysis in the United States, but also in individuals (Bjørnskov, 2008). Confidence has been found to be equally associated with significantly higher levels of well-being in countries using global data (Helliwell & Wang, 2011). Bjørnskov (2006) even claims that social trust is the only form of social capital that affects well-being. It was also found that the lack of trust and social networks which are components of social capital have a negative relationship to personal well-being (Lee & Oh, 2014). Institutional confidence has been found to have a positive effect on personal well-being in Europe (Frey & Stutzer, 2002;
Hudson, 2006). As Leung et al. (2010) pointed out, institutional trust is still very important, even when considering other dimensions of social capital such as information channels, norms, and sanctions.
As far as the informal social activities proposed by Putnam (2004) are concerned, interactions with family, friends and colleagues are considered to lead to a strong feeling of individual social penetration and belonging as well as integration in society. Most studies have confirmed that, for example, social networks "look for status in
society" as leading individuals. Thus, informal interaction channels in the form of strong social networks tend to have a very positive correlation with personal well-being (Lelkes 2006; Powdthavee, 2009; Helliwell & Barrington-Leigh, 2010). Some studies comparing social impacts on income and life satisfaction are considered similar if the interdependence between Putnam-type informal activities and happiness is not greater (Helliwell et al., 2009).
Powdthavee (2009) states that increasing the frequency of social contacts increases proportionally with life satisfaction.
However, other studies, such as Bjørnskov (2008), argue that this relationship is not strong. He argued that the cross- sectional analysis of the United States had no meaning for the informal sociability of happiness.
Some studies have found that formal social interactions are not clearly related to happiness. That is, some studies considering such variables have shown that Olson-type related activities, such as members of professional interest groups, have a negative correlation with happiness (Pichler, 2006; Leung et al., 2010). Leung et al. (2010) found that only political participation was important among the categories' variables. In contrast, community participation of the Putnam (2004) type is associated with an increase in well-being. Putnam (2000) estimated that the effect of linkage activity on happiness in the United States was equivalent to a 100% increase in income or four years of additional education. Studies in Europe have shown that more participation in non-political or non-economic organizations or clubs, rather than individuals, increases life satisfaction (Pichler, 2006). Helliwell (2003) and Helliwell and Putnam (2004) have similar conclusions to the United States.
In summary, although most indicators have vague results, social capital is generally linked to higher levels of happiness. Since there is no consistent definition, indicators of social capital vary widely from study to study. The focus is on the United States and Canada, which can be regarded as relatively homogeneous in terms of social capital and happiness (Putnam, 2000). But as can be seen in Europe, social capital and happiness vary greatly from country to country. According to Oswald (1997), more than half of the citizens in Europe have very high personal well-being scores, while in the south the proportion is only one-tenth. Similar results were found for social capital. Scandinavians have very high social capital scores in all three dimensions, while Eastern European countries have very low social capital scores. Low levels of confidence in both humans and institutions are common in southern Europe and much lower than in western and northern Europe (Van Oorschot, Arts, &
Gelissen, 2006). Because of this contrast of social capital scores, the relationship with personal well-being can vary considerably between Europe and the United States.
3. Research Design 3.1. Research Model
This research model aims to identify the components of social capital based on the theoretical background in the previous chapter and achieve the purpose of research in identifying how these factors (social networks, social norms, social trust) will affect personal well-being. This is set as shown in Figure 1.
Figure 1: Research Model
3.2. Social Capital
In this study, social capital, an independent variable, was divided into social networks, social norms, and social trust.
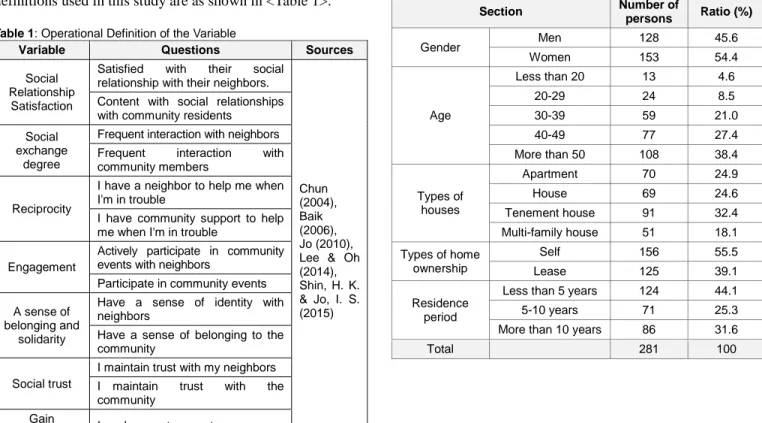
The social network consists of the satisfaction of social relations and the degree of social exchange. The social norms consist of reciprocity, participation, belonging and solidarity. The moderating effects of age, gender, length of stay, and type of housing were measured. The operational definitions used in this study are as shown in <Table 1>.
Table 1: Operational Definition of the Variable
Variable Questions Sources
Social Relationship Satisfaction
Satisfied with their social relationship with their neighbors.
Chun (2004), Baik (2006), Jo (2010), Lee & Oh (2014), Shin, H. K.
& Jo, I. S.
(2015) Content with social relationships with community residents
Social exchange
degree
Frequent interaction with neighbors Frequent interaction with community members
Reciprocity
I have a neighbor to help me when I'm in trouble
I have community support to help me when I'm in trouble
Engagement
Actively participate in community events with neighbors
Participate in community events A sense of
belonging and solidarity
Have a sense of identity with neighbors
Have a sense of belonging to the community
Social trust
I maintain trust with my neighbors I maintain trust with the community
Gain
happiness I am happy at present
3.3. Data Collection and Analysis Method
To collect data from this study, 300 questionnaires were distributed to distributors over a 20-day period from July 20 to August 10, 2019, using the questionnaire method. The questionnaire was collected and 281 copies were used for empirical analysis. The collected data were analyzed using IBM SPSS 21.0 and AMOS 21.0.
4. Results
4.1. Characteristics of Research Subjects
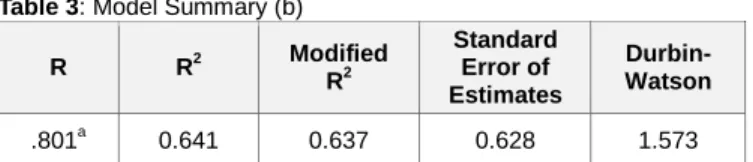
The demographic characteristics of the respondents in this study were 128 males (45.6%) and 153 females (54.4%).
The age group consisted of 13 under 20s with 4.6%, 24 in 20s with 8.5%, 30 in 59s with 21.0%, 77 in 40s with 27.4%, and over 50s with 33.4%. Among them, the age group of more than 50 respondents were accounted for as having the highest number. Among the housing types, apartments were 70 with 24.9%, detached houses 69 with 24.9%, townhouses 91 with 32.4%, and the majority being 51 households, with 18.1%. As for the types of residence, self-owned people accounted for 55.6% of 156 people and rents of 39.1% of 125 people. As for the number of years of residence, 44.1%
were under 5 years, 71 was 25.3% under 5-10 years, and 86 was 31.6% over 10 years, as shown in <Table 2>.
Table 2: Demographic Characteristics of the Interviewees
Section Number of
persons Ratio (%)
Gender Men 128 45.6
Women 153 54.4
Age
Less than 20 13 4.6
20-29 24 8.5
30-39 59 21.0
40-49 77 27.4
More than 50 108 38.4
Types of houses
Apartment 70 24.9
House 69 24.6
Tenement house 91 32.4
Multi-family house 51 18.1 Types of home
ownership
Self 156 55.5
Lease 125 39.1
Residence period
Less than 5 years 124 44.1
5-10 years 71 25.3
More than 10 years 86 31.6
Total 281 100
4.2. Regression Model Analysis
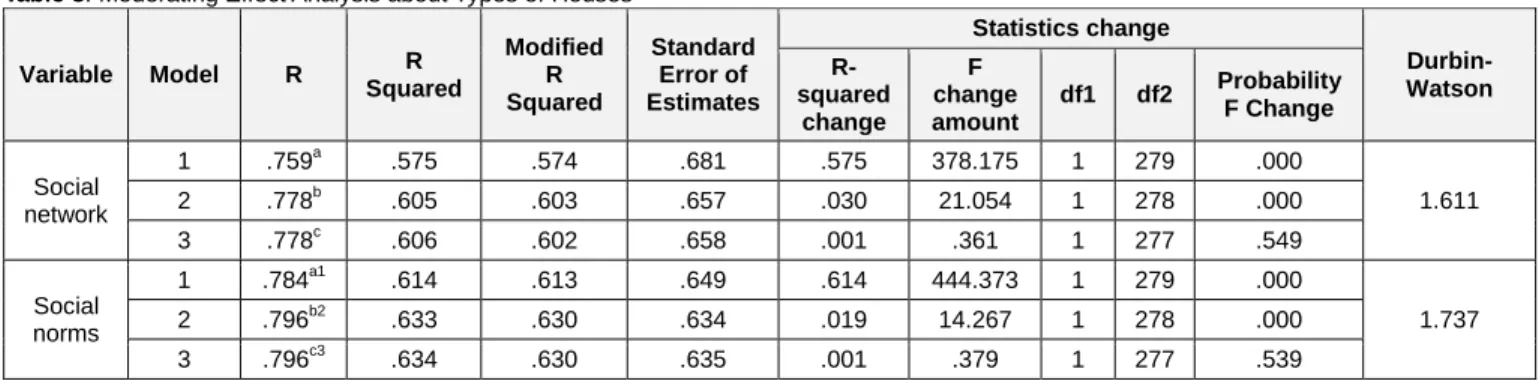
As a result of regression analysis to analyze the effects of independent variables on personal happiness, the results were as shown in <Table 3> and <Table 4>. Therefore, as a result of the analysis, the regression model on the effect of social capital on personal well-being is within the significance level (p <0.05), which is a significant regression model.
According to <Table 3>, three independent variables, social network, social norm, and social credibility, accounted for about 64.1% of personal well-being.
According to <Table 4>, the results of analyzing the significance of the model indicate that F = 164.768 and p = 0.000 are very significant regression intangibles.
Table 3: Model Summary (b)
R R2 Modified
R2
Standard Error of Estimates
Durbin- Watson
.801a 0.641 0.637 0.628 1.573
a Predicted value: (Constant), Social network, Social norms, Social trust
b Dependent variable: Personal happiness
Table 4: Model Significance (a) Division Sum of
squares
Degree of freedom
Mean
squared F Signifi- cance Regression 195.134 3 65.045 164.768 .000b
Residual 109.35 277 0.395
Sum 304.484 280
a Dependent variable: Personal happiness
b Predicted value: (Constant), Social network, Social norms, Social trust
The regression analysis of <Table 5> shows that 'social network' factor is 3.705 + 0.308 = 4.013, 'social norm' factor is 3.705 + 0.425 = 4.130, and 'social trust' factor is 3.705 + 0.161 = 3.866. However, the 'social trust' factor has a significant probability of 0.065, which does not have a significant effect on the ‘personal happiness' factor beyond the range of the general significance level (<0.05). In particular, the regression analysis should be noted on the multicollinearity of the independent variables. Since the VIFs of the independent variables are all 10 or less, it can be judged that there is no problem with the multicollinearity.
The regression coefficient values of the independent variables can be summarized as standardized coefficients as shown in Figure 2.
Table 5: Coefficient
Division Non-standardized coefficient Standardized
coefficient t Significance Collinearity statistics
B Standard error β Tolerance VIF
(Constant) 3.705 .037 98.839 .000
Social network .308 .082 .285 3.754 .000 .225 4.446
Social norms .425 .105 .396 4.034 .000 .135 7.417
Social trust .161 .087 .154 1.852 .065 .187 5.339
Figure 2: Research Model Verification Result
4.3. Analysis of the Moderating Effects of Control Variables
On the other hand, hierarchical regression was conducted to verify the moderating effects of gender, age, type of
residence, type of home ownership, and length of residence in the effects of social networks and social norms on personal happiness. In the first stage (Model 1), we examined the effects of the independent variables, social networks and social norms on personal well-being. In the third stage (Model 3), the interaction variables between independent variables and control variables were input. In order to solve the problem of multicollinearity, independent and control variables were analyzed by the standardization transformation.
4.3.1. Gender Moderating Effect Analysis
As a result of the moderating effect analysis on the gender of the research model, the 'social network' factor showed the R-squared change of 0.013 and the 'social norm' factor with a moderating effect of 0.002. This showed relatively more impact on the network <Table 6>.
Table 6: Moderating Effect Analysis about Gender
Variable Model R R squared
Modified R squared
Standard error of estimates
Statistics change
Durbin- Watson R-
squared change
F change amount
df1 df2 Probability F Change
Social network
1 .759a .575 .574 .681 .575 378.175 1 279 .000
1.789
2 .801b .641 .639 .627 .066 50.947 1 278 .000
3 .809c .654 .651 .616 .013 10.606 1 277 .001
Social norms
1 .784a1 .614 .613 .649 .614 444.373 1 279 .000
1.703
2 .802b2 .643 .640 .626 .028 21.951 1 278 .000
3 .803c3 .645 .641 .625 .002 1.863 1 277 .173
a Forecast: (Constant),Social network b Forecast: (Constant), Social network, Gender
c Forecast: (Constant), Social network Gender, Social network × Gender a1 Forecast: (Constant), Social norms
b2 Forecast: (Constant), Social norms, Gender
c3 Forecast: (Constant), Social norms, Gender, Social norms × Gender Dependent variable: Euphoria
4.3.2. Analysis of Moderating Effect by Age
The analysis of the moderating effect on the age of the research model showed that the 'social network' factor had
an R-squared change of 0.001 and the 'social norm' factor did not change to 0.000, which only partially affected the 'social network' <Table 7>.
Table 7: Moderating Effect Analysis about Age
Variable Model R R
Squared
Modified R Squared
Standard Error of Estimates
Statistics change
Durbin- Watson R-
squared change
F change
amount df1 df2 Probability F Change
Social network
1 .759a .575 .574 .681 .575 378.175 1 279 .000
1.493
2 .760b .577 .574 .680 .002 1.169 1 278 .281
3 .760c .578 .573 .681 .001 .343 1 277 .558
Social norms
1 .784a1 .614 .613 .649 .614 444.373 1 279 .000
1.685
2 .795b2 .631 .629 .636 .017 12.773 1 278 .000
3 .795c3 .631 .627 .637 .000 .095 1 277 .758
a Forecast: (Constant), Social network b Forecast: (Constant), Social network, Age
c Forecast: (Constant), Social network, Age, Social network × Age a1 Forecast: (Constant), Social norms
b2 Forecast: (Constant), Social norms, Age
c3 Forecast: (Constant), Social norms, Age, Social norms × Age Dependent variable: Euphoria
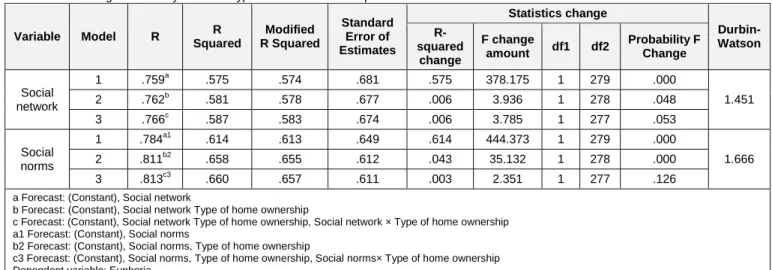
4.3.3. Analysis of Moderating Effect by Housing Type The analysis of the moderating effect on the type of residence of the research model showed that the 'social
network' factor had a moderating effect of 0.001 R-squared variation and the 'social norm' factor of 0.001 <Table 8 >.
Table 8: Moderating Effect Analysis about Types of Houses
Variable Model R R
Squared
Modified R Squared
Standard Error of Estimates
Statistics change
Durbin- Watson R-
squared change
F change amount
df1 df2 Probability F Change
Social network
1 .759a .575 .574 .681 .575 378.175 1 279 .000
1.611
2 .778b .605 .603 .657 .030 21.054 1 278 .000
3 .778c .606 .602 .658 .001 .361 1 277 .549
Social norms
1 .784a1 .614 .613 .649 .614 444.373 1 279 .000
1.737
2 .796b2 .633 .630 .634 .019 14.267 1 278 .000
3 .796c3 .634 .630 .635 .001 .379 1 277 .539
a Forecast: (Constant), Social network
b Forecast: (Constant), Social network, Residence type
c Forecast: (Constant), Social network, Residence type, Social network × Residence type a1 Forecast: (Constant), Social norms
b2 Forecast: (Constant), Social norms, Residence type
c3 Forecast: (Constant), Social norms Residence type, Social norms × Residence type Dependent variable: Euphoria
4.3.4. Analysis of the Moderating Effect by Type of Housing Ownership
As a result of the moderating effect analysis on the type of home ownership of the research model, the 'social
network' factor has a moderating effect of 0.006 R-squared change and the 'social norm' factor is 0.003. It has been shown to have a greater impact on 'social networks' than ’social norm’ <Table 9>.
Table 9: Moderating Effect Analysis about Types of Home Ownership
Variable Model R R
Squared
Modified R Squared
Standard Error of Estimates
Statistics change
Durbin- Watson R-
squared change
F change
amount df1 df2 Probability F Change
Social network
1 .759a .575 .574 .681 .575 378.175 1 279 .000
1.451
2 .762b .581 .578 .677 .006 3.936 1 278 .048
3 .766c .587 .583 .674 .006 3.785 1 277 .053
Social norms
1 .784a1 .614 .613 .649 .614 444.373 1 279 .000
1.666
2 .811b2 .658 .655 .612 .043 35.132 1 278 .000
3 .813c3 .660 .657 .611 .003 2.351 1 277 .126
a Forecast: (Constant), Social network
b Forecast: (Constant), Social network Type of home ownership
c Forecast: (Constant), Social network Type of home ownership, Social network × Type of home ownership a1 Forecast: (Constant), Social norms
b2 Forecast: (Constant), Social norms, Type of home ownership
c3 Forecast: (Constant), Social norms, Type of home ownership, Social norms× Type of home ownership Dependent variable: Euphoria
4.3.5. Analysis of Moderating Effect by Years of Residence
As a result of the adjustment effect on the residence period of the research model, the 'social network' factor
showed 0.000 squared change in R, and the 'social norm' factor to be 0.000, and there was no control effect
<Table10>.
Table 10: Moderating Effect Analysis about Residence Period
Variable Model R R
squared
Modified R Squared
Standard Error of Estimates
Statistics change
Durbin- Watson R-
squared change
F change
amount df1 df2 Probability F Change
Social network
1 .759a .575 .574 .681 .575 378.175 1 279 .000
1.510
2 .759b .576 .573 .682 .000 .069 1 278 .794
3 .759c .576 .571 .683 .000 .199 1 277 .656
Social norms
1 .784a1 .614 .613 .649 .614 444.373 1 279 .000
1.631
2 .786b2 .618 .615 .647 .003 2.516 1 278 .114
3 .786c3 .618 .614 .648 .000 .009 1 277 .926
a Forecast: (Constant), Social network
b Forecast: (Constant), Social network Residence period
c Forecast: (Constant), Social network, Residence period, Social network × Residence period a1 Forecast: (Constant), Social norms
b2 Forecast: (Constant), Social norms Residence period
c3 Forecast: (Constant), Social norms, Residence period, Social norms × Residence period Dependent variable: Euphoria
5. Conclusion
5.1. Summary and Implications
This study comprehensively examines previous studies on social capital and personal well-being, and classifies social capital into social networks, social norms, and social trust. It also selects personal happiness that they affect as
dependent variables. The social network consists of the satisfaction of social relations and the degree of social exchange. The social norms consist of reciprocity, participation, belonging and solidarity. The moderating effects of age, gender, length of stay, and type of housing were measured. Additionally, the purpose of this study was to analyze the research data, identify the factors that are important to personal well-being, suggest implications for them, and provide data to help organize the importance and components of social capital. In order to achieve the purpose of the study, the survey conducted a survey of people in the retail industry. The collected data were analyzed using IBM SPSS 21.0 and AMOS 21.0 programs. The detailed analysis results are as follows.
First, the regression formula created to analyze the influence of independent variables on personal happiness, namely, 34.1 independent variables, social network, social norms, and social credibility, accounted for about 64.1% of individual happiness. The analysis shows F = 164.768 and p
= 0.000, indicating that the regression is very significant. In regression analysis, it is important to note on the multicollinearity of the independent variables. Since the VIFs of the independent variables are all less than 10, it can be judged that there is no problem with the multicollinearity.
Second, the results of the regression analysis show that the 'social network' factor is 3.705 + 0.308 = 4.013, the 'social norm' factor is 3.705 + 0.425 = 4.130, and the 'social trust' factor is 3.705 + 0.161 = 3.866. However, the 'social trust' factor has a significance probability of 0.065, which does not have a significant effect on the ‘personal happiness' factor beyond the range of the general significance level (<0.05).
Third, as a result of the analysis of the moderating effect on gender of the research model, the 'social network' factor has a moderating effect of R squared change of 0.013 and the 'social norm' factor of 0.002. It was thus shown to be relatively more influential. In addition, as a result of analyzing the moderating effect on the age of the research model, the 'social network' factor showed a change in the R- squared change of 0.001 and the 'social norm' factor did not change to 0.000, which only partially affected the 'social network'.
According to the analysis of the moderating effect on the type of residence, the 'social network' factor had a moderating effect of 0.001 R-squared change and the 'social norm' factor 0.001. Additionally, as a result of the moderating effect analysis on the type of home ownership, the 'social network' factor had a moderating effect of 0.006 R-squared change and the 'social norm' factor of 0.003. It has thus been shown to have a relatively higher effect. As a result of the adjustment effect on the length of residence, the factor of 'social network' was found to have a R-squared change of 0.000, and the factor of 'social norm' was 0.000.
Therefore, it was analyzed that there is a moderating effect according to gender, age, type of residence, and type of house ownership, and that there is no moderating effect according to residence.
5.2. Limitations and Research Directions
Although this study presented various analysis results to enhance personal happiness, there were some limitations as follows. First, the questionnaire of this study was conducted for people living in specific areas such as Seoul and Chungcheong-do. Therefore, in future studies, it will be easier to generalize the research results by widening the survey area. Second, this study did not consider enough variables, so there was a limitation in studying only social capital (social network, social norms, social trust), which were the variables of interest to the researcher. Of course, even if there is no generalized definition of this, it is necessary to study more widely and deeply by applying various types of concepts. In the future, it will be necessary to examine the relevant variables in a comprehensive manner and to supplement them continuously.
References
Alesina, A., DiTella, R., & MacCulloch, R. (2004).
Inequality and happiness: Are Europeans and Americans different? Journal of Public Economics, 88, 2042–2209.
Baik, M. J. (2006). A study on factors associated with social capital: Focusing on participation in NGO. (Doctorial dissertaion, Deajeon University).
Bartolini, S., Bilancini, E., & Pugno, M. (2008). Did the decline in social capital depress Americans’ happiness?
Quaderni del Dipartimento di Economia Politica, Universita Degli Studi Siena.
Bjørnskov, C. (2003). The happy few: Cross-country evidence on social capital and life satisfaction. Kyklos, 56(1), 3–16.
Chun, H. S. (2004). A study on the social capital of apartment complex in large cities. The Journal of Korean Sociological Association. 38(4), 215-247.
Clark, A., & Oswald, A. (1994). Unhappiness and unemployment. The Economic Journal, 104(424), 648–
659.
Coleman, J. (1988). Social capital in the creation of human capital. American Journal of Sociology, 94, S95– S120.
DiTella, R., MacCulloch, R., & Oswald, A. (2001).
Preferences over inflation and unemployment: Evidence from surveys of happiness. The American Economic Review, 91(1), 335–341.
Easterlin, R. (1974). Does economic growth improve the human lot? Some empirical evidence. In P. David & M.
Reder (Eds.), Nations and households in economic growth: Essays in Honor of Moses Abramowitz (pp. 89–
125), New York: Academic Press.
Easterlin, R. (1995). Will raising the incomes of all increase the happiness of all? Journal of Economic Behavior &
Organization, 27(1), 35–48.
Frey, B., & Stutzer, A. (2002). Happiness and economics:
How the economy and institutions affect wellbeing.
Princeton: Princeton University Press.
Gerdtham, U. G., & Johannesson, M. (2001). The relationship between happiness, health and socio- economic factors: Results based on Swedish micro data.
Journal of Socio-Economics, 30(6), 553–557.
Helliwell, J. (2006). Well-being, social capital and public policy: What’s new? The Economic Journal, 116, C34–
C45.
Helliwell, J., & Barrington-Leigh, C. (2010). How much is social capital worth? NBER working papers. Working Paper NY 16025, National Bureau of Economic Research.
Helliwell, J., & Putnam, R. (2004). The social context of well-being. Philosophical Transactions of the Royal Society, London B., 359, 1435–1446.
Helliwell, J., & Wang, S. (2011). Trust and well-being.
International Journal of Well-being, 1(1), 42–78.
Hudson, J. (2006). Institutional trust and subjective well- being across the EU. Kyklos, 59(1), 43–62.
Jo, K. J. (2010). Social capital in Seoul. Seoul Development Institute, 70, 1-26.
Keefer, P., & Knack, S. (1997). Does social capital have an economic payoff? A cross country investigation.
Quarterly Journal of Economics, 112(4), 1251–1288.
Knack, S. (2003). Groups, growth and trust: Cross-country evidence on the Olson and Putnam Hypotheses. Public Choice, 117, 341–355.
Layard, R. (2005). Happiness: Lessons from a new science.
London: Penguin Press.
Lee, J. H., & Oh, M. O. (2014). A study on the effects of social capital on subjective happiness of Geoje Residents.
Journal of Korea Local Autonomy Administration, 28(3), 313-330.
Lelkes, O. (2006). Knowing what is good for you: Empirical analysis of personal preferences and the ‘‘objective good’’. The Journal of Socio-Economics, 35, 285–307.
Leung, A., Kier, C., Fung, T., Fung, L., & Sproule, R.
(2010). Searching for happiness: The importance of social capital. Journal of Happiness Studies, 12(3), 443–
462. doi: 10.1007/s10902-010-9208-8.
North, D. (1990). Institutions, institutional change and economic performance. New York: Cambridge University Press.
Oswald, A. (1997). Happiness and economic performance.
Economic Journal Royal Economic Society, 107(445), 1815–1831.
Paldam, M. (2001). Social capital: One or many? Definition and measurement. Journal of Economic Perspectives, 14, 629–653.
Paxton, P. (1999). Is social capital declining in the United States? A multiple indicator assessment. American Journal of Sociology, 105, 88–127.
Pichler, F. (2006). Subjective quality of life of young Europeans: Feeling happy but who knows why? Social Indicators Research, 75, 419–444.
Powdthavee, N. (2009). Putting a price tag on friends, relatives, and neighbours: Using surveys of life satisfaction to value social relationships. The Journal of Socio-Economics, 37(4), 1459–1480.
Putnam, R. (2000). Bowling alone: The collapse and revival of American Community. New York: Simon & Schuster.
Ram, R. (2010). Social capital and happiness: Additional cross-country evidence. Journal of Happiness Studies, 11, 409–418.
Rodrik, D. (1998). Where did all the growth go? External shocks, social conflict, and growth collapses. NBER Working Paper No. 6350, National Bureau of Economic Research, Cambridge.
Shin, H. K., & Jo, I. S. (2015). A study on the subjective happiness and social capital. Journal of the Korean Housing Association, 26(3), 99−108.
van Oorschot, W., Arts, W., & Gelissen, J. (2006). Social capital in Europe: Measurement and social and regional distribution of a multifaceted phenomenon. Acta Sociologica, 49(2), 149–167.
Woolcock, M., & Narayan, D. (2000). Social capital:
Implications for development theory, research, and policy. World Bank Research Observer, 15(2), 1–49.
Smelser, N., & Swedberg, R. (1994). The handbook of economic sociology (Eds.). Princeton, NJ: Princeton University Press.
Winkelmann, R. (2009). Unemployment, social capital, and subjective well-being. Journal of Happiness Studies, 10(4), 421–430.
Zak, P., & Knack, S. (2001). Trust and growth. The Economic Journal, 111, 295–321.