Number of sampling leaves for reflectance measurement of Chinese cabbage and kale
Sun-Ok Chung1, Viet-Duc Ngo1, Md. Shaha Nur Kabir1, Soon-Jung Hong2*, Sang-Un Park1, Sun-Ju Kim1, Jong-Tae Park1
1College of Agriculture and Life Sciences, Chungnam National University, Daejeon, 305-764, Korea
2Dept. of Agriculture Environment, Rural Development Administration, Suwon, Korea
Received on 28 July 2014, revised on 12 September 2014, accepted on 15 September 2014
Abstract : Objective of this study was to investigate effects of pre-processing method and number of sampling leaves on stability of the reflectance measurement for Chinese cabbage and kale leaves. Chinese cabbage and kale were transplanted and cultivated in a plant factory. Leaf samples of the kale and cabbage were collected at 4 weeks after transplanting of the seedlings. Spectra data were collected with an UV/VIS/NIR spectrometer in the wavelength region from 190 to 1130 nm. All leaves (mature and young leaves) were measured on 9 and 12 points in the blade part in the upper area for kale and cabbage leaves, respectively. To reduce the spectral noise, the raw spectral data were preprocessed by different methods: i) moving average, ii) Savitzky-Golay filter, iii) local regression using weighted linear least squares and a 1st degree polynomial model (lowess), iv) local regression using weighted linear least squares and a 2nd degree polynomial model (loess), v) a robust version of ‘lowess’, vi) a robust version of ‘loess’, with 7, 11, 15 smoothing points. Effects of number of sampling leaves were investigated by reflectance difference (RD) and cross-correlation (CC) methods. Results indicated that the contribution of the spectral data collected at 4 sampling leaves were good for both of the crops for reflectance measurement that does not change stability of measurement much. Furthermore, moving average method with 11 smoothing points was believed to provide reliable pre-processed data for further analysis.
Key words : Optical reflectance, Cabbage, Kale, Reflectance difference, Cross-correlation, Pre-processing
*Corresponding author: Tel: +82-31-238-9374 E-mail address: [email protected]
I. Introduction
Chinese cabbage (Brassica rapa, subspecies pekinensis and chinensis) is a Chinese vegetable in the brassica family, having a loose head of dark green leaves with thick white stems. It is sometimes called bok choy, Peking cabbage, or snow cabbage. The various names probably stem from the fact that there are numerous varieties of plants in this species (Wu et al., 2008).
Chinese cabbage is rich in Vitamin C, fiber, and folate. The color of the leaves suggest that it is rich in beta-carotene and calcium, especially in comparison to other types of cabbages that are less green. It is a vegetable that is generally low in fat but high in potassium (Lee et al., 2002). Chinese kale (Brassica
oleracea var. alboglabra Bailey), also called Kailaan or Chinese Broccoli, has glossy, blue-green leaves with crisp and thick stems. This vegetable adapts well to cold and hot climates and is grown all year round in Korea (Noichinda et al., 2007). Chinese kale vegetable plants, which are sweeter tasting than broccoli, are high in Vitamins A and C, and rich in calcium. There are two Chinese kale varieties, one with white flowers and one with yellow flowers. The white flower variety is popular and grows up to 19 inches high. The yellow flower plant only grows to about 8 inches tall. Both varieties are heat resistant and will grow through the winter in most areas (La et al., 2009).
The visible and near-infrared (400-2500 nm) have been identified as a popular region that are probably sense localized factors relating to the soil and crop.
Results from spectral reflectance measurements have
been widely used in agricultural research to evaluate such factor as: soil properties (Chang et al., 2000;
Shepherd and Walsh, 2001; Lee et al., 2010; Chung et al., 2011; Ge et al., 2011); nitrogen detection (Strachan et al., 2002; Rodriguez et al., 2006); weed detection (Feyaerts and Gool, 2001; Bossu et al., 2005); carotenoids and chlorophylls detection (Fridgen and Varco, 2004;
Gitelson et al., 2003; Gitelson et al., 2002); water content or water stress (Sims and Gamon, 2003; Zarco- Tejada et al., 2003); plant tress (Smith et al., 2004).
However, despite these research activities, spectral reflectance techniques have still not widely covered for commercial applications. A variety of nutrients and phytochemicals such as glucosinolate, anthocyanin, carotenoid that may work synergistically to help prevent cancer or nutritional supplement need to be detected and widely used.
There is no substitute for optimal data collection, but, after proper data collection, pre-processing of spectral data is the most important step before chemometric bi-linear modeling (Rinnan et al., 2009).
The most widely used pre-processing techniques can be divided into two groups: those which directly use available reference values for the pre-processing operation, and those that do not. The first group of scatter-corrective pre-processing methods includes Multiplicative Scatter Correction (MSC), Inverse MSC, Extended MSC (EMSC), Extended Inverse MSC, de- trending, Standard Normal Variate (SNV) and nor- malization. The spectral derivation group includes the following techniques: finite difference, Savitzky-Golay, and Norris-Williams. The methods use a smoothing of the spectra prior to calculating the derivative in order to decrease the detrimental effect on the signal-to-noise ratio that conventional finite difference derivatives would have (Sun, 2009).
Spectral measurements need to be accurate and precise representations of the target material but there are a variety of factors that affect the quality of spectral measurements. Careful consideration must
be given to the methods adopted to undertake spectral measurement, and to the variety of factors including the optical propagation and those environmental and experimental issues that can affect the quality of resultant spectral data (Pfitzner et al., 2006). There is little information on the accuracy of practical use of VIS/NIR spectroscopy. T o obtain high accurate measurement and save time for data collection, determination of sampling leaves is one of the important issues. Weir and Rochester (2011) reported that leaf samples between 30-50 leaves should supply sufficient fresh material for analysis. 50 leaf samples are enough for a sample. Collect 10 leaves per plant from shoots randomly selected from all sides of the plant and combine them into one sample was suggested by Phosyn Analytical (2008). For almonds and apricots analyses, 100 leaves are needed. In fruits and nuts species such as apples, peaches, pears, nectarines and pecans, 60 to 80 leaves were needed for the analysis as suggested by Viveros (2000). Table 1 summarized number of sampling leaves of some example crops (Reuter and Robinson, 1997):
However, despite these research activities, effects of sampling leaves have still not considered specifically.
Consequently, the aim of this study was to investigate effects of pre-processing method and number of sampling leaves on stability of the reflectance meas- urement for Chinese cabbage and kale leaves.
II. Materials and Methods
1. Plant material and leaf sampling
The experimental site was located in Precision Agriculture Lab, Chungnam National University, Republic of Korea. Two commonly consumed cruciferous vegetables in Korea including Chinese cabbage (Brassica rapa, subspecies pekinensis and chinensis) and kale (Brassica oleracea var. alboglabra Bailey) were selected in our experiements. Chinese cabbage and kale were grown
Table 1. Summary of no. of sampling leaves of example crops.
Crop Plant Part No. of Leaves
Avocado Leaves-recently expanded, mature and healthy. Non-fruiting terminals approx.
4-5 months old
20 leaves
Banana Strips 20 cm wide from each side of midrib from the center section of the third fully emerged leaf
6 plants, 2 leaves per plant
Citrus Healthy, mature leaves from middle of non-fruiting terminals of previous spring flush
50 leaves
Coffee 3rd or 4rd pair of leaves from tip of actively growing and bearing branches 10 trees, 4 leaves per tree Custard Apple Youngest mature leaf, from non-fruiting shoots only 20 leaves
Mango Latest mature leaves just prior to flowering 30 leaves
Macadamia 6-7 month old mature leaves from 2nd whorl or current season’s growth, from non-fruiting terminals
40 leaves
Olives Fully expanded basal to mid-shoot leaves 10 trees, 4 leaves per tree
Peach and Nectarine
Mature leaves from mid-portion of shoot, current season’s terminal growth 80 leaves
Pecan Pairs of leaflets from midway along youngest fully expanded leaf on fruiting wood. Select leaflets from branches up to 2 m above the ground
50 leaves
Table 2. Environmental conditions of Chinese cabbage and kale.
Item Growth condition
Light source, LED color ratio PPFD, µmol・m-2s-1
Humidity, % pH
EC, µS/cm
Day/night circle, hour CO2, ppm
Temperature, °C
R : B : W = 11 : 4 : 3 160
65 ± 5 6.0 ± 0.5 1,200 ± 90 16/8 1000 ± 100 20 ± 1
Fig. 1. Location of reflectance measurement for Chinese cabbage and kale leaves.
in a plant factory with the same growth conditions of light source, humidity, pH, and electrical conductivity (EC). Growth conditions of the crops were summarized in Table 2. A total of 10 sample crops were collected at 4 weeks after transplanting for optical reflectance measurement (5 crops for each species).
2. Spectral reflectance of leaf upper surface
By using an UV/VIS/NIR spectrometer (USB2000, Ocean Optics, FL, USA), spectral reflectance of all sample leaves were collected at wavelength bands from 190 to 1,130 nm in a dark condition. Spectral measurement was implemented by a light source
constructed with Deuterium–Tungsten Halogen (200~
1,000 nm) and two CCD detectors. The wavelength regions of two detectors were 190~890 nm (UV/VIS) and 470~1,130 nm (NIR), respectively. Spectra data were collected using the software provided by the manufacturer. Measurements were obtained over the inter-veinal blade part in the upper area of leaf, as suggested by our previous study (Ngo et al., 2013).
For each leaf measurement, 12 and 9 reflectance spectra were determined for cabbage and kale, respectively, and expressed as a mean (Fig. 1).
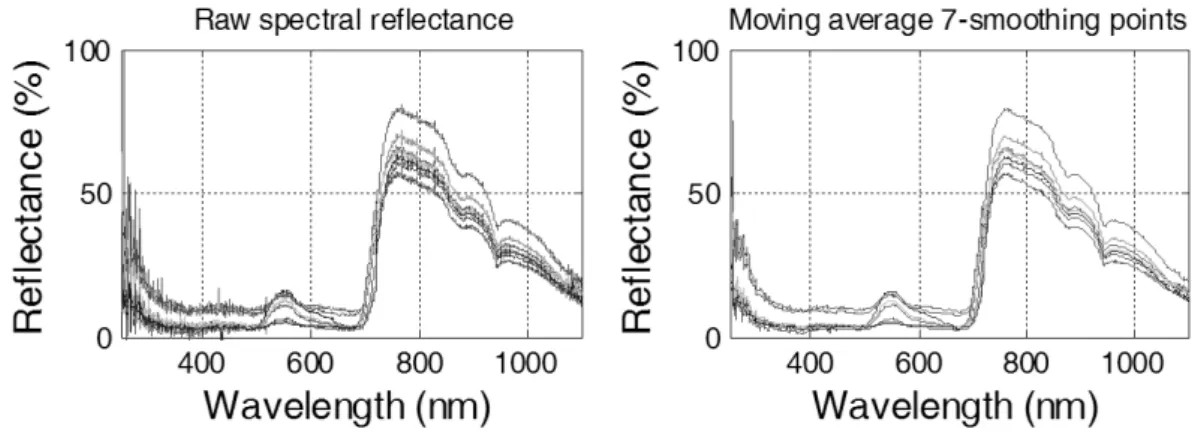
Fig. 2. The effect the moving average method with 7 smoothing points on example cabbage leaf spectra.
3. Analytical procedures
The spectra in the range of 250~1100 nm were used to analyze because the spectra out of that range were too noisy. Before analytical procedures were applied, reflectance data were necessary to remove high-noise measurement bands and improve accuracy of comparison.
To reduce the spectral noise, the raw spectral data were preprocessed by different methods: i) moving average, ii) Savitzky-Golay filter, iii) local regression using weighted linear least squares and a 1st degree polynomial model (lowess), iv) local regression using weighted linear least squares and a 2nd degree polynomial model (loess), v) a robust version of ‘lowess’
(rlowess), vi) a robust version of ‘loess’ (rloess), with 7, 11, 15 smoothing points. To describe the effects of number of sampling points and pre-processing methods, standard deviations of reflectance difference and cross-correlation methods were applied.
Reflectance difference spectroscopy (RDS), also known as reflectance anisotropic spectroscopy, measures changes in reflectivity as a function of the light polarization and is sensitive to optical anisotropy (Shioda and Weide, 1998). A reflectance difference (RD) between two reflectance spectral (r1 and r2) is defined as (Yasuda et al., 2003):
It is very effective in detecting slight differences and changes between two spectra. The calculation of difference spectra is useful to analyze perturbation-
dependent NIR spectra such as temperature-dependent, pH-dependent, or concentration-dependent spectra.
To calculate reliable difference spectra one must measure spectra with very high wavelength accuracy.
Correlation determines the degree of similarity between two spectra. If the spectra are identical, the correlation coefficients is 1; if they are totally different, the correlation coefficient is 0, and if they are identical except that the phase is shifted by exactly 180°, then the correlation coefficients is -1.
When two spectra are compared the procedure is known as cross-correlation, and when the same spectrum is compared to phase shifted copies of itself, the procedure is known as autocorrelation. Cross- correlation is the method which basically underlies implementations of the Fourier transformation: signals of varying frequency and phase are correlated with the input signal, and the degree of correlation in terms of frequency and phase represents the frequency and phase spectrum of the input signal (Yoo and Han, 2009). All of data analysis including pre-processing of the raw reflectance data, reflectance difference, cross-correlation and standard deviation were carried out using Matlab (ver. 7.10, The MathWorks, USA) software package.
III. Results and Discussion
Figure 2 shows the effect moving average method
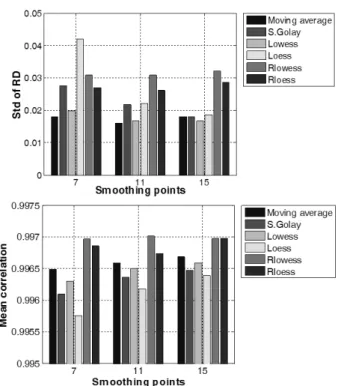
Fig. 3. Standard deviation of reflectance difference; and mean correlation between spectra of raw data and those of pre- processed data of an example kale plant.
Fig. 4. Standard deviation of cross-correlation from one example cabbage and kale plants.
have on an example spectra. Results of pre-processed spectra were less noisy than that of the raw data.
However, it is difficult to fully evaluate the relative distance between the spectra by simple inspection of Figure 2. Therefore, we totally evaluate effects of pre-processing methods through results of reflectance difference and cross-correlation analyses.
Reflectance difference between the spectra of raw data and those of pre-processed data can be calculated by subtracting the spectra of raw data from those of pre-processed data. To evaluate similarity between the spectra of raw data and those of pre-processed data, correlation between two spectra was examined.
Standard deviation of reflectance difference and correlation between the spectra of raw data and those of pre-processed data from a sample kale plant were described as shown in Figure 3.
As it can be observed from Figure 3, standard deviation of reflectance difference decreased whereas mean correlation between the spectra of raw data and those of pre-processed data increased as the number
of smoothing points increased. The increase and decrease of standard deviation from rlowess and rloess methods were not as obvious as the other methods. The difference between the spectra of raw data and that of rlowess, rloess data were higher than those of the other methods even though their cor- relations to the spectra of raw data were also higher than those of the others. Results of moving average method on reflectance difference and correlation procedure seem to be the best with low standard deviation of reflectance difference and high correlation to the spectra of raw data. Difference between the spectra of raw data and those of moving average data with 11 smoothing points was less than those with 7 and 15 smoothing points. Furthermore, its mean correlation was also quite similar between 11 and 15 smoothing points.
Cross-correlation method was applied to investigate effects of number of sampling leaves on stability of spectral measurement. By using Matlab, number of sampling leaves was selected randomly. Cross- correlation method was implemented between the spectra of raw data and those of each number of sampling leaves. Standard deviation of cross-correlation was then calculated and shown as Figure 4.
Correlation between averaged spectrum and individual reflectance spectrum increased as the number of
sampling leaves increased. Results of cross-correlation showed high values while reflectance measurements were carried out on 4 sampling leaves of cabbage and 2 sampling leaves of kale.
IV. Conclusions
Results of pre-processed data were less noisy than that of the raw data. Correlation between averaged spectrum and individual reflectance spectrum was high while reflectance spectra were applied by rlowess and rloess pre-processing methods. Their variability, however, was also high whereas preprocessed data using moving average showed low variability and high correlation. Moving average smoothing method could provide reflectance spectra of reliable representation as well as the other methods. To determine the optimal number of sampling leaves, standard deviation of RD and CC decreased as the number of leaves increased.
Cross correlation showed high value while reflectance measurements were carried out on 4 sampling leaves of cabbage and 2 sampling leaves of kale.
Acknowledgement
This research was supported by Korea Institute of Planning and Evaluation for Technology in Food, Agriculture, Forestry and Fisheries (Project No. 311022- 05-1-SB030), Ministry for Food, Agriculture, Forestry and Fisheries, Republic of Korea.
References
Bossu J, Gée C, Guillemin JP, Truchetet F. 2005. Feasibility of a real-time weed detection system using spectral reflectance.
Precision Agriculture 5:123-130.
Chang CW, David AL, Maurice JM, Charles RH. 2000.
Near-infrared reflectance spectroscopy-principal components regression analyses of soil properties. Soil Science Society of America Journal 65(2):480-490.
Chung SO, Jung KY, Sudduth KA. 2011. Estimation of Korean paddy field soil properties using optical reflectance. Journal of Biosystems Engineering 36(1):33-39.
Feyaerts F, Gool LV. 2001. Multi-spectral vision system for weed detection. Pattern Recognition Letters 22(6-7):667-674.
Fridgen JL, Varco JJ. 2004. Dependency of cotton leaf nitrogen, chlorophyll, and reflectance on nitrogen and potassium availability. Agronomy Journal 96(1):63-69.
Ge Y, Morgan CLS, Grunwald S, Brown DJ, Sarkhot DV.
2011. Comparison of soil reflectance spectra and calibration models obtained using multiple spectrometers. Geoderma 161:202-211.
Gitelson AA, Gritz Y, Merzlyak MN. 2003. Relationships between leaf chlorophyll content and spectral reflectance and algorithms for non-destructive chlorophyll assessment in higher plant leaves. Journal of Plant Physiology 160(3):271-282.
Gitelson AA, Zur Y, Chivkunova YB, Merzlyak MN. 2002.
Assessing carotenoid content in plant leaves with reflectance spectroscopy. Photochemistry and Photobiology 75(3):272-281.
La GX, Fang P, Teng YB, Li YJ, Lin XY. 2009. Effects of CO2 enrichment on the glucosinolate contents under different nitrogen levels in bolting stem of Chinese kale (Brassica alboglabra L.). Journal of Zhejiang University Science B 10(6):454-464.
Lee KS, Sudduth KA, Drummond ST, Lee DH, Kitchen NR, Chung SO. 2010. Calibration methods for soil property estimation using reflectance spectroscopy. Transactions of the ASABE 53(3):675-684.
Lee MJ, Popkin BM, Kim SW. 2002. The unique aspects of the nutrition transition in South Korea: the retention of healthful elements in their traditional diet. Public Health Nutrition 5(1a):197-203.
Ngo VD, Kang SW, Ryu DK, Chung SO, Park SU, Kim SJ, Park JT. 2013. Location and number of sampling for optical reflectance measurement of Chinese cabbage and kale leaves.
Agricontrol, 4(1):241-246.
Noichinda S, Bodhipadma K, Mahamontri C, Narongruk T, Ketsa S. 2007. Light during storage prevents loss of ascorbic acid, and increases glucose and fructose leaves in Chinese kale (Brassica oleracea var. alboglabra). Postharvest Biology and Technology 44:312-315.
Pfitzner K, Bollhöfer A, Carr G. 2006. A standard design for collecting vegetation reference spectra: Implementation and implications for data sharing. Journal of Spatial Science 52(2):79-92.
Phosyn Analytical. 2008. Technical note grapevine leaf and petiole sampling protocol. Controlled Document: PAGV1.
Reuter DJ, Robinson JB. 1997. Plant analysis: an interpretation manual. Collingwood, Vic. : CSIRO Publishing.
Rinnan A, Berg FVD, Engelsen SB. 2009. Review of the most common pre-processing techniques for near-infrared spectra.
Trends in Analytical Chemistry 28(10):1201-1222.
Rodriguez D, Fitzgerald GJ, Belford R, Christensen LK. 2006.
Detection of nitrogen deficiency in wheat from spectral reflectance indices and basic crop eco-physiological concepts.
Australian Journal of Agricultural Research 57(7):781-789.
Shepherd KD, Walsh MG. 2001. Development of reflectance
spectral libraries for characterization of soil properties. Soil Science Society of America Journal 66(3):988-998.
Shioda R, Weide JVD. 1998. Reflectance difference spectroscopy of highly oriented (2x1) reconstructed Si(001) surfaces.
Physical Review B 57(12):6823-6825.
Sims DA, Gamon JA. 2003. Estimation of vegetation water content and photosynthetic tissue area from spectral re- flectance: A comparison of indices based on liquid water and chlorophyll absorption features. Remote Sensing of Environment 84(4):526-537.
Smith KL, Steven MD, Colls JJ. 2004. Use of hyperspectral derivative ratios in the red-edge region to identify plant stress responses to gas leaks. Remote Sensing of Environment 92(2):207-217.
Strachan IB, Pattey E, Boisvert JB. 2002. Impact of nitrogen and environmental conditions on corn as detected by hyperspectral reflectance. Remote Sensing of Environment 80(2):213-224.
Sun DW. 2009. Infrared spectroscopy for food quality analysis and control. Part I: Fundamentals and instruments. Ch. 2:
Data pre-processing: 29-48.
Viveros M. 2000. Sampling Procedures for Foliar Analysis.
UCCE Farm Advisor, Kern County. Deciduous Tree Fruits and Nuts.
Weir D, Rochester I. 2011. Leaf sampling and analyses. Part of the CottASSIST suite of tools.
Wu D, Feng L, He Y, Bao Y. 2008. Variety identification of Chinese cabbage seeds using visible and near-infrared spectroscopy. Transactions of the ASABE 51(6):2193-2199.
Yasuda T, Kumagai N, Nishizawa M, Yamasaki S, Oheda H, Yamabe K. 2003. Layer-resolved kinetics of Si oxidation investigated using the reflectance difference oscillation method. Physical Review B 67(19):195338.
Yoo JC, Han TH. 2009. Fast normalized cross-correlation.
Circuits, Systems and Signal Processing 28:819-843.
Zarco-Tejada PJ, Rueda CA, Ustin SL. 2003. Water content estimation in vegetation with MODIS reflectance data and model inversion methods. Remote Sensing of Environment 85(1):109-124.