1. 서 론
2008년 수도권 지하철을 이용한 승객은 하루 평균
약 460만 명(Korail, 2009)이었으며, 지하철의 확장으 로 이용객의 수는 더욱 증가할 전망이다. 통계자료에 따르면 2008년 한 해 동안 전국에서 2,142백만 명이 지하철을 이용하여 2007년에 비해서 약 2.5% 증가 하였다. 지하철의 수송분담율은 약 16.5%로서 자동 차에 이어 두 번째로 높은 수준이었으며(MLTMA, J. KOSAE Vol. 27, No. 2 (2011) pp. 142~151
Journal of Korean Society for Atmospheric Environment DOI: 10.5572/KOSAE.2011.27.2.142
수도권 전동차에서의 공기질 현황 및 다변량 통계분석을 이용한 공기질 영향인자 분석
Air Quality in the Subway Cabins of the Seoul Metropolitan Area and Analysis of Its Influencing Factors Using
Multivariate Statistics
박은영1),2)∙박덕신2),*∙조영민2)∙권순박2)∙최경희3)∙권명희3)
1)과학기술연합대학원대학교, 2)한국철도기술연구원, 3)국립환경과학원 (2010년 7월 8일 접수, 2010년 8월 19일 수정, 2011년 1월 12일 채택)
Eun-Young Park1),2), Duckshin Park2),*, Youngmin Cho2), Soon-Bark Kwon2), Kyunghee Choi3) and Myunghee Kwon3)
1)University of Science and Technology, 2)Korea Railroad Research Institute
3)Indoor Environmental Research Division, National Institute of Environmental Research (Received 8 July 2010, revised 19 August 2010, accepted 12 January 2011)
Abstract
In this study, we have observed PM-10 and CO2concentration in the subway cabins and analyzed the factors affecting air quality using a multivariate statistical analysis. The measurements have been conducted at Seoul metro- politan subway lines. The results show that the mean concentration of the PM-10 and CO2inside subway cabins is in the range of 62.6 to 108.0μg/m3and 907 to 2,008 ppm, respectively. CO2level in specific sections during the rush hours has exceeded air quality guidelines for public transportation, which requires designated train ventilation controls. Correlation and regression analyses of influencing factors imply that CO2level is severely influenced by the number of passengers and PM-10 level is also correlated with the number of passengers. In particular, PM-10 level in the cabins indicates a positive correlation with outdoor PM-10 level. In addition, the PM concentration has been highly affected by the number of passengers and distance between stations.
Key words : Indoor air quality, PM-10, CO2, Subway, Regression analysis
*Corresponding author.
Tel : +82-(0)31-460-5367, E-mail : [email protected]
2009), 분담율은 매년 증가하는 추세이다.
대중교통수단의 공기질에 대한 연구는 대중교통수 단에서의 오염물질 노출량 파악(Morabia and Ams- tislavski, 2009; Tsai et al., 2008; Lau and Chan, 2003;
Adams et al., 2001), 역사에서의 오염물질 현황 분석 (Cheng et al., 2009; Murruni et al., 2009; Salma et al., 2009; Cheng et al., 2008; Salma et al., 2007; Aarnio et al., 2005), 실시간 측정 장비를 이용한 객실 오염물질 분석(Som et al., 2007; Braniˇs, 2006; Li et al., 2006) 등 공기질 측정위주의 연구와 실내공기오염에 대한 모델 개발(Shek and Chan, 2008; Wong et al., 2008;
Halios and Helmis, 2007; Zhao and Wu, 2007; Zhao et al., 2007; Wong et al., 2006) 등이 주로 진행된 바 있 다. 국내에서도 지하철 전동차나 역사에서 오염물질 농도 분포(Kim et al., 2008; Park and Ha, 2008; Cho et al., 2006)에 대한 연구가 활발히 진행되고 있으나, 수도권 전동차 전체 노선에 대한 공기질 현황 분석 이나 오염 영향인자를 파악하기 위한 시도는 아직까 지 없었다.
본 연구에서는 현재 운행 중인 수도권 전동차 전체 노선에 대한 공기질 현황을 분석하고, 다변량 통계분 석을 이용하여 PM-10 및 CO2등의 영향인자를 파악 하였다. 이를 위해 수도권 전동차 전체 노선(수도권 1~8호선 및 분당선)에서 첨두 시간대와 비첨두 시 간대에 평상시 운행조건에서 공기질을 측정하였다.
측정데이터 이외에 온도, 습도 및 승객수 등 공기질 영향인자들을 동시에 수집하여 분석하였으며, 환경부 대기측정망(TMS; telemetering system) 자료를 입수하 여 외기와의 상관성을 분석하였다. 수집된 자료를 근
거로 PM-10 및 CO2농도의 공기질 영향인자와의 상 관관계 및 다변량 통계분석을 수행하여 오염 원인에 대한 보다 심층적인 분석을 시도하였다. 연구결과는 향후 대중교통수단에서의 공기질 제어장치 개발과 공기질 관리의 기초자료로 활용할 수 있을 것으로 기 대된다.
2. 연구방법
2. 1 대상 지역
본 연구에서는 수도권 전동차 노선인 전동차 1~8 호선 및 분당선 등 총 9개 노선을 연구대상으로 하 였다. 측정 구간 중 1호선의 경우 승객 혼잡도가 가 장 높고 급행노선인 동인천역~용산역 구간을 선택 하였다. 그 이외 노선은 전 노선을 측정구간으로 하 였으며, 표 1에 수도권 전동차 노선도를 나타내었다.
2. 2 측정 방법 및 항목
전동차 공기질은 추계(2008년 10월), 동계(2009년 1월) 및 춘계(2009년 4월) 등 총 세 차례 출근시간대 와 낮 시간 등으로 구분하여 PM-10과 CO2등 대중 교통수단 실내공기질 관리가이드라인의 대상 물질에 대해서 측정하였다. 환경부의 대중교통수단 실내공기 질 관리가이드라인은 표 2와 같다. 공기질 영향인자 인 외기조건(온도, 습도, 풍속, PM-10 등)과 객실조건 (승객수, 온도, 습도, 역간 운행시간, 문열림 시간 등) 에 대한 자료도 수집하여 분석 자료로 활용하였다.
또한 역간 거리, 지상∙지하구간 구분 및 지하구간에
Table 1. Sampling information.
Total Distance # of ground Ratio of
Depth Section length between adjacent station/# of underground stations
(km) stations (km) underground station to total stations (%) (m)
Line 1 Dongincheon-Yongsan 33.9 2.6 14/0 0 -
(express)
Line 2 Seongsu-Seongsu 48.8 1.1 10/34 77.3 12.7
(outer cycle)
Line 3 Daehwa-Suseo 54.1 1.4 3/37 92.5 15.8
Line 4 Danggogae-Oido 70.2 1.5 19/29 60.4 15.8
Line 5 Banghwa-Sangildong 45.2 1.1 0/44 100 23.2
Line 6 Eungam-Bonghwasan 35.1 0.9 0/38 100 24.0
Line 7 Jangam-Onsu 46.9 1.1 3/39 92.9 23.5
Line 8 Moran-Amsa 17.7 1.1 0/17 100 19.6
Bundang line Bojeong-Seolleung 27.7 1.5 2/18 90 -
대한 심도 등을 조사하여 회귀분석시 영향인자로 이 용하였다.
PM-10은 광산란 연속측정법을 사용하는 LD-3B
(SIBATA)로 측정하였으며, CO2는 비분산적외선 연 속측정법을 이용한 휴대용 측정장비인 GrayWolf sen- sor (Wolfsense, Model:IQ-610Xtra)로 측정하였다. 광 산란 측정방식은 휴대가 간편하고 별도의 전원공급 없이도 8시간 이상 연속 측정이 가능하므로 대중교 통수단에서의 PM-10 측정에 유용하게 이용된다. 그 리고 LD-3B에 의한 측정 결과의 신뢰성을 확보하기 위하여 동일 구간에서 소용량 공기 채취기(mini-vol- ume air sampler)를 이용하여 동시 측정을 수행한 후, 결과에 대한 t-test를 실시하여 99% 신뢰수준에서 차 이가 없음을 확인하였으며, LD-3B 3대로 세량의 전 동차에서 동시에 측정을 실시한 결과에서도 차이가 발생하지 않음을 확인하였다(p⁄0.01).
2. 3 결과 분석
본 연구에서는 공기질 측정값인 PM-10과 CO2의 농도에 영향을 미치는 인자에 대한 분석을 위해 다 변량 통계분석기법을 이용하였다. 다변량 통계분석은 관찰되는 변수가 복수인 경우 한 변수와 다른 여러 변수간의 관계를 파악할 때 사용하는 분석 방법이다.
분석법에는 모든 독립변수를 이용한 추정식을 통해 종속변수와의 인과관계를 설명하는 다변량 회귀분석 과 변수들 사이의 상관관계를 활용하여 데이터를 축 약하는 주성분분석, 요인분석 및 개체간의 유사성을 이용하여 분류하는 군집분석이나 판별분석 등이 있 다. 데이터 축약과 개체 분류는 측정된 변수나 개체 의 수가 많을 경우 오류의 발생 가능성을 줄이기 위 해서 수행 한다(Donghwa engineering, 2007).
통계분석은 SPSS Ver. 13.0 프로그램으로 수행되었 으며, 영향인자들 간의 상관성과 영향인자와 공기질
측정값 간의 상관성은 피어슨 상관분석(Pearson corre- lation analysis)을 이용하였고, 영향인자의 공기질 측 정값에 대한 다변량 회귀분석은 단계적 선형 회귀분 석(Stepwise linear regression analysis)을 이용하였다.
3. 결과 및 토의
3. 1 노선별 평균값
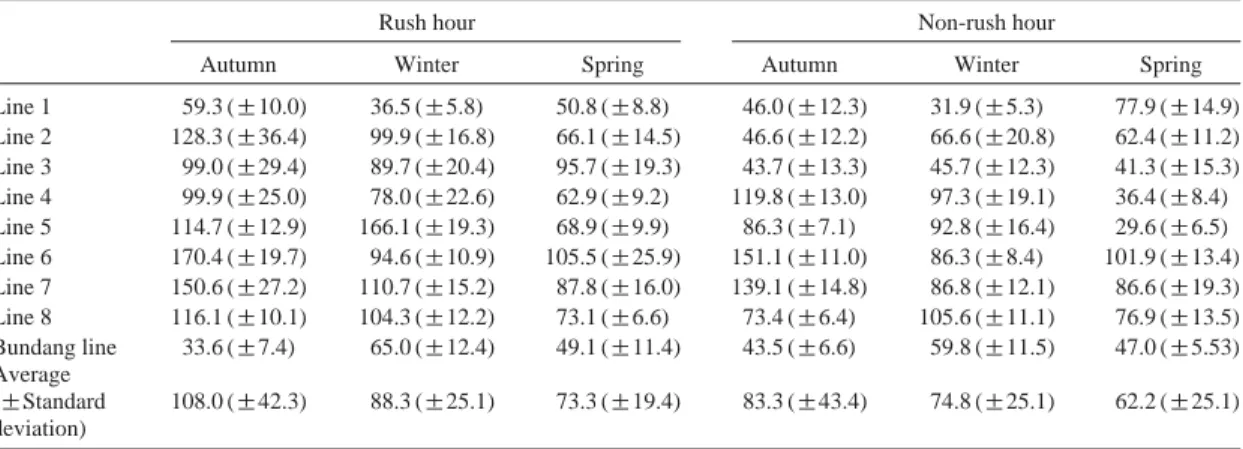
PM-10 및 CO2측정값을 표 3과 표 4에, 그리고 계 절별 농도 분포를 그림 1과 그림 2에 각각 나타내었 다. PM-10의 경우 측정을 수행한 모든 계절에서 Park and Ha (2008)가 수도권 전동차 1호선, 2호선, 4호선 그리고 5호선 차량 내에서 비첨두 시간대에 측정한 값인 144.0μg/m3에 비해 낮은 농도인 62.2~83.3 μg/m3를 보이고 있으며, 표 5에 제시된 다른 여러 도 시들의 측정 결과와 비교해 볼 때 유사하거나 약간 낮은 수준인 것을 알 수 있었다. 그러나 본 연구와 동일 노선을 측정한 Park and Ha (2008)의 연구는 측 정시기가 나타나 있지 않고, 다른 유사 연구의 경우 측정 장비나 방법 등에서 차이가 있어 직접적인 비 교에는 다소 무리가 있을 것으로 사료된다.
3. 2 영향인자별 상관성 분석
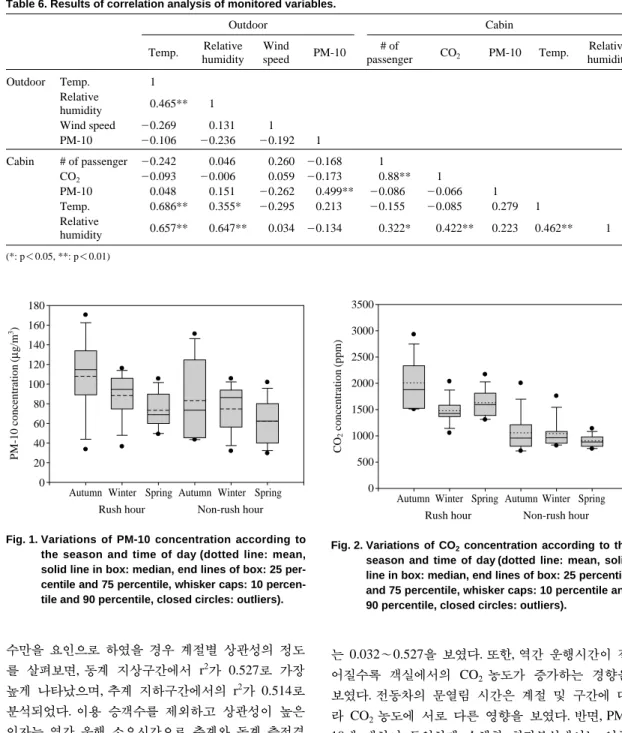
표 6에 외기와 객실에서 공기질 영향인자들 간의 상관성 분석결과를 나타내었다. 분석결과, 외기 습도- 외기 온도, 객실 CO2농도-객실 승객수, 객실 PM-10 농도-외기 PM-10 농도-객실 온도-외기 온도, 객실 온 도-외기 습도, 객실 습도-외기 온도, 객실 습도-외기 습도, 객실 습도-객실 CO2농도, 객실 습도-객실 온도 사이에서 유의한 상관관계를 보이는 것으로 분석되 었다. 이중 객실 CO2농도와 객실 승객수 사이에서 상관계수(r)가 0.88로서 가장 높은 상관성을 보였다.
Table 2. Guidelines of indoor air quality for public transportations (average for 1 operation of a route) (Minister of Envi- ronment, 2006).
Pollutants Classification Level 11) Level 22)
CO2 Subway Less than 2,500 ppm Less than 3,500 ppm
Train, Bus Less than 2,000 ppm Less than 3,000 ppm
PM-10 Subway Less than 200μg/m3 Less than 250μg/m3
Train, Bus Less than 150μg/m3 Less than 200μg/m3
1)Non-rush hour, 2)Rush hour
객실 PM-10 농도의 경우 외기 온도, 외기 습도, 외기 풍속, 객실 CO2농도, 객실 온도 및 객실 습도와는 상 관관계가 없는 것으로 분석되었다. 다만 객실 PM-10 농도의 경우 외기 PM-10 농도와 r값이 0.499로서 유 의한 상관관계가 있는 것으로 나타났다. Cheng et al.
(2008)과 Braniˇs (2006)의 연구결과를 보면 외기 PM- 10 농도가 객실 PM-10 농도에 영향을 미친다고 보고 한 바 있다. 그러나 Murruni et al. (2009)은 객실 PM- 10의 농도는 외기와의 상관성이 없는 것으로 발표하 였다. 여러 연구결과를 종합하면 객실 PM-10 농도는 외기 PM-10 농도뿐만 아니라 보다 복합적인 요인에 의해 결정된다고 사료되어 향후 이에 대한 추가적인 연구와 분석이 필요하다고 판단된다.
3. 3 회귀분석
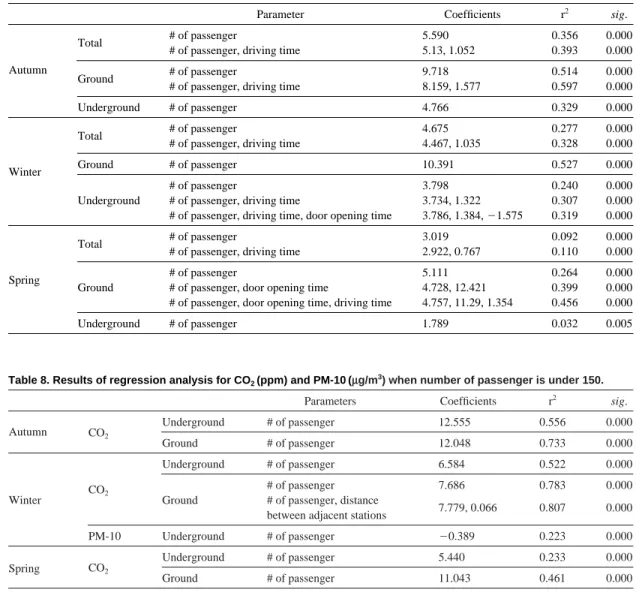
상관성 분석 이외에 PM-10 농도와 CO2농도를 종 속변수로 놓고 승객수, 역간 소요시간, 문열림시간, 심도 등을 독립변수로 하여 단계적 선형 회귀분석을 실시하였다.
3. 3. 1 CO2농도에 영향을 미치는 요인
객실에서 CO2의 농도변화에 영향을 미치는 요인 을 분석하여 표 7에 나타내었다. CO2농도에 가장 큰 영향을 미치는 요인은 승객수의 변화인 것으로 확인 되었다. 전체 노선에서 이용 승객수 자료뿐만 아니라 이용 승객수를 지하 및 지상 구간으로 나눈 자료에 서도 모두 유의한 양의 상관계수를 나타내었다. 승객 Table 3. Seasonal variations of mean PM-10 concentration in subway cabin for each route during rush and non-rush
hour. (unit: μg/m3)
Rush hour Non-rush hour
Autumn Winter Spring Autumn Winter Spring
Line 1 59.3 (±10.0) 36.5 (±5.8) 50.8 (±8.8) 46.0 (±12.3) 31.9 (±5.3) 77.9 (±14.9)
Line 2 128.3 (±36.4) 99.9 (±16.8) 66.1 (±14.5) 46.6 (±12.2) 66.6 (±20.8) 62.4 (±11.2) Line 3 99.0 (±29.4) 89.7 (±20.4) 95.7 (±19.3) 43.7 (±13.3) 45.7 (±12.3) 41.3 (±15.3) Line 4 99.9 (±25.0) 78.0 (±22.6) 62.9 (±9.2) 119.8 (±13.0) 97.3 (±19.1) 36.4 (±8.4) Line 5 114.7 (±12.9) 166.1 (±19.3) 68.9 (±9.9) 86.3 (±7.1) 92.8 (±16.4) 29.6 (±6.5) Line 6 170.4 (±19.7) 94.6 (±10.9) 105.5 (±25.9) 151.1 (±11.0) 86.3 (±8.4) 101.9 (±13.4) Line 7 150.6 (±27.2) 110.7 (±15.2) 87.8 (±16.0) 139.1 (±14.8) 86.8 (±12.1) 86.6 (±19.3) Line 8 116.1 (±10.1) 104.3 (±12.2) 73.1 (±6.6) 73.4 (±6.4) 105.6 (±11.1) 76.9 (±13.5) Bundang line 33.6 (±7.4) 65.0 (±12.4) 49.1 (±11.4) 43.5 (±6.6) 59.8 (±11.5) 47.0 (±5.53) Average
(±Standard 108.0 (±42.3) 88.3 (±25.1) 73.3 (±19.4) 83.3 (±43.4) 74.8 (±25.1) 62.2 (±25.1) deviation)
Table 4. Seasonal variations of mean CO2concentration in subway cabin for each route during rush and non-rush hour.
(unit: ppm)
Rush hour Non-rush hour
Autumn Winter Spring Autumn Winter Spring
Line 1 2478.0 (±804.9) 1568.5 (±505.6) 2168.5 (±1164.5) 714.3 (±147.2) 841.4 (±146.9) 883.7 (±270.3) Line 2 2285.2 (±670.8) 2036.0 (±787.3) 1815.1 (±595.1) 2002.2 (±497.2) 1757.2 (±381.1) 812.2 (±248.4) Line 3 1517.4 (±661.9) 1624.1 (±518.6) 1325.0 (±401.0) 713.7 (±117.4) 965.0 (±362.6) 996.7 (±203.2) Line 4 1852.6 (±1052.0) 1271.4 (±543.3) 1306.4 (±555.2) 1202.1 (±427.9) 1223.9 (±294.8) 973.9 (±253.1) Line 5 1506.9 (±631.7) 1424.4 (±514.5) 1594.4 (±627.3) 1001.4 (±194.3) 1002.0 (±180.3) 753.6 (±124.9) Line 6 1524.9 (±572.4) 1054.8 (±151.7) 1409.8 (±471.0) 864.1 (±168.0) 866.4 (±204.1) 769.2 (±126.0) Line 7 1879.1 (±724.5) 1397.6 (±544.9) 1809.8 (±705.8) 1241.0 (±342.4) 814.2 (±215.6) 880.7 (±182.7) Line 8 2097.0 (±625.1) 1531.3 (±508.7) 1585.0 (±637.8) 832.3 (±148.5) 880.2 (±178.2) 952.7 (±210.5) Bundang line 2928.5 (±831.9) 1411.7 (±308.1) 1672.4 (±521.1) 958.0 (±106.3) 1035.7 (±146.4) 1139.0 (±154.4) Average
(±Standard 2007.7 (±489.8) 1480.0 (±269.1) 1631.8 (±275.6) 1058.8 (±400.7) 1042.9 (±296.1) 906.9 (±123.1) deviation)
Table 5. Literature review for indoor particulate matter monitoring in various places. LocationSampling periodSampling siteParticulate measureConcentration(μg/m3)EquipmentReferences Beijing, ChinaDecember 2004In- train
PM-10108 Dustmate(Turnkey)Li et al.(2006) PM-2.536.9 Seoul, KoreaIn-trainPM-10/PM-2.5144.0/118.4Portable aerosol Park and Ha(2008) PlatformPM-10/PM-2.5125.8/111.1spectrometer(Grimm) Mexico City, May 2002~ In- train
PM
- 2.5
61Vortex Ultraflow(Casella) Gómez
- Perales
et al.(2004) MexicoJune 200216L/min Taipei, TaiwanJanuary 2005~In-trainPM-10/PM-2.5/PM-1.046.5/28.9/22.5Portable dust monitor Tsai et al.(2008) April 2005PlatformPM-10/PM-2.5/PM-1.075.3/37.5/28.0(Grimm) Buenos Aires,October 2005~In-trainTSP152~270Portable AirCon-2 pump Murruni et al.(2009) ArgentinaOctober 2006PlatformTSP55~137(Gillian Corp.) London, UKJuly 1999, In- train
PM
- 2.5
247.2(summer)Vortex Ultraflow(Casella) Adams et al.(2001) February 2000157.3(winter)16L/min Taipei, TaiwanOctober 2007~In-trainPM-10/PM-2.541(10~97)/32(8~68) Dustmate(Turnkey)Cheng et al.(2008) December 2007PlatformPM-10/PM-2.551(11~137)/35(7~100) November 2004~In-trainPM-10/PM-2.5311.5/125.5 Seoul, KoreaPlatformPM-10/PM-2.5359.0/129.0DustTrak(TSI)Kim et al.(2008) February 2005 OutdoorPM-10/PM-2.5154.5/102.1 Prague,March 2003~In-trainPM-1082.3(summer), 125.5(winter) PlatformPM-1071.1(summer), 120.2(winter)DustTrak(TSI)Braniˇs(2006) Czech RepublicFebruary 2004 OutdoorPM-1051.4(summer), 84.9(winter) Helsinki, FinlandMarch 2004In-trainPM-2.521(±4) CycloneAarnio et al.(2005) PlatformPM-2.547(±4) Budapest, HungaryApril 2006PlatformPM-10130TEOM with PM-10 inletSalma et al.(2007) Hong Kong, ChinaOctober 1999~ In- train
PM
- 10/PM - 2.5
44(±16)/33(±10)DustTrak(TSI)Chan et al.(2002) January 2000
수만을 요인으로 하였을 경우 계절별 상관성의 정도 를 살펴보면, 동계 지상구간에서 r2가 0.527로 가장 높게 나타났으며, 추계 지하구간에서의 r2가 0.514로 분석되었다. 이용 승객수를 제외하고 상관성이 높은 인자는 역간 운행 소요시간으로 추계와 동계 측정결 과에서 유의한 요소로 나타났다. 춘계 측정결과의 경 우 차량 정차시 문열림 시간에 의해서도 객실의 CO2
농도가 영향을 받는 것으로 분석되었다. 측정을 수행 한 모든 계절 및 전 구간에서 승객수가 CO2농도에 미치는 영향이 가장 큰 것을 알 수 있으며, r2의 범위
는 0.032~0.527을 보였다. 또한, 역간 운행시간이 길 어질수록 객실에서의 CO2농도가 증가하는 경향을 보였다. 전동차의 문열림 시간은 계절 및 구간에 따 라 CO2농도에 서로 다른 영향을 보였다. 반면, PM- 10에 대하여 동일하게 수행한 회귀분석에서는 영향 요인이 나타나지 않았다.
3. 3. 2 승객수에 따른 영향 분석
전동차는 환기설비의 용량과 승객의 밀집도 등을 고려하여 승객 160명을 설계정원의 100%로 차량을 Autumn Winter Spring Autumn Winter Spring
0 20 40 60 80 100 120 140 160 180
Rush hour Non-rush hour
PM-10 concentration(μg/m3)
Fig. 1. Variations of PM-10 concentration according to the season and time of day (dotted line: mean, solid line in box: median, end lines of box: 25 per- centile and 75 percentile, whisker caps: 10 percen- tile and 90 percentile, closed circles: outliers).
Autumn Winter Spring Autumn Winter Spring Rush hour Non-rush hour 0
500 1000 1500 2000 2500 3000 3500
CO2 concentration(ppm)
Fig. 2. Variations of CO2concentration according to the season and time of day (dotted line: mean, solid line in box: median, end lines of box: 25 percentile and 75 percentile, whisker caps: 10 percentile and 90 percentile, closed circles: outliers).
Table 6. Results of correlation analysis of monitored variables.
Outdoor Cabin
Temp. Relative Wind PM-10 # of CO2 PM-10 Temp. Relative
humidity speed passenger humidity
Outdoor Temp. 1
Relative 0.465** 1
humidity
Wind speed -0.269 0.131 1
PM-10 -0.106 -0.236 -0.192 1
Cabin # of passenger -0.242 0.046 0.260 -0.168 1
CO2 -0.093 -0.006 0.059 -0.173 0.88** 1
PM-10 0.048 0.151 -0.262 0.499** -0.086 -0.066 1
Temp. 0.686** 0.355* -0.295 0.213 -0.155 -0.085 0.279 1
Relative
0.657** 0.647** 0.034 -0.134 0.322* 0.422** 0.223 0.462** 1 humidity
(*: p⁄0.05, **: p⁄0.01)
제작한다. 정원 160명을 기준으로 밀집도의 높고 낮 음을 결정하며, 밀집도가 공기질에 미치는 영향인자 에 대해서 회귀분석을 한 결과를 표 8과 표 9에 나 타내었다. 전동차에서 승객수를 셀 때 발생할 수 있 는 오차를 감안하여 150~170명은 회귀분석에서 제 외하였다.
밀집도가 낮은 경우 즉, 승객이 정원의 100%보다 적을 때 공기질 측정값에 가장 큰 영향을 끼친 인자 는 승객수의 변화였다. CO2농도는 승객수와 양의 상 관관계를, PM-10 농도는 승객수와 음의 상관관계를 보였다. PM-10 농도는 유일하게 동계 측정에서 승객
수와 유의한 상관관계를 나타내었으며, 다른 계절에 서는 유의한 영향을 미치는 인자가 나타나지 않았다.
밀집도가 높은 경우, CO2의 농도는 승객수에 의한 영향이 가장 큰 것으로 나타났다. PM-10 농도는 승객 수 혹은 역간 거리가 중요 영향인자로 분석되었다.
표 8과 표 9의 분석결과에서 전동차에서 CO2의 농도는 승객의 수에 관계없이 영향을 받지만 PM-10 의 농도는 승객의 밀집도가 높을 때 상관성이 높아 지는 것을 알 수 있었다. 이는 Li et al. (2006)의 연구 에서 승객의 수가 CO2농도뿐만 아니라 PM-10 농도 와도 상관성을 보인다는 결과와 유사하다. 또한, 밀집 Table 7. Results of regression analysis for seasonal variation of CO2(ppm).
Parameter Coefficients r2 sig.
Total # of passenger 5.590 0.356 0.000
# of passenger, driving time 5.13, 1.052 0.393 0.000
Autumn
Ground # of passenger 9.718 0.514 0.000
# of passenger, driving time 8.159, 1.577 0.597 0.000
Underground # of passenger 4.766 0.329 0.000
Total # of passenger 4.675 0.277 0.000
# of passenger, driving time 4.467, 1.035 0.328 0.000
Winter Ground # of passenger 10.391 0.527 0.000
# of passenger 3.798 0.240 0.000
Underground # of passenger, driving time 3.734, 1.322 0.307 0.000
# of passenger, driving time, door opening time 3.786, 1.384, -1.575 0.319 0.000
Total # of passenger 3.019 0.092 0.000
# of passenger, driving time 2.922, 0.767 0.110 0.000
Spring # of passenger 5.111 0.264 0.000
Ground # of passenger, door opening time 4.728, 12.421 0.399 0.000
# of passenger, door opening time, driving time 4.757, 11.29, 1.354 0.456 0.000
Underground # of passenger 1.789 0.032 0.005
Table 8. Results of regression analysis for CO2(ppm) and PM-10 (μμg/m3) when number of passenger is under 150.
Parameters Coefficients r2 sig.
Autumn CO2 Underground # of passenger 12.555 0.556 0.000
Ground # of passenger 12.048 0.733 0.000
Underground # of passenger 6.584 0.522 0.000
CO2 # of passenger 7.686 0.783 0.000
Winter Ground # of passenger, distance
7.779, 0.066 0.807 0.000
between adjacent stations
PM-10 Underground # of passenger -0.389 0.223 0.000
Spring CO2 Underground # of passenger 5.440 0.233 0.000
Ground # of passenger 11.043 0.461 0.000
도가 높을 경우, 지하구간에 대한 회귀분석 결과에서 역간 거리가 중요한 영향인자로 작용하였다. 이는 운 행시간이 길어지는 경우 역에서 정차할 때 전동차 공 기가 외기와의 치환에 의한 환기시간이 지연되기 때 문으로 사료된다.
4. 결 론
주요 대중교통수단인 전동차의 PM-10 및 CO2의 농도에 영향을 미치는 인자를 파악하기 위해서 계절 별로 측정을 실시했으며, 온도, 습도, 이용 승객수, 지 상 및 지하구간 등 다양한 인자들을 측정 농도 값과 같이 상관분석 및 회귀분석을 실시하였다. 공기질 측 정결과, 노선 평균값은 PM-10 농도의 경우 62.6~
108.0μg/m3의 수준으로 나타났으며, CO2는 907~
2,008 ppm의 범위를 보였다. CO2농도의 경우 승객이 집중되는 출근 시간대의 일부 구간에서 대중교통수 단 실내공기질 관리가이드라인을 초과하는 것으로 나타나서 CO2농도를 줄이기 위해서는 전동차의 환 기 방식을 구간대 및 시간대 별로 차별화하거나 CO2
흡착장치를 특정 시간대에 가동하는 방법 등을 고려 할 수 있다. CO2농도와 PM-10 농도에 대한 상관관 계를 분석한 결과, CO2농도는 전동차 이용 승객의 수와 유의한 수준의 상관성을 보여 승객수에 의해 가장 큰 영향을 받는 것을 알 수 있었다. PM-10 농 도의 경우, 승객의 밀집도에 따라 양이나 음의 상관
계수를 나타내었으며, 외기 PM-10 농도와 양의 상관 계수을 보였다.
선형 회귀분석에서 CO2농도는 승객수와 역간 운 행 시간에 의해 영향을 가장 많이 받는 것으로 나타 났다. PM-10 농도는 승객의 밀집도가 높을 경우 승 객수 및 역간 거리에 의한 영향 정도가 증가하였다.
본 연구를 통해 전동차에서 PM-10 및 CO2농도에 영향을 미치는 요인을 분석하였다. 분석결과 CO2의 농도는 승객수 및 역간 거리 등 몇 가지 요인에 의해 서 영향을 많이 받는 것으로 나타났다. PM-10의 농 도는 외기 농도 및 승객 밀집도에 의해 다소 좌우되 나 상관성이 높은 요인을 밝히기 위해서는 추가적인 연구가 필요한 것으로 판단된다. 본 연구의 결과는 전동차 공기질 관리계획을 수립하거나 공기질 제어 장치를 설계하는데 기초자료로 활용이 가능할 것으 로 사료된다.
감사의 글
이 논문은 국토해양부 미래도시철도기술개발사업 (09 Urban railroad A-01)의 일환으로 수행되었음.
참 고 문 헌
Aarnio, P., T. Yli-Tuomi, A. Kousa, T. Mäkelä, A. Hirsikko, K. Hämeri, M. Räisänen, R. Hillamo, T. Koskentalo, Table 9. Results of regression analysis for CO2(ppm) and PM-10 (μμg/m3) when number of passenger is over 170.
Parameters Coefficients r2 sig.
CO2
Underground # of passenger 8.931 0.369 0.000
Autumn
Ground # of passenger 15.170 0.454 0.046
distance between adjacent stations -0.031 0.102 0.013 PM-10 Underground distance between adjacent stations,
# of passenger -0.036, -0.413 0.195 0.002
CO2 Underground # of passenger 8.493 0.522 0.000
Winter # of passenger 0.485 0.253 0.000
PM-10 Underground # of passenger, distance between
adjacent stations 0.399, -0.017 0.359 0.000
# of passenger 6.330 0.156 0.001
CO2 Underground # of passenger, distance between
Spring adjacent stations 6.389, -0.313 0.215 0.001
PM-10 Underground # of passenger -0.176 0.162 0.001
and M. Jantunen (2005) The concentrations and composition of and exposure to fine particles (PM2.5) in the Helsinki subway system, Atmos. Environ., 39, 5059-5066.
Adams, H.S., M.J. Nieuwenhuijsen, R.N. Colvile, M.A.S.
McMullen, and P. Khandelwal (2001) Fine particle (PM2.5) personal exposure levels in transport micro- environments, London, UK, Sci. Total Environ., 279, 29-44.
Braniˇs, M. (2006) The contribution of ambient sources to parti- culate pollution in spaces and trains of the Prague underground transport system, Atmos. Environ., 40, 348-356.
Chan, L.Y., W.L. Lau, S.C. Lee, and C.Y. Chan (2002) Com- muter exposur to particulate matter in public trans- portation modes in Hong Kong, Atmos. Environ., 36, 3363-3373.
Cheng, Y.H., Y.L. Lin, and C.C. Liu (2008) Levels of PM-10 and PM2.5 in Taipei Rapid Transit System, Atmos.
Environ., 42, 7242-7249.
Cheng, Y.H., Y.L. Lin, and C.C. Liu (2009) Levels of ultrafine particles in Taipei Rapid Transit System, Transport.
Res. D., 14, 479-486.
Cho, J.H., K.H. Min, and N.W. Paik (2006) Temporal variation of airborne fungi concentrations and related factors in subway stations in Seoul, Korea, Int. J. Hyg. En- viron. Health, 209, 249-255.
Donghwa engineering (2007) Environmental Statistics.
Gómez-Perales, J.E., R.N. Colvile, M.J. Nieuwenhuijsen, A.
Fernández-Bremauntz, V.J. Gutiárrez-Avedoy, V.H.
Páramo-Figueroa, S. Blanco-Jiménez, E. Bueno- López, F. Mandujano, R. Bernabé-Cabanillas, and E. Ortix-Segovia (2004) Commuters’ exposure to PM2.5, CO, and Benzene in public transport in the metropolitan area of Mexico City, Atmos. Environ., 38, 1219-1229.
Halios, C.H. and C.G. Helmis (2007) On the estimation of char- acteristic indoor air quality parameters using analy- tical and numerical methods, Sci. Total Environ., 381, 222-232.
Kim, K.Y., Y.S. Kim, Y.M. Roh, C.M. Lee, and C.N. Kim (2008) Spatial distribution of particulate matter (PM-10 and PM2.5) in Seoul Metropolitan Subway stations, J. Hazard. Mater., 154, 440-443.
Korail (2009) 2009 Statistical Year Book of Railroad.
Lau, W.L. and L.Y. Chan (2003) Commuter exposure to aro- matic VOCs in public transportation modes in Hong Kong, Sci. Total Environ., 308, 143-155.
Li, T.T., Y.H. Bai, Z.R. Liu, J.F. Liu, G.S. Zhang, and J.L. Li (2006) Air quality in passenger cars of the ground railway transit system in Beijing, China, Sci. Total Environ., 367, 89-95.
Ministry of Environment (2006) Guideline on Indoor Air Qual- ity of Public Transport.
Ministry of Land, Transport and Maritime Affair (2009) Stat- istical Year Book of Land, Transport and Maritime.
Morabia, A. and T.M. Amstislavski (2009) Air pollution and activity during transportation by car, subway, and walking, Am. J. Prev. Med., 37, 72-77.
Murruni, L.G., V. Solanes, M. Debray, A.J. Kreiner, J. David- son, M. Davidson, M. Vázquez, and M. Ozafrán (2009) Concentrations and elemental composition of particulate matter in the Buenos Aires underground system, Atmos. Environ., 43, 4577-4583.
Park, D.U. and K.C. Ha (2008) Characteristics of PM-10, PM2.5, CO2and CO monitored in interiors and plat- forms of subway train in Seoul, Korea, Environ. Int., 34, 629-634.
Salma, I., M. Pósfai, K. Kovács, E. Kuzmann, Z. Homonnay, and J. Posta (2009) Properties and sources of indivi- dual particles and some chemical species in the aero- sol of a metropolitan underground railway station, Atmos. Environ., 43, 3460-3466.
Salma, I., T. Weidinger, and W. Maenhaut (2007) Time-resolv- ed mass concentration, composition and sources of aerosol particles in a metropolitan underground railway station, Atmos. Environ., 41, 8391-8405.
Shek, K.W. and W.T. Chan (2008) Combined comfort model of thermal comfort and air quality on buses in Hong Kong, Sci. Total Environ., 389, 277-282.
Som, D., C. Dutta, A. Chatterjee, D. Mallick, T.K. Jana, and S. Sen (2007) Studies on commuters’ exposure to BTEX in passenger cars in Kolkata, India, Sci. Total Environ., 372, 426-432.
Tsai, D.H., Y.H. Wu, and C.C. Chan (2008) Comparisons of commuter’s exposure to particulate matters while using different transportation modes, Sci. Total Environ., 405, 71-77.
Wong, L.T., K.W. Mui, and P.S. Hui (2006) A statistical model for characterizing common air pollutants in air- conditioned offices, Atmos. Environ., 40, 4246- 4257.
Wong, L.T., K.W. Mui, and P.S. Hui (2008) A multivariate- logistic model for acceptance of indoor environmen- tal quality (IEQ) in offices, Build. Environ., 43, 1-6.
Zhao, B. and J. Wu (2007) Particle deposition in indoor envi-
ronments: Analysis of influencing factors, J. Hazard.
Mater., 147, 439-448.
Zhao, W., P.K. Hopke, E.W. Gelfand, and N. Rabinovitch
(2007) Use of an expanded receptor model for per- sonal exposure analysis in schoolchildren with asth- ma, Atmos. Environ., 41, 4084-4096.