Journal of the Korean Chemical Society 2010, Vol. 54, No. 1
Printed in the Republic of Korea DOI 10.5012/jkcs.2010.54.01.165
–165–
주제어: 비 추출 분광광도법, Chloramine-T, p-Aminoacetanilide
Keywords: Non extractive spectrophotometry, Chloramine-T, p-Aminoacetanilide
단신
여러 가지 시료 중에 p-Aminoacetanilide를 사용하여 Cyanide와 Hydrogen Cyanide 흔적량의 신속한 분광광도법 측정
Prachi Parmar*, Ajai Kumar Pillai, and Vinay Kumar Gupta†
Department of Chemistry, Govt. V.Y.T. Autonomous College Durg (Chhattisgarh), India, 491001
†School of studies in Chemistry, Pt. Ravishankar Shukla University, Raipur, (Chhattisgarh), India, 492001 (접수 2009. 11. 3; 수정 2009. 12. 2; 게재확정 2009. 12. 11)
Rapid Spectrophotometric Determination of Trace Amounts of Cyanide and Hydrogen Cyanide Using p-Aminoacetanilide in Various Samples
Prachi Parmar*, Ajai Kumar Pillai, and Vinay Kumar Gupta†
Department of Chemistry, Govt. V.Y.T. Autonomous College Durg (Chhattisgarh), India, 491001
*E-mail: drajaipillai@gmail.com
†School of studies in Chemistry, Pt. Ravishankar Shukla University, Raipur, (Chhattisgarh), India, 492001 (Received November 3, 2009; Revised December 2, 2009; Accepted December 11, 2009)
INTRODUCTION
A highly toxic substance, cyanide is widely used for the extraction of metals in electroplating industry, for surface treatments and in the production of various resin monomers.
Major sources of cyanide in addition to those from the above mentioned industries include, exhaust from vehicle emissions and cigarette smoke.1 Typical signs of acute cyanide poisoning include tachypnoea, headache, vertigo, lack of motor coordi- nation, weak pulse, cardiac arrhythmias, vomiting, stupor, con- vulsions, eye irritation coma and death.2
Hydrogen cyanide is reported to be present in cigarette smoke, the concentration of which varies according to the variety of the cigarette. A cigarette without filter is reported to liberate 500 µg of hydrogen cyanide while filtered cigarettes liberate only 100 µg.3-4 Cyanide is well absorbed via gastrointestinal tract or skin and rapidly absorbed via respiratory tract. Once absorb- ed, cyanide is rapidly and ubiquitously distributed throughout the body, although the highest level is typically found in liver, lungs, blood and brain.5 The lethal dose for human beings nor- mally varies between 0.5 to 3.5 mg/kg of body weight.6
Due to its highly toxic nature, a method for its determination has been an area of interest for analytical chemists. Several methods have been developed for the determination of cyanide, which include HPLC,7 GC-MS,8 capillary electrophoresis,9 photometry,10 electrochemical sensor,11 ion chromatography,12 chromatography,13 indirect determination by atomic absorption
spectrometry,14 electrochemical method,15 spectrofluorimetry,16 and spectrophotometry.17-21
In this communication, a spectrophotometric method has been proposed which is based on the earlier reported method of conversion of cyanide to cyanogen chloride by chloramine- T.22 Cyanogen chloride thus produced is reacted with pyridine to form an additional product which subsequently condenses with p-aminoacetanilide to form a coloured product measurable at 485 nm. Although a number of spectrophotometric methods have been reported for the determination of cyanide, the most of them use bromine water which is toxic in nature, few of the reported method use benzidine and other amino like p-phe- nylene diamine, compounds for coupling which are carcino- genic (Table 4). Both these drawbacks are removed by using chloramine-T and p-aminoacetanilide.
EXPERIMENTAL Apparatus and reagents
A Toshniwal model TVSP 25 spectrophotometer was used for spectral measurements. pH measurements were made with systronics pH meter model 331. Fritted midget impingers (dia- meter~10 mm) of 35 mL capacity were used for air sampling.
Flow rate adjustable calibrated rotameters were used for mea- suring the air flow. All chemicals used in this work were of analytical grade, double distilled water was used throughout.
Cyanide stock (Merck) -1 mg mL-1 stock solution of cyanide
166 Prachi Parmar, Ajai Kumar Pillai, and Vinay Kumar Gupta
Journal of the Korean Chemical Society
(a) 4 µg/25 (b) Blank
410 430 450 470 490 510 530 550 570
Wavelength
Absorbance
0.8 0.7 0.6 0.5 0.4 0.3 0.2 0.1 0
(a) 4 µg/25 mL (b) Blank
(a) (b)
Fig. 1. Absorption spectra of the dye.
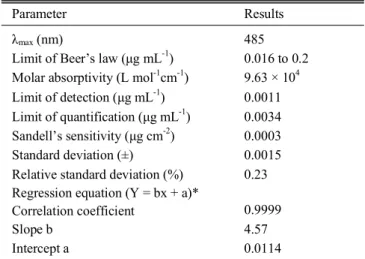
Table 1. Spectral characteristics, precision and accuracy of the pre- sented method
Parameter Results
λmax (nm) 485
Limit of Beer’s law (µg mL-1) 0.016 to 0.2 Molar absorptivity (L mol-1cm-1)
Limit of detection (µg mL-1) Limit of quantification (µg mL-1)
9.63 × 10⁴ 0.0011 0.0034 Sandell’s sensitivity (µg cm-2) 0.0003
Standard deviation (±) 0.0015
Relative standard deviation (%) 0.23 Regression equation (Y = bx + a)*
Correlation coefficient 0.9999
Slope b 4.57
Intercept a 0.0114
(Y = bx + a), x is the concentration in µg mL-1, **n = 6.
was prepared by dissolving 250 mg of potassium cyanide in 100 mL-1 water. Working standards were prepared from this stock by appropriate dilution. Pyridine reagent ‒3 mL of con- centrated hydrochloric acid was mixed with 18 mL of pyridine (Merck) and 12 mL of water followed by addition of 30 mL of 0.5% aqueous solution of p-aminoacetanilide (Merck). Chlor- amine-T (Merck) ‒0.03% (w/v) chloramine-T solution was prepared by dissolving 0.03 g chloramine-T in distilled water and diluting it to the mark in a 100 mL volumetric flask. Stock Solution of fenvalerate Pesticide (Northern Mineral Limited, India) 1 mg mL-1 was prepared in ethanol. Working standards were prepared by appropriate dilution of the stock. Sodium hydroxide solution (Loba chemie, Mumbai) 2 M aqueous solu- tion was prepared.
Procedure
Preparation of calibration curve: To an aliquot of an aqueous solution containing 0.4 ~ 5.0 µg of cyanide was taken in a 25 mL graduated test tube series. To it 1 mL of pyridine-p-amino- acetanilide reagent was added followed by addition of 1 mL of chloramine-T and reaction condition thermostated at 30 oC.
The solution was diluted with double distilled water and allow- ed to stand for 2 ~ 3 min for complete colour development. The absorption of the standard solution of the cyanide with diffe- rent concentrations was recorded at 485 nm against reagent blank.
Determination of hydrogen cyanide in air samples: Conta- minated air of nearby location of steel plant was drawn into two midget impingers, each containing 10 mL of 0.1 M NaOH solution connected to a source of suction in the environment at a flow rate of 0.25 L min-1 for 15 min. After sampling, aliquots of the absorbing solution were analyzed as described above and the results confirmed by a reported method20 (Table 3).
Determination of cyanide in pesticide: Stock solution of fenvalerate pesticide (Northern mineral limited, India) 1 mg mL-1 was prepared in ethanol. Working standards were prepared by appropriate dilution of the stock. To known amount of pesti- cide taken separately in a series of 25 mL graduate test tube, 1.0 mL of 2 M sodium hydroxide solution was added and allowed to stand for complete hydrolysis. After 5 min, 1 mL of 2 M hydrochloric acid, 1 mL of pyridine-p-aminoacetanilide reagent and 1 mL of chloramine-T were added in sequence.
The solution was kept for 5 min for complete colour develop- ment. The resulting orange red dye was made up to the mark and measured at 485 nm against a reagent blank that gave negli- gible absorbance at this wavelength(Table 3).
Coke oven effluents: In coke oven effluent, 1 mL of pyridine- p-aminoacetanilide reagent and 1 mL of chloramine-T were added. The solution stand for 5 min, resulting orange red dye was made up to the mark and measured at 485 nm against a
reagent blank that gave negligible absorbance at this wave- length(Table 3).
RESULT AND DISCUSSION Absorption spectra
Final colored product is stable for 30 min and shows maxi- mum absorbance at 485 nm (Fig. 1) where as the reagent blank has negligible absorbance at this wave length. Linear range is obeyed over the concentration range of 0.016 to 0.2 µg mL-1of cyanide. The molar absorptivity and Sandell’s sensitivity are 9.63 × 10⁴ L mol-1 cm-1 and 0.0003 µg cm-2 respectively. The slope, intercept, and the correlation coefficient evaluated by least squares regression analysis are also included (Table 1).
Effect of reagent concentration
Effects of reagent concentration on the absorbance value were evaluated. It was found that 1 mL of chloramines-T (0.03%) and 1 mL of pyridine-p-aminoacetanilide reagent was required for complete colour development.
Rapid Spectrophotometric Determination of Trace Amounts of Cyanide and Hydrogen Cyanide Using p-Aminoacetanilide in Various Samples 167
2010, Vol. 54, No. 1
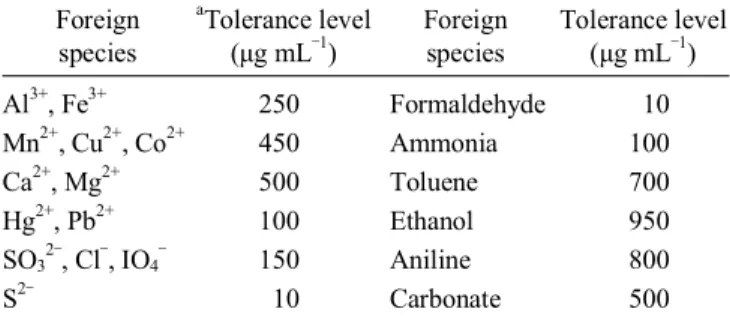
Table 2. Effect of diverse ions (concentration of Cyanide 0.5 µg 25 mL-1)
Foreign species
aTolerance level (µg mL‒1)
Foreign species
Tolerance level (µg mL‒1) Al3+, Fe3+
Mn2+, Cu2+, Co2+
Ca2+, Mg2+
Hg2+, Pb2+
SO32‒, Cl‒, IO4‒
S2‒
250 450 500 100 150 10
Formaldehyde Ammonia Toluene Ethanol Aniline Carbonate
10 100 700 950 800 500
aThe amount causing an error of ±2% in absorbance value.
Table 3. results of analysis of different samples
bAir Sample
aCyanide found, in mg/m3 Present method Reported method20
A 3.90 3.80
B 5.50 5.45
C 3.50 3.30
cSample
Cyanide originally found (µg)
Total cyanide found (µg)a Present
method
Reported method20
(A) 4.5 4.5 4.4
(B) 1.0 0.9 0.9
(C) 2.0 1.6 1.5
dSample (5 mL)
Cyanide found, in ppma Present method Reported method20
A 0.11 0.10
B 0.19 0.17
C 0.31 0.30
aMean of three replicate analysis. bResult of analysis of Plant Air. cResults of analysis of pesticide. dResult of analysis of coke oven effluents.
Table 4. Comparison with other spectrophotometric method
Reagents λmax Range Remark
p-aminobenzoic acid20 410 0.02 - 0.2 Extractive and less sensitive
J- Acid23 400 0.02 - 0.2 Less sensitive
Sulphanilic acid24 460 0.5 - 3 Less sensitive, toxic Br2 water used
Anthranilic acid25 400 1 - 7 Non-toxic but less sensitive
Benzidine26 520 0.1 - 20 Carcinogenic reagent
Ninhydrin27 590 0.04 - 0.24 Less sensitive
Phloroglucinol28 540 0.4 - 3.4 Less sensitive
Aquacyanocobyrinic acid heptamethyl ester29 580 0.04 - 1.20 Less sensitive
p-phenylene diamine30 515 0.005 - 100 Carcinogenic reagent
p-aminoacetanilide (proposed method) 485 0.016 - 0.2 More sensitive
Effect of temperature, time and pH
Optimum results were obtained when the pH of the final solution was between 5.0 ~ 5.5. Above this pH range decrease in the absorbance was observed and dye too became unstable.
It was found that temperature range of 10 ~ 30 oC had no adverse effect on the colour development. The colour develop- ment was completed within 5 min after addition of the reagent and the colour remained stable for 30 min.
Reproducibility
Reproducibility of the method was checked by 6 replicate analysis of the cyanide solution containing 0.3 µg of cyanide in 25 mL final solution. The standard deviation and relative standard deviation were found to be ±0.0015 and 0.26% res- pectively.
Effect of foreign species
The possibilities of interference from ions, which generally co-exist with cyanide, were studied by adding known amounts of different organic pollutants and inorganic ions to the test solution containing a total amount of 4 µg of cyanide per 25 mL of final volume. Interference from NO2‒ and NO3‒ was removed up to 100 µg mL-1by addition of 0.2% sulfamic acid. Inter- ference from various organic pollutants and metal ions was not found. Masking of ions with EDTA solution increases the tolerance limit to a considerable extent. Thiocyanite shows positive interference since it also forms cyanogens chloride when treated with chloramines-T. The tolerance limit of various interferents is shown in Table 2.
Application. Previously, sample of industrial air, pesticides and coke oven effluent were analyzed by the recommended assay. The results of the determinations were in good agree- ment with those made with a well known spectrophotometric method.20
168 Prachi Parmar, Ajai Kumar Pillai, and Vinay Kumar Gupta
Journal of the Korean Chemical Society
Acknowledgments. The Authors are grateful to Govt. V.Y.T.
PG Autonomous College, Durg (C.G.) India, for providing laboratory facilities.
REFERENCES
1. Tina Petrova Simeonova, Lawrence Fishbein, Fairfax, Virginia, USA, World Health Organization, Geneva, 2004.
2. Pritchard, J. D.; CHAPD HQ, HPA 2007, Version 2.
3. Health Canada 2002 Where there’s smoke there’s hydrogen cyanide. Ottawa, Ontario, Health Canada, Healthy Environments and Consumer Safety Branch. Available http://www.hc-sc.gc.ca/
hesesc/tobacco/legislation/warnings/e_o.html#3.
4. Drochiou, G.; Mangalagiu, I.; Tararu, V. Analyst 2000, 125, 939.
5. Lam, K. K.; Lau, F. L. An Incident of Hydrogen Cyanide Poisoning Am J. Emerg. Med. 2000, 18, 172-5.
6. Yenneshland, B.; Conn, E. Cyanide in Biology, Wiley Interscience, New-York, 1991, p.11.
7. Akiyama, H.; Toida, T.; Sakai, S.; Amakura, Y.; Kondo, K.; konishi, Y. S. J. Health Sci. 2006, 52, 73-77.
8. Nishikawa, M. M.; Tsuchihashi, H. Journal of Health Science 2000, 46, 81-88.
9. Katerina, P.; Glatz, Z Journal of Chromatography A 2006, 1120, 268-272.
10. Yongsheng, Y.; R. Brownell, C.; Sadrieh, N.; May, C.; Alfred, V.
D. G.; Lyon, R. C.; Faustino, P. J. J. of Pharma and biomedical Anal. 2007, 43, 1358-1368.
11. Lindsay, A. E.; Danny, O. H. Analytical Chimica Acta 2006, 558, 158-163.
12. Christison, T. T.; Rohrer, J. S. J. Chromatography A. 2007, 1155(1), 31-39.
13. Logue, B. A.; Kirschten, N. P.; Petrikovics, I.; Moser, M. A.;
Rock Wood, G. A.; Baskin, S. I. J. Chromatogr. B. 2005, 819, 237.
14. Noroozifar, M.; Motlagh, M. K. Anal. Chim. Acta 2005, 528, 269.
15. Abbspour, A.; Asadi, M.; Ghaffarinejad, A.; Safaei, E. Talanta 2005, 66, 931.
16. Ruiz, D. L. E.; Garcia, E. A.; Garcia, M. E. D. Analyst 2000, 125, 2100.
17. Nagaraja, P.; Hemantha, M. S; Yathirajan, H. S.; Prakash, J. S.
Anal. Sci. 2002, 19, 1027.
18. Agrawal, O.; Sunitha, G.; Gupta, V. K. J. Chin. Chem. Soc. 2005, 52, 51.
19. Deep, B.; Balasubramanian, N.; Nagaraja, K. S. Anal. Lett 2003, 36, 2865.
20. Verma, A.;.Gupta, V. K. Asian Journal of Chemistry 1996, 8, 4.
21. Drochioiu, G.; Mangalagiu, I.; Avram, E.; Popa, K.; Dirtu, A. C.;
Analytical Science 2004, 20, 1443.
22. Afkhami, A.; Sarlak, N.; Zarei, A. R. Talanta 2007, 71, 93-899.
23. Katki, K. S. Analyst 1957, 82, 24.
24. Sunita, S.; Gupta, V. K. J. Indian Chem. Society 1987, LXIV, 431- 433.
25. Upadhyay, S.; Gupta, V. K. Analyst 1984, 109, 1619.
26. Archer, E. E. Analyst 1988, 69, 370.
27. Padmarajaiah, N.; Mattighatta, S.; Kumar, H.; Hemmige, S.; Jai- nara, V.; Prakash, S. Analytical Science 2002, 18, 1027.
28. Amlathe, S.; Gupta, V. K. Bull. Soc. Chim. Belg 1988, 97(5), 395.
29. Saad, S. M. H.; Mohamed, S. A. H.; Ali, E. K. Talanta 2007, 71, 1088.
30. Bark, L. S.; Higson, H. G. Talanta 1964, 11, 621.
![[ 경제 및 산업 소식 ]](data:image/gif;base64,R0lGODlhAQABAIAAAP///wAAACH5BAEAAAAALAAAAAABAAEAAAICRAEAOw==)