D I A B E T E S & M E T A B O L I S M J O U R N A L D I A B E T E S & M E T A B O L I S M J O U R N A L
This is an Open Access article distributed under the terms of the Creative Commons Attribution Non-Commercial License (http://creativecommons.org/licenses/by-nc/4.0/) which permits unrestricted non-commercial use, distribution, and reproduction in any medium, provided the original work is properly cited.
Lack of Evidence of the Role of APOA5 3’UTR
Polymorphisms in Iranian Children and Adolescents with Metabolic Syndrome
Samaneh Salehi1,*, Modjtaba Emadi-Baygi1,2,*, Majdaddin Rezaei3,4, Roya Kelishadi5, Parvaneh Nikpour3,4,5
1Department of Genetics, Faculty of Basic Sciences, 2Research Institute of Biotechnology, Shahrekord University, Shahrekord,
3Pediatric Inherited Diseases Research Center, Research Institute for Primordial Prevention of Non-communicable Disease, 4Department of Genetics and Molecular Biology, Faculty of Medicine, 5Child Growth and Development Research Center, Research Institute for Primordial Prevention of Non- communicable Disease, Isfahan University of Medical Sciences, Isfahan, Iran
Background: Metabolic syndrome (MetS) is a complex and multifactorial disorder characterized by insulin resistance, dyslipi- daemia, hyperglycemia, abdominal obesity, and elevated blood pressure. The apolipoprotein A5 (APOA5) gene variants have been reported to correlate with two major components of MetS, including low levels of high density lipoprotein cholesterol (HDL-C) and high levels of triglyceride. In the present study, we explored the associations between five single nucleotide poly- morphisms (SNPs) of APOA5 gene and the MetS risk.
Methods: In a case-control design, 120 Iranian children and adolescents with/without MetS were genotyped by polymerase chain reaction-sequencing for these SNPs. Then, we investigated the association of SNPs, individually or in haplotype constructs, with MetS risk.
Results: The rs34089864 variant and H1 haplotype (harboring the two major alleles of rs619054 and rs34089864) were associated with HDL-C levels. However, there was no significant association between different haplotypes/individual SNPs and MetS risk.
Conclusion: These results presented no association of APOA5 3’UTR SNPs with MetS. Further studies, including other polymor- phisms, are required to investigate the involvement of APOA5 gene in the genetic susceptibility to MetS in the pediatric age group.
Keywords: Apolipoprotein A-V; Haplotypes; Metabolic syndrome; miR-TS-SNP
Corresponding author: Parvaneh Nikpour https://orcid.org/0000-0002-1784-6040 Department of Genetics and Molecular Biology, Faculty of Medicine, Isfahan University of Medical Sciences, Isfahan, Iran
E-mail: [email protected]
*Samaneh Salehi and Modjtaba Emadi-Baygi contributed equally to this study as first
INTRODUCTION
Metabolic syndrome (MetS) is clustering of several cardiovas- cular disease risk factors such as dyslipidaemia, hyperglyce- mia, abdominal obesity and elevated blood pressure [1,2]. Sev- eral complex etiological mechanisms such as genetics and en- vironmental factors are considered to be related to MetS [2].
MetS is considerably influenced by genetic factors. Apolipo- protein A5 (APOA5) gene is located on chromosome 11q23 in
the APOA1-C3-A4 gene cluster encoding the APOAV protein with 343 amino acids. APOA5 plays an important role in lipid metabolism and homeostasis. Moreover, plasma APOA5 levels have been considered to reduce plasma triglyceride (TG) and increase high density lipoprotein cholesterol (HDL-C) concen- trations. Several single nucleotide polymorphisms (SNPs) in the APOA5 gene have been shown to be associated with in- creased TG levels [3-5].
MicroRNAs (miRNAs) are a group of non-protein-coding https://doi.org/10.4093/dmj.2018.42.1.74
pISSN 2233-6079 · eISSN 2233-6087
small RNAs regulating gene expression post-transcriptionally [6,7]. SNPs in miRNA target site (miR-TS-SNP) may affect or impair binding of miRNAs [8] and considerably affect diverse biological functions, including disease susceptibilities (cancers, Parkinson disease, osteoporosis, diabetes, and hypertension etc.) in humans [7-10].
In the current study, a panel of five SNPs (rs619054, rs 369740771, rs376976905, rs192708363, and rs34089864) with- in APOA5 gene was selected to study their association with MetS. Rs619054 variant is significantly associated with HDL, low density lipoprotein cholesterol (LDL-C) and TG levels [11- 13]. This polymorphism disrupts hsa-mir-28-5p, hsa-mir-708, and hsa-mir-3139 binding sites, and creates a new binding site for hsa-mir-320e. Rs34089864 variant destroys hsa-mir-4511 and hsa-mir-498 binding sites, and creates new binding sites for hsa-mir-4740-5p, hsa-mir-561-5p, and hsa-mir-3169.
The main aim of our case-control study was to evaluate the genotype and allele frequencies of two variants in the three prime untranslated regions (3’UTRs) of APOA5 gene, includ- ing rs619054 (c.*31C>T or 1764C>T) and rs34089864 (c.*76C>T or c.1177C>T) to find any potential associations with MetS and multiple features of this syndrome. Further- more, we determined the haplotype frequencies and the asso- ciations of the five SNPs at the APOA5 locus with the risk of MetS.
METHODS
Study population
This case-control study included 57 patients (24 males and 33 females: mean age, 12.40±0.26 years [range, 9 to 18 years]) and 63 controls (28 males and 35 females: mean age, 13.39±0.38 years [range, 8 to 18 years]) from children and adolescent of Isfahan (a central city in Iran) [14]. According to the modified Adult Treatment Panel III (ATP III) criteria [15], the MetS was defined as clustering of the following three or more factors in one person (1) fasting TG ≥100 mg/dL; (2) HDL-C <50 mg/
dL; (3) waist circumference >75th percentile for age and gen- der in the studied population; (4) systolic blood pressure/dia- stolic blood pressure >90th percentile for gender, age, height [16]; and (5) fasting blood sugar ≥100 mg/dL. An oral assent was obtained from participants, and all parents signed a writ- ten informed consent after explaining the study objectives and details. Blood samples were collected in two separate tubes for DNA analysis and biochemical tests.
DNA genotyping
DNA was extracted from blood leukocytes using the Diatome kit (Isogen Laboratory, Moscow, Russia) according to the man- ufacturer’s recommendations. Genotyping for the 5 miR-TS- SNP at APOA5 gene was carried out by polymerase chain reac- tion (PCR) and direct sequencing. Primers A5 forward (5´- CTGCCCAGGCCCATTCCCA-3´) and A5 reverse (5´-GAC CTTCCACCCTCCACCCA-3´) were used to amplify the tar- get region of DNA. To amplify the 104 bp fragment of the APOA5 gene, the following conditions were used: a 2.5 minutes initial denaturation at 95°C was followed by 40 cycles of 50 sec- onds at 95°C; 70 seconds at 68°C; and 70 seconds at 72°C; the fi- nal extension occurred at 72°C for 15 minutes. The PCR reagent mix was as follows: Taq plus DNA polymerase, 0.25 μL (5 U/μL) (KBC, Terhran, Iran); 10× buffer, 2.5 μL; MgCl2 (50 mM), 0.75 μL; deoxynucleoside triphosphate (40 mM), 0.5 μL; DNA (200 ng/μL), 2 μL; 0.5 μL of the appropriate specific primer pairs (10 pmol/μL) and water in a final volume of 25 mL.
MiR-TS-SNPs selection
We used two different methods to select SNPs in miRNA seed regions. One approach was based on identifying the previously known miR-TS-SNPs. PolymiRTS (http://compbio.uthsc.edu/
miRSNP/) [17], MirSNP (http://202.38.126.151/hmdd/mirsnp/
search/) and miRNASNP (http://www.bioguo.org/miRNAS- NP/) are three examples of databases using this approach. In the other approach, we first predicted miRNA target sites within the 3’UTRs of the APOA5 gene by using the miRanda (http://www.microrna.org/microrna/getMirnaForm.do) [18]
and TargetScan (http://www.targetscan.org/vert_50/) [19].
Then, a list of all SNPs occurring in the 3’UTRs of the APOA5 gene was obtained from the National Center for Biotechnology Information (NCBI) dbSNP database (http://www.ncbi.nlm.
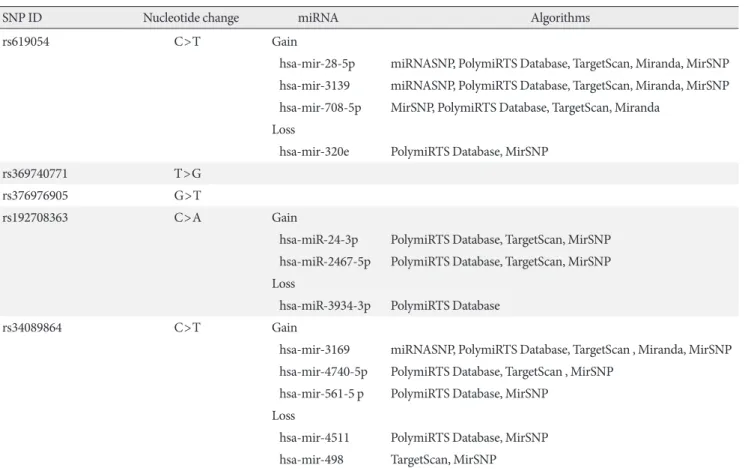
nih.gov/). The overlapping SNPs between these two steps were selected for final genotyping (Table 1).
Statistical analysis
Agreement of genotype frequencies with Hardy-Weinberg equilibrium (HWE) was determined using a modified chi- square test. Allele frequencies were estimated by gene count- ing, and the differences between case/control statuses were ex- amined by a chi-square test. Owing to a limited number of in- dividuals who were homozygous for the minor alleles of rs619054 and rs34089864, the genotypes for these two poly- morphisms were grouped as T-carriers (TC+TT) and non-
carriers (CC). One-way analysis of variance was used to com- pare mean values of quantitative traits across TC+TT/CC groups. The association between APOA5 polymorphisms and MetS was assessed by simple and multivariable adjusted odds ratio (OR) corresponding to a 95% confidence interval accord- ing to the logistic regression analysis. Multivariate regression analysis models were adjusted for age and gender. Constructed haplotypes, haplotype tags, and standardized linkage disequi- librium (LD), D’, and correlation, r2, and coefficients for all pairs of polymorphisms were assessed with Haploview soft- ware version 4.2 (Broad Institute, Cambridge, MA, USA) [20].
Furthermore, we used a four-gamete rule to define the haplo- type blocks. Haplotype frequencies were inferred using the ex- pectation-maximization by using HAPSTAT version 3.0 soft- ware (University of North Carolina, Chapel Hill, NC, USA;
http://www.bios.unc.edu/*lin/hapstat) [21,22]. Using the chi- square test, the potential difference between haplotype fre- quencies of case and control subjects was determined. Statisti- cal analyses were performed using the SPSS version 16.0 statis-
tical software (SPSS Inc., Chicago, IL, USA). All data were pre- sented in the format of mean±standard error of the mean, and P values lower than 0.05 were considered to be statistically sig- nificant.
RESULTS
Table 2 presents genotyping results and allele frequencies of the two analyzed APOA5 variants (rs619054 and rs34089864).
No significant difference was observed between the MetS and control groups for both genotype and allele frequencies of rs619054 and rs34089864. Moreover, none of the variants vio- lated the HWE (data not shown).
Tables 3 and 4 represent stratification of the biochemical laboratory parameters of the control and MetS subjects ac- cording to different genotype groups of the analyzed variants.
For rs619054, except for a borderline significant difference ob- served for insulin levels between genotype groups of control subjects, there was no statistically significant difference be- Table 1. List of five studied SNPs at the 3’UTR of APOA5 gene
SNP ID Nucleotide change miRNA Algorithms
rs619054 C>T Gain
hsa-mir-28-5p miRNASNP, PolymiRTS Database, TargetScan, Miranda, MirSNP hsa-mir-3139 miRNASNP, PolymiRTS Database, TargetScan, Miranda, MirSNP hsa-mir-708-5p MirSNP, PolymiRTS Database, TargetScan, Miranda
Loss
hsa-mir-320e PolymiRTS Database, MirSNP
rs369740771 T>G
rs376976905 G>T
rs192708363 C>A Gain
hsa-miR-24-3p PolymiRTS Database, TargetScan, MirSNP hsa-miR-2467-5p PolymiRTS Database, TargetScan, MirSNP Loss
hsa-miR-3934-3p PolymiRTS Database
rs34089864 C>T Gain
hsa-mir-3169 miRNASNP, PolymiRTS Database, TargetScan , Miranda, MirSNP hsa-mir-4740-5p PolymiRTS Database, TargetScan , MirSNP
hsa-mir-561-5 p PolymiRTS Database, MirSNP Loss
hsa-mir-4511 PolymiRTS Database, MirSNP hsa-mir-498 TargetScan, MirSNP
SNP, single nucleotide polymorphism; 3’UTR, three prime untranslated region; APOA5, apolipoprotein A5; miRNA, micro RNA.
tween other biochemical factors. For rs34089864, the HDL-C level of the CC group was significantly lower than that in the heterozygotes harbouring cytidine and thymine bases (CT) control group. Moreover, a borderline significant difference in the insulin levels between genotype groups was shown in both case and control individuals.
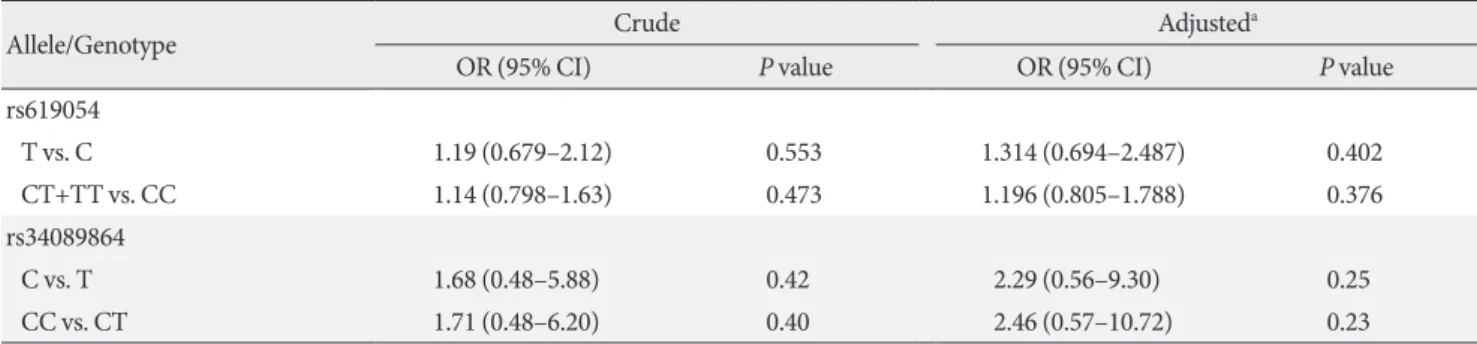
The ORs were evaluated for allelic and genotypic models (Table 5). Variant rs619054 demonstrated inconsequential ele- vated risks for MetS in both models, but both ORs were not statistically significant. Having a C allele or CC genotype in the position of rs34089864 conferred an increased risk for MetS;
however, again the risk was not statistically significant.
Haplotypes were inferred using all five studied variants of the
APOA5 gene (rs619054, rs369740771, rs376976905, rs1927 08363, and rs34089864). Rs619054 and rs34089864 were in LD with each other (D’=1, r2=0.02, LOD [logarithm of the odds to the base 10]=0.37). Three haplotypes were identified: H1, H2, and H3. These haplotypes are tagged by the genotypes of rs619054 and rs34089864 variants. Fig. 1 presents haplotype frequencies. Further analyses showed no significant difference between haplotype frequencies according to the disease status.
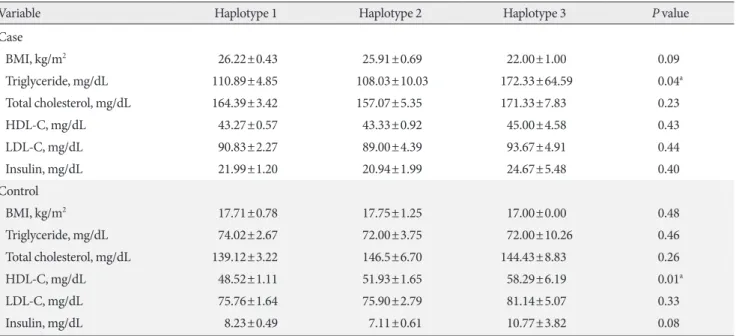
Based on stratification for different haplotypes (Table 6), MetS individuals with H3 showed significant higher levels of TG compared to other haplotypes (P=0.04). A significant in- crease in the HDL-C levels was also observed in controls with H3 compared to the other haplotypes (P=0.01).
Table 2. Genotype distributions and allele frequencies of miR-TS-SNPs in controls and patients with metabolic syndrome
Group Genotype frequency Allele frequency
Total no. TT no. TC no. CC no. χ2 P value Total no. T, n (%) C, n (%) χ2 P value rs619054
Case 59 1 30 28 0.51 0.38 118 32 (27) 86 (73) 0.35 0.28
Control 63 1 28 34 126 30 (24) 96 (76)
rs34089864
Case 59 0 4 55 0.69 0.20 118 4 (3) 114 (97) 0.66 0.20
Control 63 0 7 56 126 7 (6) 119 (94)
miR-TS-SNP, miRNA target site in single nucleotide polymorphism; TT, homozygotes harbouring thymine bases; TC, hetero zygotes harbour- ing cytidine and thymine bases; CC, homozygotes harbouring cytidine bases and labeled as non-carriers; T, thymine; C, cytosine.
Table 3. Biochemical characteristics of subjects with metabolic syndrome and controls separated according to APOA5 rs619054 different genotype groups
Characteristic CC TC+TT t value P value
Case group
Triglyceride, mg/dL 115.71±8.42 106.26±9.87 0.72 0.24
Total cholesterol, mg/dL 168.68±5.89 157.61±5.21 1.41 0.08
HDL-C, mg/dL 43.32±1.02 43.42±0.90 0.07 0.47
LDL-C, mg/dL 91.96±3.50 89.68±4.30 0.40 0.34
Insulin, mg/dL 22.70±2.08 21.81±2.11 0.30 0.38
Control group
Triglyceride, mg/dL 75.44±4.68 71.07±3.77 0.71 0.24
Total cholesterol, mg/dL 137.59±4.56 145.38±6.84 0.97 0.17
HDL-C, mg/dL 48.35±2.06 51.66±1.68 1.21 0.11
LDL-C, mg/dL 76.21±2.63 75.97±2.89 0.06 0.47
Insulin, mg/dL 8.96±0.98 7.11±0.63 1.52 0.06
Values are presented as mean±standard error of the mean.
APOA5, apolipoprotein A5; CC, homozygotes harbouring cytidine bases and labeled as non-carriers; TC+TT, T-carriers; HDL-C, high density lipoprotein cholesterol; LDL-C, low density lipoprotein cholesterol.
Table 7 shows the association between different constructed haplotypes and risk of MetS. Although not statistically signifi- cant, individuals with H3 had the most increased risk for MetS compared to those harboring H2 before and after adjustment for age and gender.
DISCUSSION
Elevated TG and lowered HDL-C levels are the major factors among patients with MetS in Iranian children and adolescents [15]. Genetic variants of APOA5 gene have been associated with the levels of TG and HDL-C in various ethnicities [23- 26]. In the current study, we have sequenced the 3’UTR of Table 4. Biochemical characteristics of subjects with metabolic syndrome and controls separated according to APOA5 rs34089864 different genotype groups
Characteristic CC CT t value P value
Case group
Triglyceride, mg/dL 108.44±5.96 142.50±54.55 1.32 0.09
Total cholesterol, mg/dL 162.20±4.21 172.00±5.58 0.62 0.27
HDL-C, mg/dL 43.24±0.69 45.25±3.25 0.75 0.23
LDL-C, mg/dL 90.25±2.96 97.75±5.36 0.67 0.25
Insulin, mg/dL 21.63±1.49 30.50±7.01 1.53 0.06
Control group
Triglyceride, mg/dL 73.61±3.22 72.00±10.26 0.164 0.43
Total cholesterol, mg/dL 140.77±4.38 144.43±8.84 0.29 0.39
HDL-C, mg/dL 48.82±1.29 58.29±6.19 2.25 0.01a
LDL-C, mg/dL 75.46±2.08 81.14±5.07 0.92 0.18
Insulin, mg/dL 7.77±0.50 10.77±3.82 1.56 0.06
Values are presented as mean±standard error of the mean.
APOA5, apolipoprotein A5; CC, homozygotes harbouring cytidine bases and labeled as non-carriers; CT, heterozygotes harbouring cytidine and thymine bases; HDL-C, high density lipoprotein cholesterol; LDL-C, low density lipoprotein cholesterol.
aStatistically significant.
Table 5. Logistic regression models for the association between APOA5 rs619054, rs34089864 and metabolic syndrome risk
Allele/Genotype Crude Adjusteda
OR (95% CI) P value OR (95% CI) P value
rs619054
T vs. C 1.19 (0.679–2.12) 0.553 1.314 (0.694–2.487) 0.402
CT+TT vs. CC 1.14 (0.798–1.63) 0.473 1.196 (0.805–1.788) 0.376
rs34089864
C vs. T 1.68 (0.48–5.88) 0.42 2.29 (0.56–9.30) 0.25
CC vs. CT 1.71 (0.48–6.20) 0.40 2.46 (0.57–10.72) 0.23
APOA5, apolipoprotein A5; OR, odds ratio; CI, confidence interval; T, thymine; C, cytosine; CT+TT, T-carriers; CC, homozygotes harbouring cytidine bases and labeled as non-carriers; CT, heterozygotes harbouring cytidine and thymine bases.
aAdjusted for age and sex.
Fig. 1. Haplotype characterization and frequencies of apolipo- protein A5 (APOA5) polymorphisms in pooled metabolic syn- drome and control groups constructed by Haploview software.
Haplotype H1 C C G T C 69.2%
Haplotype H2 C C G T T 25.8%
Haplotype H3 T C G T C 5%
rs34089864 rs192708363 rs376976905 rs369740771 rs619054
APOA5 gene in groups of 63 patients and 59 healthy controls to find potential associations with ATP III-defined MetS, and its major components in the Iranian children and adolescent population. The results showed that the alleles and genotype frequency of the two common studied SNPs (rs619054 and rs34089864) were not significantly varied in the two groups.
In one case-control study population in China, Kao et al.
[27] demonstrated that c.1177C>T (rs34089864) genotype and allele frequencies did not differ between the hypertriglyc- eridemic and control groups. In agreement with results ob- tained by Kao et al. [27], we also found no significant associa- tions between serum TG levels and c.1177C>T genotypes.
Our results demonstrated that CC genotype of variant rs34089864 was associated with lower HDL-C levels in MetS
individuals. Conversely, the data showed no association be- tween the rs619054 SNP and MetS components. In one case- control population, Pare et al. [12] showed that the rs619054 was not associated with TG, LDL-C, and HDL-C levels. Using joint analysis of the family and case-control populations, they could find a significant association with TG, but neither with LDL-C nor with HDL-C levels. Therefore, in one large popula- tion study, Grallert et al. [28] demonstrated that no significant associations were observed between rs619054, HDL-C, and LDL-C, or total cholesterol levels. In contrast, Jorgensen et al.
[11] reported that CC genotype of rs619054 SNP was associat- ed with both HDL-C and TG, but not with LDL-C levels.
Therefore, the observed discrepancies between the studies may be attributed to the different race/ethnicity and age distribu- Table 6. APOA5 haplotypes identified in the case and control groups and their correlation with anthropometric and biochemical parameters
Variable Haplotype 1 Haplotype 2 Haplotype 3 P value
Case
BMI, kg/m2 26.22±0.43 25.91±0.69 22.00±1.00 0.09
Triglyceride, mg/dL 110.89±4.85 108.03±10.03 172.33±64.59 0.04a
Total cholesterol, mg/dL 164.39±3.42 157.07±5.35 171.33±7.83 0.23
HDL-C, mg/dL 43.27±0.57 43.33±0.92 45.00±4.58 0.43
LDL-C, mg/dL 90.83±2.27 89.00±4.39 93.67±4.91 0.44
Insulin, mg/dL 21.99±1.20 20.94±1.99 24.67±5.48 0.40
Control
BMI, kg/m2 17.71±0.78 17.75±1.25 17.00±0.00 0.48
Triglyceride, mg/dL 74.02±2.67 72.00±3.75 72.00±10.26 0.46
Total cholesterol, mg/dL 139.12±3.22 146.5±6.70 144.43±8.83 0.26
HDL-C, mg/dL 48.52±1.11 51.93±1.65 58.29±6.19 0.01a
LDL-C, mg/dL 75.76±1.64 75.90±2.79 81.14±5.07 0.33
Insulin, mg/dL 8.23±0.49 7.11±0.61 10.77±3.82 0.08
Values are presented as mean±standard error of the mean.
APOA5, apolipoprotein A5; BMI, body mass index; HDL-C, high density lipoprotein cholesterol; LDL-C, low density lipoprotein cholesterol.
aStatistically significant.
Table 7. Haplotype analysis for metabolic syndrome risk
Haplotype Crude Adjusteda
OR (95% CI) P value OR (95% CI) P value
H3 vs. H2 2.33 (0.55–9.89) 0.25 3.71 (0.69–20.11) 0.13
H3 vs. H1 1.03 (0.77–1.39) 0.81 1.08 (0.78–1.50) 0.63
H1 vs. H2 2.17 (0.54–8.69) 0.27 2.86 (0.62–13.24) 0.18
OR, odds ratio; CI, confidence interval.
aAdjusted for age and sex.
tions of the studied populations.
Consistent with the results previously reported by Grallert et al. [28] who showed that rs619054 was not significantly associ- ated with MetS, we found no significant association between any of the two studied major variants and MetS risk.
We also performed a haplotype analysis constructed using five SNPs in the 3’UTR of APOA5 gene. Similar to what found in Copenhagen populations [11], rs619054 and rs34089864 were in LD in our analysis.
Among the three constructed haplotypes, H1, H2, and H3, we found a significant association between H3 haplotype, in- creased HDL-C and TG levels, but not with MetS risk. In the same vein, H1 haplotype (harboring the two major alleles of rs619054 and rs34089864) was linked to decreased HDL-C levels. Our data are in consistent with those obtained by Pull- inger et al. [29] where they constructed haplotypes with 11 APOA5 gene SNPs, including rs619054 and rs34089864 in the carriers of the c.553T polymorphism and reported that a hap- lotype containing the major alleles of variant rs619054 and rs34089864 was significantly associated with lowered levels of HDL-C.
In conclusion, our study explored the association between haplotypes of five SNPs located at APOA5 3’UTR and MetS entity as well as its major components risk. Our results showed that the constructed haplotypes might not be a major risk fac- tor for the MetS entity in Iranian children and adolescents.
However, our results demonstrated that the rs34089864 variant and H1 haplotype (harboring the two major alleles of rs619054 and rs34089864) were associated with HDL-C levels.
CONFLICTS OF INTEREST
No potential conflict of interest relevant to this article was re- ported.
ACKNOWLEDGMENTS
This study was supported in part by a research grant from the Pediatric Inherited Diseases Research Center, Research Insti- tute for Primordial Prevention of Non-communicable Disease, Isfahan University of Medical Sciences, Isfahan, Iran. The au- thors thank Prof. Mahin Hashemipour, Ms. Ghazaleh Fatemi, and Ms. Hajar Miranzadeh for their great help in the sample collection and experiments optimization steps.
REFERENCES
1. Pollex RL, Hegele RA. Genetic determinants of the metabolic syndrome. Nat Clin Pract Cardiovasc Med 2006;3:482-9.
2. Roche HM, Phillips C, Gibney MJ. The metabolic syndrome:
the crossroads of diet and genetics. Proc Nutr Soc 2005;64:371- 7.
3. Chien KL, Hsu HC, Chen YC, Su TC, Lee YT, Chen MF. Asso- ciation between sequence variant of c.553 G > T in the apolipo- protein A5 gene and metabolic syndrome, insulin resistance, and carotid atherosclerosis. Transl Res 2009;154:133-41.
4. Nilsson SK, Heeren J, Olivecrona G, Merkel M. Apolipoprotein A-V: a potent triglyceride reducer. Atherosclerosis 2011;219:15- 21.
5. Zhang Z, Peng B, Gong RR, Gao LB, Du J, Fang DZ, Song YY, Li YH, Ou GJ. Apolipoprotein A5 polymorphisms and risk of coronary artery disease: a meta-analysis. Biosci Trends 2011;5:
165-72.
6. Alexander R, Lodish H, Sun L. MicroRNAs in adipogenesis and as therapeutic targets for obesity. Expert Opin Ther Targets 2011;15:623-36.
7. Heneghan HM, Miller N, Kerin MJ. Role of microRNAs in obesity and the metabolic syndrome. Obes Rev 2010;11:354- 61.
8. Hu Z, Bruno AE. The influence of 3’UTRs on microRNA func- tion inferred from human SNP data. Comp Funct Genomics 2011;2011:910769.
9. Ye Q, Zhao X, Xu K, Li Q, Cheng J, Gao Y, Du J, Shi H, Zhou L.
Polymorphisms in lipid metabolism related miRNA binding sites and risk of metabolic syndrome. Gene 2013;528:132-8.
10. Ziebarth JD, Bhattacharya A, Chen A, Cui Y. PolymiRTS Data- base 2.0: linking polymorphisms in microRNA target sites with human diseases and complex traits. Nucleic Acids Res 2012;40:
D216-21.
11. Jorgensen AB, Frikke-Schmidt R, West AS, Grande P, Nordest- gaard BG, Tybjaerg-Hansen A. Genetically elevated non-fast- ing triglycerides and calculated remnant cholesterol as causal risk factors for myocardial infarction. Eur Heart J 2013;34:1826- 33.
12. Pare G, Serre D, Brisson D, Anand SS, Montpetit A, Tremblay G, Engert JC, Hudson TJ, Gaudet D. Genetic analysis of 103 candidate genes for coronary artery disease and associated phenotypes in a founder population reveals a new association between endothelin-1 and high-density lipoprotein cholester- ol. Am J Hum Genet 2007;80:673-82.
13. Silander K, Alanne M, Kristiansson K, Saarela O, Ripatti S, Auro K, Karvanen J, Kulathinal S, Niemela M, Ellonen P, Var- tiainen E, Jousilahti P, Saarela J, Kuulasmaa K, Evans A, Perola M, Salomaa V, Peltonen L. Gender differences in genetic risk profiles for cardiovascular disease. PLoS One 2008;3:e3615.
14. Salehi S, Emadi-Baygi M, Rezaei M, Kelishadi R, Nikpour P.
Identification of a new single-nucleotide polymorphism within the apolipoprotein A5 gene, which is associated with metabolic syndrome. Adv Biomed Res 2017;6:24.
15. Kelishadi R, Ardalan G, Gheiratmand R, Adeli K, Delavari A, Majdzadeh R; Caspian Study Group. Paediatric metabolic syn- drome and associated anthropometric indices: the CASPIAN Study. Acta Paediatr 2006;95:1625-34.
16. National High Blood Pressure Education Program Working Group on Hypertension Control in Children and Adolescents.
Update on the 1987 task force report on high blood pressure in children and adolescents: a working group report from the na- tional high blood pressure education program. Pediatrics 1996;
98(4 Pt 1):649-58.
17. Bao L, Zhou M, Wu L, Lu L, Goldowitz D, Williams RW, Cui Y.
PolymiRTS Database: linking polymorphisms in microRNA target sites with complex traits. Nucleic Acids Res 2007;35:D51- 4.
18. Betel D, Wilson M, Gabow A, Marks DS, Sander C. The mi- croRNA.org resource: targets and expression. Nucleic Acids Res 2008;36:D149-53.
19. Lewis BP, Burge CB, Bartel DP. Conserved seed pairing, often flanked by adenosines, indicates that thousands of human genes are microRNA targets. Cell 2005;120:15-20.
20. Barrett JC, Fry B, Maller J, Daly MJ. Haploview: analysis and visualization of LD and haplotype maps. Bioinformatics 2005;21:263-5.
21. Lin DY, Zeng D, Millikan R. Maximum likelihood estimation of haplotype effects and haplotype-environment interactions in association studies. Genet Epidemiol 2005;29:299-312.
22. Lin DY, Zeng D. Likelihood-based inference on haplotype ef- fects in genetic association studies. J Am Stat Assoc 2006;101:89- 104.
23. Dorfmeister B, Cooper JA, Stephens JW, Ireland H, Hurel SJ, Humphries SE, Talmud PJ. The effect of APOA5 and APOC3 variants on lipid parameters in European Whites, Indian Asians and Afro-Caribbeans with type 2 diabetes. Biochim Biophys Acta 2007;1772:355-63.
24. Lai CQ, Demissie S, Cupples LA, Zhu Y, Adiconis X, Parnell LD, Corella D, Ordovas JM. Influence of the APOA5 locus on plasma triglyceride, lipoprotein subclasses, and CVD risk in the Framingham Heart Study. J Lipid Res 2004;45:2096-105.
25. Martinelli N, Trabetti E, Bassi A, Girelli D, Friso S, Pizzolo F, Sandri M, Malerba G, Pignatti PF, Corrocher R, Olivieri O. The -1131 T>C and S19W APOA5 gene polymorphisms are asso- ciated with high levels of triglycerides and apolipoprotein C- III, but not with coronary artery disease: an angiographic study. Atherosclerosis 2007;191:409-17.
26. Nabika T, Nasreen S, Kobayashi S, Masuda J. The genetic effect of the apoprotein AV gene on the serum triglyceride level in Japanese. Atherosclerosis 2002;165:201-4.
27. Kao JT, Wen HC, Chien KL, Hsu HC, Lin SW. A novel genetic variant in the apolipoprotein A5 gene is associated with hyper- triglyceridemia. Hum Mol Genet 2003;12:2533-9.
28. Grallert H, Sedlmeier EM, Huth C, Kolz M, Heid IM, Meising- er C, Herder C, Strassburger K, Gehringer A, Haak M, Giani G, Kronenberg F, Wichmann HE, Adamski J, Paulweber B, Illig T, Rathmann W. APOA5 variants and metabolic syndrome in Caucasians. J Lipid Res 2007;48:2614-21.
29. Pullinger CR, Aouizerat BE, Movsesyan I, Durlach V, Sijbrands EJ, Nakajima K, Poon A, Dallinga-Thie GM, Hattori H, Green LL, Kwok PY, Havel RJ, Frost PH, Malloy MJ, Kane JP. An apo- lipoprotein A-V gene SNP is associated with marked hypertri- glyceridemia among Asian-American patients. J Lipid Res 2008;49:1846-54.