ABSTRACT
BACKGROUND/OBJECTIVES: To assess the longitudinal associations of the antioxidant capacity of zinc and body mass index (BMI) with serum uric acid (SUA) in South Korean children.
SUBJECTS/METHODS: Using follow-up data from the Ewha Birth and Growth Cohort, we included subjects who were seen at 3 and 7 years of age (n = 183; 90 boys, 93 girls). Daily zinc intake and BMI were assessed at 3 and 7 years of age. SUA measured at 7 years was used as the outcome variable. Using a general linear model, the effects of dietary zinc intake and BMI on SUA were assessed. We also assessed the combined effect of early dietary zinc intake and BMI on SUA in children.
RESULTS: The dietary zinc intake at 3 years of age was negatively correlated (ρ = −0.18, P = 0.04), whereas the BMI at 7 years of age was positively correlated (r = 0.18, P = 0.01), with the SUA level at 7 years of age. The dietary zinc intake level at 3 years of age and the BMI level at 7 years of age were, together, significantly related to SUA in children at 7 years of age. SUA was lower in group 1 (normal-weight, high-zinc group) than in the other two groups (group 2: normal- weight, low-zinc and overweight, high-zinc group; and group 3: overweight, low-zinc group).
Our results demonstrate the combined effect of zinc intake and BMI on SUA. The combined association remained significant in both the crude and adjusted models (P < 0.01).
CONCLUSIONS: SUA was related to combined BMI and dietary zinc intake, and increased zinc intake and normal body weight had a beneficial effect on reducing SUA in children.
Keywords: Uric acid; pediatric obesity; zinc; antioxidants
INTRODUCTION
Serum uric acid (SUA) level in childhood is important because it is correlated with susceptibility to various diseases in adulthood, such as hypertension, cardiovascular disease, and chronic kidney disease [1,2]. There is increasing evidence that SUA plays a role in childhood health,
Original Research
Received: Jan 22, 2019 Revised: Feb 18, 2019 Accepted: Jan 16, 2020
§
Corresponding Author:
Boyun Park
Department of Preventive Medicine, Ewha Womans University Seoul Hospital, College of Medicine, Ewha Womans University, 25 Magokdong-ro 2-gil, Gangseo-gu, Seoul 07804, Korea.
Tel. +82-2-6986-6242 Fax. +82-2-6986-6248 E-mail. [email protected] Hyesook Park
Department of Preventive Medicine, Ewha Womans University Seoul Hospital, College of Medicine, Ewha Womans University, 25 Magokdong-ro 2-gil, Gangseo-gu, Seoul 07804, Korea.
Tel. +82-2-6986-6241 Fax. +82-2-6986-6248 E-mail. [email protected]
©2020 The Korean Nutrition Society and the Korean Society of Community Nutrition This is an Open Access article distributed under the terms of the Creative Commons Attribution Non-Commercial License (https://
creativecommons.org/licenses/by-nc/4.0/) which permits unrestricted non-commercial use, distribution, and reproduction in any medium, provided the original work is properly cited.
Sung Hee Lee 1 , Hye Ah Lee 2 , Eun Ae Park 3 , Su Jin Cho 3 , Se Young Oh 4 , Bohyun Park 1§ , and Hyesook Park 1§
1
Department of Preventive Medicine, Ewha Womans University Seoul Hospital, College of Medicine, Ewha Womans University, Seoul 07804, Korea
2
Clinical Trial Center, Ewha Womans University Mokdong Hospital, Seoul 07985, Korea
3
Department of Pediatrics, Ewha Womans University Mokdong Hospital, College of Medicine, Ewha Womans University, Seoul 07985, Korea
4
Department of Food & Nutrition, College of Human Ecology, Kyung Hee University, Seoul 02447, Korea
Combined effects of dietary zinc at 3
years of age and obesity at 7 years of
age on the serum uric acid levels of
Korean children
ORCID iDs Sung Hee Lee
https://orcid.org/0000-0003-3677-9012 Hye Ah Lee
https://orcid.org/0000-0002-4051-0350 Eun Ae Park
https://orcid.org/0000-0002-1685-4276 Su Jin Cho
https://orcid.org/0000-0002-3851-9073 Se Young Oh
https://orcid.org/0000-0003-0803-729X Bohyun Park
https://orcid.org/0000-0002-8538-9662 Hyesook Park
https://orcid.org/0000-0002-9359-6522 Funding
This work was supported by the Basic Science Research Program through the National Research Foundation of Korea (NRF), funded by the Ministry of Science, ICT & Future Planning (NRF-2014R1A1A3051023) and National Research Foundation of Korea (NRF) grant funded by the Korea government (MSIT) (NRF-2017R1D1A1B03028406).
Conflict of interest
The authors declare no potential conflicts of interests.
Author Contributions
Conceptualization: Park H, Park B; Data curation: Park EA, Cho SJ, Oh SY; Formal analysis: Lee SH, Lee HA; Funding acquisition:
Park H; Investigation: Park H, Park B, Lee SH, Lee HA; Methodology: Park H, Park B, Lee HA;
Project administration: Park H; Resources:
Park H; Software: Lee SH, Lee HA; Supervision:
Park H, Park B; Validation: Park EA, Cho SJ, Oh SY; Visualization: Park B, Lee SH; Writing - original draft: Lee SH; Writing - review &
editing: Park H, Park B
including pediatric hypertension [3]. Hypertension in childhood has become a major health concern [4,5]. A systematic review and meta-analysis reported that the overall prevalence of elevated blood pressure (BP, systolic or diastolic blood pressure ≥ 95th percentile) in children aged 2–19 years was 5.5% (95% CI, 4.2–6.9), and the prevalence of slightly elevated BP (systolic or diastolic blood pressure ≥ 90th percentile and < 95th percentile) was 12.7% (2.1–30.4) [6].
A few cross-sectional or case studies have examined children with SUA and hypertension, but these studies have focused primarily on those over 6 years of age [7,8]. Previously, we found that the SUA level at 3 years of age was positively related to BP, and a high SUA at 3 years of age contributed to an elevated BP at 7 years of age [9]. Further studies are needed to confirm our findings regarding the critical period when SUA begins to affect health.
Various factors increase SUA, such as aging, diet, and obesity [10,11]. High SUA levels were observed in an obese group, and a positive correlation between SUA and BP has been reported [5]. In a cross-sectional survey of 1,027 subjects aged 6–14 years in Japan, hyperuricemia was associated with most the common abnormal component of the metabolic syndrome [12]. In our previous cohort study, we also found that 3-year-old children with a high weight or high body mass index (BMI) had an elevated SUA [13].
Antioxidants might also control SUA. Zinc is an essential micronutrient in human metabolism [14-16]. The mechanism underlying the association of dietary zinc intake with SUA levels is not clear, but it might involve its antioxidant properties [17]. A cross-sectional study found a negative association between dietary zinc intake and hyperuricemia in middle-aged men in China [18]. Zhang et al. [19] also reported that the dietary zinc intake was inversely associated with hyperuricemia in Americans (n = 24,975) aged 20 years or older who participated in the National Health and Nutrition Examination Survey (NHNES) from 2001 to 2014.
However, there is insufficient evidence of the effects of lifestyle factors in healthy children.
Therefore, this study investigated the associations of dietary zinc and BMI with SUA levels in early childhood in South Korea. We also examined whether BMI and zinc intake have a combined effect on SUA level.
SUBJECTS AND METHODS
Study subjects
This study used follow-up data from the Ewha Birth and Growth Cohort, which was established in 2001 at Ewha Womans University Mok-Dong Hospital. This birth cohort has already been described in detail elsewhere [13,20]. Of the 940 children enrolled in the birth cohort, data were available on 469 children at 3 years old (233 boys, 236 girls) and on 369 children at 7 years old (182 boys, 187 girls). For this study, we used data on BMI, dietary intake, and SUA level. Repeated measures of data for both follow-up times were obtained from 183 children. The Institutional Research Board on human subjects at Ewha Womans University approved the protocol (ETC 176-17, EUMC-2015-04-048, EUMC-2018-01-002), and informed consent was obtained.
Data
At the follow-up visits, trained examiners measured current weight to one decimal place with
a calibrated scale while the subjects wore light clothing; they measured height in stocking
feet using a stadiometer (DS-102 model; Dong Sahn Jenix, Seoul, Korea). BMI was calculated
as weight in kilograms divided by height in meters squared (kg/m
2). The SUA level (mg/dL) was measured using the uricase- and peroxidase-coupled reaction method on a Hitachi 7180 chemistry analyzer (Hitachi, Fukuoka, Japan). Daily nutritional intake was assessed using a 2-day 24-h dietary recall survey completed by the parents of the participating children. Food models and measuring bowls, cups, and spoons were used to assist in estimating portion sizes. The record for each subject was coded, and standard reference tables were used to convert portions of foods measured by household items into gram weights. A nutrition specialist quantified the dietary intake using CAN-Pro ver. 3.0 [21]. In this study, we used data on the dietary intake of zinc, vitamin C, and total energy.
Statistical analysis
The data were analyzed using SAS ver. 9.4 (SAS Institute, Cary, NC, USA). Continuous data are expressed as the mean ± SD (normally distributed data) or median and interquartile range (skewed data), and categorical data are expressed as the number of subjects with percentages.
We considered SUA at 7 years of age as a major outcome. Repeated measurements of dietary zinc intake and BMI at 3 and 7 years of age were used as independent factors. We calculated the Pearson's correlation coefficients between BMI at 3 and 7 years of age and the SUA level at 7 years of age. Spearman's rank correlation analysis was used to examine the association between dietary zinc at 3 and 7 years of age and SUA at 7 years of age because the zinc data were not normally distributed.
Considering the statistical power, we used operational definitions of overweight and low zinc intake for the combined effect analysis. The zinc intake level was categorized as low (< 75
thpercentile, < 6.77 mg) or high (≥ 75
thpercentile, 6.77 to 11.80 mg). Overweight was categorized as ≥ 85
thpercentile of BMI according to the 2007 Korean Children and Adolescents Growth Standards [22]. To assess the combined effect of zinc intake and BMI on SUA, we used data on dietary zinc intake at 3 years of age and BMI at 7 years of age, which have significant correlations with SUA at 7 years of age. Because there were only two subjects in the overweight, high-zinc group, the analysis examined the low-risk (group 1), high-risk (group 3), and remainder (group 2) groups. Group 1 was the normal-weight, high-zinc group;
group 2 was the normal-weight, low-zinc and overweight, high-zinc group; and group 3 was the overweight, low-zinc group.
We constructed a general linear model after adjusting for sex, total energy (kcal), and vitamin C intake [23] and Zn intake at 7 years of age. The results are expressed as adjusted means with SEs and a P-value. A 2-tailed P-value < 0.05 was considered significant.
RESULTS
General characteristics
Table 1 summarizes the basic characteristics of the study population. Overall, 183 participants were followed up at both 3 and 7 years of age, and 50.8% were girls (90 boys and 93 girls). All anthropometric data were within the normal ranges at 3 and 7 years of age according to the 2007 Korean Children and Adolescents Growth Standards [22].
Effects of zinc intake and BMI on serum uric acid
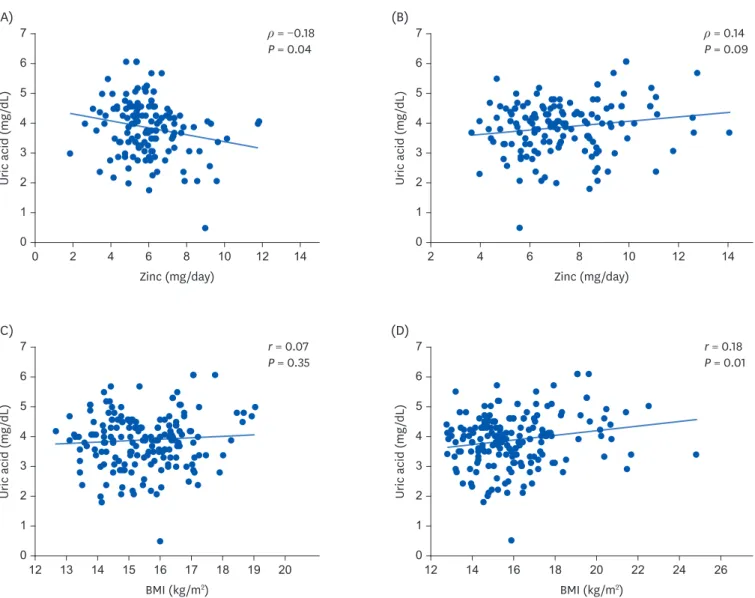
Fig. 1 shows the correlations between the SUA level at 7 years of age and the zinc intake or
BMI at 3 and 7 years of age, respectively. Zinc intake at 3 years old was negatively correlated
with an SUA at 7 years of age (Spearman's ρ = −0.18, P = 0.04). BMI at 7 years of age was positively correlated with SUA (Pearson's r = 0.18, P = 0.01) at 7 years of age, whereas BMI at 3 years of age was not correlated with SUA at 7 years of age. There was no significant relationship between the zinc intake at 7 years old and the SUA level at 7 years. Based on the Table 1. Characteristics of study participants followed at both 3 and 7 years of age
Characteristics 3 years of age (n = 183) 7 years of age (n = 183)
Girls 93 (50.8%) 93 (50.8%)
Height (cm) 97.11 ± 4.37 123.30 ± 4.69
Weight (kg) 14.61 ± 1.72 24.47 ± 4.12
Body mass index (kg/m
2) 15.47 ± 1.27 16.02 ± 2.10
Vitamin C (mg/day) 45.38 (28.96–70.08) 55.92 (33.99–84.55)
Zinc (mg/day) 5.86 (4.97–6.77) 6.41 (5.34–8.01)
Total energy (kcal/day) 1,231.0 ± 259.1 1,447.7 ± 275.1
Serum uric acid (mg/dL) 3.69 ± 0.67 3.89 ± 0.89
Data shown as number of participants (%), mean ± SD, or median (interquartile range).
(A)
Uric acid (mg /dL )
7
5 6
4 3 2 1
0 0 2 4 6 8 10 12 14
Zinc (mg/day)
ρ = −0.18 P = 0.04
(B)
Uric acid (mg /dL )
7
5 6
4 3 2 1
0 2 4 6 8 10 12 14
Zinc (mg/day)
ρ = 0.14 P = 0.09
(C)
Uric acid (mg /dL )
7
5 6
4 3 2 1
0 12 13 14 15 16 17 18 19 20
BMI (kg/m
2)
r = 0.07 P = 0.35
(D)
Uric acid (mg /dL )
7
5 6
4 3 2 1
0 12 14 16 18 20 22 24 26
BMI (kg/m
2)
r = 0.18 P = 0.01
Fig. 1. Correlations between zinc intake or BMI and SUA level at 7 years of age. (A) Spearman correlation of zinc intake (mg/day) at 3 years old with SUA level (mg/dL) at 7 years. (B) Spearman correlation of zinc intake (mg/day) at 7 years old with SUA level (mg/dL) at 7 years. (C) Pearson correlation of BMI (kg/m
2) at 3 years old with SUA level (mg/dL) at 7 years. (D) Pearson correlation of BMI (kg/m
2) at 7 years old with SUA level (mg/dL) at 7 years.
BMI, body mass index; SUA, serum uric acid.
results in Fig. 1, we then analyzed the zinc intake at 3 years of age and BMI at 7 years of age, as shown in Table 2.
Combined effect of zinc intake and BMI on serum uric acid
The general liner model revealed the effects of zinc intake and BMI on SUA at 7 years of age (Table 2). The high-zinc-intake group had a lower mean SUA level than the low-zinc-intake group in the crude model (3.48 vs. 4.01 mg/dL, P < 0.01; Model 1). The significance remained in Model 2 (3.49 vs. 3.95 mg/dL, P = 0.04), which was adjusted for sex, total energy at 3 years of age, and BMI at 7 years of age, as well as in model 3 (3.49 vs. 3.95 mg/dL, P = 0.04), which was further adjusted for vitamin C intake at 3 years of age. The overweight group (high BMI) had a significantly higher mean SUA at 7 years of age than the normal-weight group in the crude (4.40 vs. 3.82 mg/dL, P < 0.01) and adjusted models (Model 2: 4.53 vs. 3.75 mg/dL, P < 0.01 and Model 3: 4.53 vs. 3.75 mg/dL, P < 0.01).
The third section of Table 2 summarizes the combined effect of zinc intake at 3 years and BMI at 7 years on SUA at 7 years of age. The participants were divided into three subgroups (group 1: normal-weight, high-zinc group; group 2: normal-weight, low-zinc and overweight, high-zinc group; and group 3: overweight, low-zinc group) to assess the combined effects of zinc intake and BMI on SUA. SUA was lower in the normal-body-weight, high-zinc group (3.43 mg/dL, P < 0.01) than in the other 2 groups (3.87 mg/dL in normal-weight, low-zinc and overweight, high-zinc groups and 4.50 mg/dL in the overweight, low-zinc group) even when adjusted for sex, total energy, and vitamin C intake at 3 years. There was no difference in SUA levels between Model 2* and Model 3
†.
DISCUSSION
In this study, we found that BMI at 7 years of age and zinc intake at 3 years of age were associated with SUA level in children at 7 years of age. Combined, a relatively high zinc intake and normal body weight was significantly associated with a decrease in SUA.
Although the precise mechanism of the association between childhood SUA and related diseases in adulthood is not clear, Feig [2] demonstrated a significant correlation between Table 2. Effects of zinc intake and BMI on serum uric acid level (mg/dL) at 7 years of age
Variables No. Model 1 Model 2 Model 3
Mean ± SE P-value Mean ± SE P-value Mean ± SE P-value
Zinc intake at 3 years
‡< 0.01 0.04 0.04
High (≥ 75th percentile) 35 3.48 ± 0.15 3.49 ± 0.20 * 3.49 ± 0.20
†Low (< 75th percentile) 104 4.01 ± 0.09 3.95 ± 0.10 * 3.95 ± 0.10
†BMI at 7 years
§< 0.01 < 0.01 < 0.01
Overweight 22 4.40 ± 0.19 4.53 ± 0.25 4.53 ± 0.25
Normal weight 161 3.82 ± 0.07 3.75 ± 0.09 3.75 ± 0.09
Zinc × BMI
∥< 0.01 < 0.01 < 0.01
Group 1 33 3.46 ± 0.16 3.43 ± 0.20 3.43 ± 0.20
Group 2 92 3.93 ± 0.09 3.87 ± 0.10 3.87 ± 0.11
Group 3 14 4.50 ± 0.24 4.50 ± 0.26 4.50 ± 0.26
Model 1: crude model (not adjusted); Model 2: adjusted for sex, total energy at 3 years and Zn intake at 7 years; Model 3: adjusted for sex, total energy and vitamin C intake at 3 years and Zn intake at 7 years.
BMI, body mass index.
* Additionally adjusted for BMI at 7 years in Model 2;
†Additionally adjusted for BMI in Model 3;
‡High: ≥ 75th percentile, cut-off point of zinc intake 6.766 mg/day;
§