http://crossmark.crossref.org/dialog/?doi=10.14474/ptrs.2020.9.4.287&domain=pdf&date_stamp=2020-12-25
Received: 24 November, 2020 Revised: 3 December, 2020 Accepted: 3 December, 2020 Corresponding author: Wan-Hee Lee (ORCID https://orcid.org/0000-0001-8030-4853)
Department of Physical Therapy, College of Health Science and Social Welfare, Sahmyook University, 815 Hwarang-ro, Nowon-gu, Seoul 01795, Republic of Korea Tel: 82-2-3399-1633 Fax: 82-2-3399-1639 E-mail: [email protected]
This is an Open-Access article distributed under the terms of the Creative Commons Attribution Non-Commercial License (http://creativecommons.org/licenses/
by-nc/4.0) which permits unrestricted non-commercial use, distribution, and reproduction in any medium, provided the original work is properly cited.
Copyright © 2020 Korean Academy of Physical Therapy Rehabilitation Science https://doi.org/10.14474/ptrs.2020.9.4.287
pISSN 2287-7576 eISSN 2287-7584
Phys Ther Rehabil Sci 2020, 9 (4), 287-294 www.jptrs.org
The effects of two different visual feedback exercise tools based on rehabilitative ultrasound imaging in the elderly
Jang-Hoon Shina , Wan-Hee Leeb
aDepartment of Physical Therapy, The Graduate School, Sahmyook University, Seoul, Republic of Korea
bDepartment of Physical Therapy, College of Health Science and Social Welfare, Sahmyook University, Seoul, Republic of Korea
Objective: This study aimed to investigate the effects of an ultrasound-based bar graph proportional to the quadriceps muscle thickness as a real-time visual feedback training tool in the elderly.
Design: Cross-sectional study.
Methods: Twenty-four elderly persons participated in this study and were randomly divided into three groups: oral training group (n=8, group 1), ultrasound imaging group (n=8, group 2), and graph group (n=8, group 3). In the pre condition, all participants per- formed maximal voluntary isometric contraction (MVIC) of the quadriceps with knee extension three times with oral training. In the post condition, group 1 performed MVIC of the quadriceps with oral training, group 2 performed MVIC of the quadriceps with real-time visual feedback using ultrasound imaging, and group 3 performed MVIC of the quadriceps with real-time visual feed- back using a bar graph proportional to the quadriceps muscle thickness, three times for all groups. Muscle thickness, activity (mean, peak), tone, stiffness, logarithmic decrement, relaxation, and creep were measured in both conditions in all participants.
Results: Visual feedback with a bar graph showed significant effects on muscle thickness, mean muscle activity, and peak muscle activity compared with oral training and visual feedback with ultrasound imaging (p<0.05).
Conclusions: Isometric training of the quadriceps with real-time visual feedback using a bar graph proportional to the quad- riceps muscle thickness may be more effective than other methods in improving muscle thickness and muscle activity. This study presented a tool that can help increase muscle thickness in the elderly.
Key Words: Aged, Quadriceps muscle, Ultrasonography, Visual feedback
Introduction
Aging societies are prevalent worldwide. Physical activ- ity decline occurs in the elderly population, which engages in less than one-fifth of the recommended physical activity for older people [1]. The muscle weakens with old age [2]. In particular, the quadriceps muscle is vulnerable to loss of muscle power, thickness, and endurance during daily activities. Since the quadriceps is the key muscle for stand- ing up or walking, strengthening this muscle group is im- portant in the elderly. In addition to strengthening the quad- riceps muscle, which is an important muscle, a whole streng- thening program is required for the elderly population.
Therefore, various training methods to slow the progression of muscle weakness in the elderly are being explored, and it has been reported that regular resistance exercise training may be the most effective intervention for improving muscle strength and physical function in this population [3].
However, considering their reduced activity and cardiopul- monary ability, elderly people experience difficulty in per- forming such high-intensity training [4]. Thus far, most methods for strengthening muscles are implemented using oral training [5]. Recently, visual feedback has been a focus of studies for rehabilitation programs. Previous studies have proven that providing visual feedback using ultrasound imaging in real-time is an effective way to strengthen se-
so more effective than the conventional method [7].
Ultrasound has emerged as a safe and reliable device for measuring muscle thickness and cross-sectional area, and muscle thickness measured using ultrasound provides im- portant information related to muscle function [8]. In addi- tion, ultrasound has similar measurement accuracy to com- puted tomography, with greater cost-effectiveness [9].
However, it is difficult for participants in a training program to distinguish the target muscle from other tissues because the image consists of only black and white color. To solve this problem, we developed the software Rehabilitative Ultrasound Imaging 1.0 (RUSI 1.0) in which it generates a bar graph. During training, RUSI 1.0 provides a visual rep- resentation of the extent of muscle contraction in real-time.
Therefore, we performed this study to determine the effec- tiveness and utility of this software compared with the con- ventional method of quadriceps muscle rehabilitation in the elderly.
Methods
ParticipantsIn this study, 24 elderly persons (5 male, and 19 female) participated. The sample size of the study was calculated us- ing G*Power version 3.1.9.4 (Universität Kiel, Kiel, Germany), with an effect size of 0.7 and power of 0.8. The inclusion criteria were as follows: age 60-80 years, an ambu- latory status, no history of a central nervous system disease in the last 6 months, no pain related to the musculoskeletal system, and no limitation in the range of motion of the lower extremity. The exclusion criteria were as follows: inability to participate in the study due to diseases such as diabetes, or hypertension, difficulty in understanding the examiner’s in- structions, score <26 points on the Mini Mental State Examination, having a malignant tumor, and being judged inappropriate by the researcher. The 24 participants were randomly divided into three groups: oral training group (n=8), ultrasound imaging group (n=8), and graph group (n=8). The study was approved by the Institutional Review Board of Sahmyook University (IRB No. 2-1040781-A-N- 012020031HR). The objective of the study and its require- ments were explained to the subjects, and all participants provided written consent in accordance with the ethical prin- ciples of the Declaration of Helsinki.
Muscle thickness was measured using a hands-free fixed probe with a personal computer-based muscle viewer (PC- BMW) (MicrUs EXT-1H; TELEMED, Vilnius, Lithuania) in which the RUSI 1.0 software was mounted [10,11]. Mean muscle activity and peak muscle activity were measured us- ing a surface EMG system (TeleMyo 2400 G2; Noraxon, Scottsdale, AZ, USA). Muscle tone, stiffness, logarithmic decrement, relaxation, and creep were measured using MyotonPRO (Myoton AS, Tallinn, Estonia). Images were acquired at 12 MHz. The hands-free fixed probe is designed with hooks that can be wrapped around the extremities. The strap allows the transducer to be attached to the skin in order to prevent the transducer from moving during the measure- ment process [12]. The sites of the transducer were stand- ardized in all measurements. The site of the quadriceps was marked at two-thirds of the distance between the anterior su- perior iliac spine and superior pole of the patella. A TeleMyo DTS Telemetry system (Noraxon) was used to collect EMG signals from the rectus femoris, vastus medialis, and vastus lateralis. The electrode sites were shaved using a razor and was cleaned using rubbing alcohol. Surface electrode pairs were positioned with an inter electrode distance of 2 cm.
Reference electrodes were integrated on the lateral tibial condyle. EMG data were collected for the rectus femoris (with the electrodes placed at the middle of the anterior supe- rior iliac spine line and the upper part of the patella), vastus medialis (with the electrodes placed at the middle of the su- perior anterior iliac spine and the joint space at the anterior border of the medial collateral ligament), and vastus lateralis (with the electrodes placed at one-third of the distance be- tween the superior anterior iliac spine and the lateral side of the patella). EMG signals were amplified, band-pass filtered (10 and 450 Hz), and notch filtered (60 and 120 Hz) before being digitally recorded at 1,000 Hz and processed into the root mean square with a moving window (1-s duration and 100-ms steps) through the recording process stage [13].
MyotonPRO was placed right above the ultrasound probe for measuring the rectus femoris [14]. The hands-free fixed probe of PC-BMW was placed at 60% of the superior ante- rior iliac spine and the superior border of the patella. A towel was placed under the knee [15]. To assess the above meas- urements, the 24 participants in all groups were placed in sit- ting position on a bed with the feet hanging over the edge and the hip at 90 flexion with knee extension (Figure 1). In the pre-condition, the participants maximally contracted their
Figure 1. Measuring quadriceps thickness with Rehabilitative Ultrasound Imaging 1.0 software linked to personal computer- based muscle viewer.
Figure 2. Executing Rehabilitative Ultrasound Imaging 1.0 software. Yellow line - quadriceps muscle thickness. Red line - converted bar graph proportional to the yellow line distance in real time.
quadriceps voluntarily (isometric contraction) three times with oral training. In the post-condition, the participants in the oral training group (group 1) contracted their quadriceps maximally with oral training, similar to the pre-condition;
the participants in the ultrasound imaging group (group 2) contracted their quadriceps maximally three times with vis- ual feedback using ultrasound imaging in real-time; and the participants in the graph group (group 3) contracted their quadriceps maximally three times with visual feedback us- ing RUSI 1.0, which generated a bar graph proportional to the thickness of the quadriceps in real time (Figure 2).
RUSI 1.0
RUSI 1.0 (Figure 1) is a software that was developed as a visual feedback device with PC-BMW. This software was made with emphasis on generating a bar graph proportional to the quadriceps muscle thickness by using ultrasound im- age data, for use as a tool in isometric muscle strengthening training of the quadriceps in the elderly. To activate the soft- ware, two points were set: one was on the middle of the bor- der of the upper fascia of the rectus femoris, and the other was on the middle of the border of the femur bone. Both points were on hyperechoic regions; therefore, when the muscle was contracted, the points were detected by echoge- nicity. The distance between the two points indicated the thickness of the quadriceps. Depending on the distance, the software generated a bar graph that changed its height pro- portionally in real time. The bar graph showed four different
colors according to the percentage of maximal voluntary contraction (>100%: blue, 95%-100%: green, 88%-94%:
yellow, <88%: red) during exercise training in the elderly.
When the viewer showed a blue or green graph, a 5-s count-down timer was activated with instructions to the par- ticipants to keep contracting the muscle. The data for max- imal thickness was automatically saved daily in order to check the recovery status.
Statistical analysis
The statistical program PASW Statistics for Windows, Version 18.0 (SPSS Inc., Chicago, IL, USA) was used for data analysis. The general characteristics of the participants were analyzed using descriptive statistics, and the pre- and post- changes between groups were analyzed using the one- way analysis of variance test. The statistical significance level of all data was p<0.05.
Results
Demographic characteristics
The demographic characteristics are shown in Table 1.
The participants consisted of 24 healthy elderly persons (5 male and 19 female) with a mean age of 75.00 (5.03) years, mean height of 154.50 (6.76) cm, mean weight of 58.77 (7.11) kg, and mean body mass index of 24.63 (2.60) kg/m2. Differences in pre- and post quadriceps thickness be- tween groups
The differences in the quadriceps thickness between
Table 1. Demographic characteristics (N=24)
Characteristics Value
Sex (female/male) 19/5
Age (y) 75.00 (5.03)
Height (cm) 154.50 (6.76)
Weight (kg) 58.77 (7.11)
Body mass index (kg/m2) 24.63 (2.60)
Dominant side (left/right) 2/22
Values are presented as number only or mean (SD).
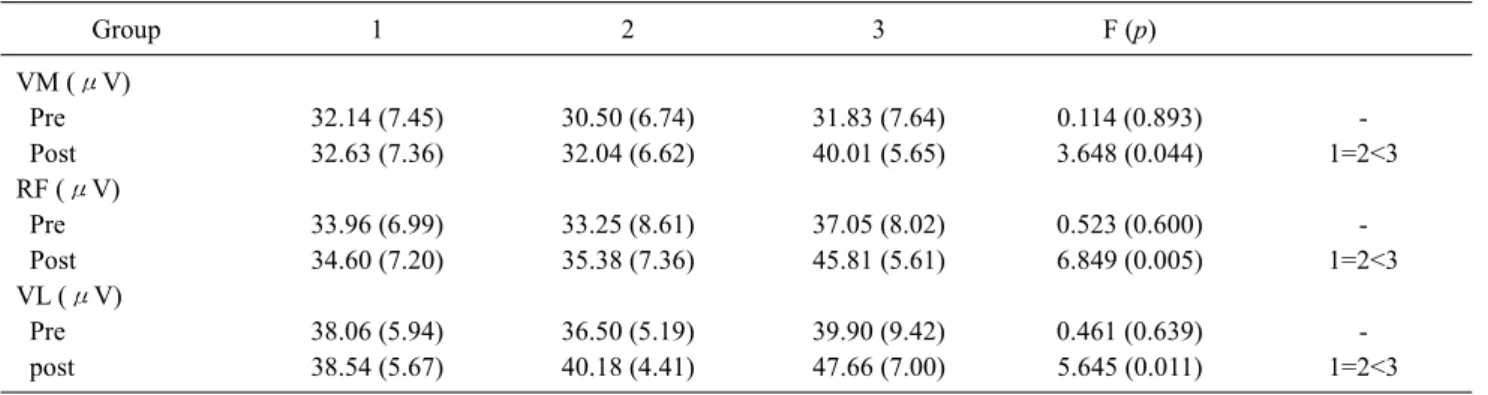
Table 3. Differences in pre- and post- mean quadriceps activity between groups (N=24)
Group 1 2 3 F (p)
VM (μV)
Pre 32.14 (7.45) 30.50 (6.74) 31.83 (7.64) 0.114 (0.893) -
Post 32.63 (7.36) 32.04 (6.62) 40.01 (5.65) 3.648 (0.044) 1=2<3
RF (μV)
Pre 33.96 (6.99) 33.25 (8.61) 37.05 (8.02) 0.523 (0.600) -
Post 34.60 (7.20) 35.38 (7.36) 45.81 (5.61) 6.849 (0.005) 1=2<3
VL (μV)
Pre 38.06 (5.94) 36.50 (5.19) 39.90 (9.42) 0.461 (0.639) -
post 38.54 (5.67) 40.18 (4.41) 47.66 (7.00) 5.645 (0.011) 1=2<3
Values are presented as mean (SD).
VM: vastus medialis, RF: rectus femoris, VL: vastus lateralis.
Table 2. Differences in pre- and post- quadriceps thickness between groups (N=24)
Group 1 2 3 F (p)
Pre (mm) 32.59 (2.30) 32.78 (2.83) 34.94 (3.04) 1.808 (0.189) -
Post (mm) 32.65 (2.18) 34.85 (3.12) 37.78 (3.10) 6.597 (0.006) 1<2<3
Values are presented as mean (SD).
quadriceps was 32.59 (2.30) mm in the pre-condition and 32.65 (2.18) mm in the post-condition. In the ultrasound imaging group (group 2), the thickness of the quadriceps was 32.78 (2.83) mm in the pre-condition and 34.85 (3.12) mm in the post-condition. In the graph group (group 3), the thickness of the quadriceps was 34.94 (3.04) mm in the pre-condition and 37.78 (3.10) mm in post-condition.
Differences in pre- and post mean quadriceps activity between groups
The differences in the mean quadriceps activity between groups in the pre and post conditions are shown in Table 3.
32.63 (7.36) V in the post-condition. The mean activity of the rectus femoris was 33.96 (6.99) V in the pre-condition and 34.60 (7.20) V in the post-condition. The mean activity of the vastus lateralis was 38.06 (5.94) V in the pre-condition and 38.54 (5.67) V in the post-condition. In the ultrasound imaging group (group 2), The mean activity of the vastus medialis was 30.50 (6.74) V in the pre-condition and 32.04 (6.62) V in the post-condition. The mean activity of the rec- tus femoris was 33.25 (8.61) V in the pre-condition and 35.38 (7.36) V in the post-condition. The mean activity of the vastus lateralis was 36.50 (5.19) V in the pre-condition and 40.18 (4.41) V in the post-condition. In the graph group (group 3), the mean activity of the vastus medialis was 31.83 (7.64) V in the pre-condition and 40.01 (5.65) V in the post-condition. The mean activity of the rectus femoris was 37.05 (8.02) V in the pre-condition and 45.81 (5.61) V in the post-condition. The mean activity of the vastus lateralis was 39.90 (9.42) V in the pre-condition and 47.66 (7.00) V in the post-condition.
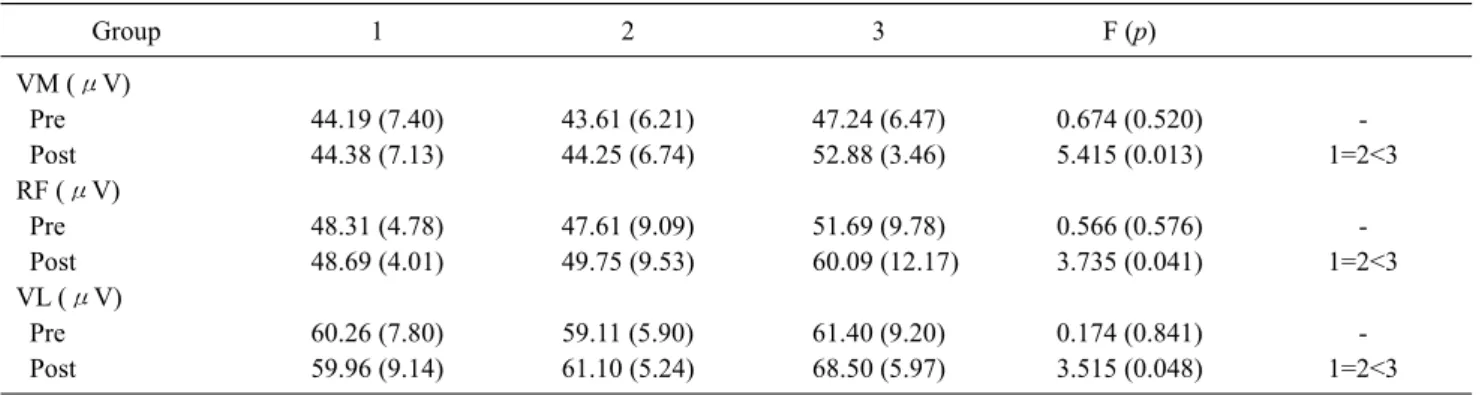
Differences in pre- and post peak quadriceps activity be- tween groups
The differences in the peak quadriceps activity between
Table 4. Differences in pre- and post- peak quadriceps activity between groups (N=24)
Group 1 2 3 F (p)
VM (μV)
Pre 44.19 (7.40) 43.61 (6.21) 47.24 (6.47) 0.674 (0.520) -
Post 44.38 (7.13) 44.25 (6.74) 52.88 (3.46) 5.415 (0.013) 1=2<3
RF (μV)
Pre 48.31 (4.78) 47.61 (9.09) 51.69 (9.78) 0.566 (0.576) -
Post 48.69 (4.01) 49.75 (9.53) 60.09 (12.17) 3.735 (0.041) 1=2<3
VL (μV)
Pre 60.26 (7.80) 59.11 (5.90) 61.40 (9.20) 0.174 (0.841) -
Post 59.96 (9.14) 61.10 (5.24) 68.50 (5.97) 3.515 (0.048) 1=2<3
Values are presented as mean (SD).
VM: vastus medialis, RF: rectus femoris, VL: vastus lateralis.
Table 5. Differences in pre- and post- MyotonPRO values between groups (N=24)
Group 1 2 3 F (p)
MT (Hz)
Pre 17.14 (2.78) 13.79 (2.66) 14.75 (1.90) 3.885 (0.037) 2<3<1
Post 17.44 (2.34) 14.29 (3.23) 14.46 (1.98) 3.790 (0.039) 2=3<1
MS (N/m)
Pre 312.88 (69.65) 215.13 (68.55) 251.00 (51.08) 4.826 (0.019) 2<3<1
Post 331.63 (68.44) 242.00 (109.58) 215.13 (96.36) 3.438 (0.051)
LD
Pre 1.30 (0.16) 1.13 (0.15) 1.25 (0.16) 2.595 (0.098)
Post 1.26 (0.12) 1.10 (0.11) 1.19 (0.14) 3.366 (0.054)
R (ms)
Pre 17.50 (4.72) 23.58 (7.46) 21.10 (4.24) 2.334 (0.122)
Post 16.31 (4.02) 22.23 (7.36) 19.81 (8.50) 1.487 (0.249)
C
Pre 1.08 (0.29) 1.38 (0.47) 1.29 (0.26) 1.486 (0.249)
Post 1.01 (0.25) 1.31 (0.44) 1.33 (0.26) 2.440 (0.111)
Values are presented as mean (SD).
MT: muscle tone, MS: muscle stiffness, LD: logarithmic decrement, R: relaxation, C: creep.
groups in the pre and post conditions are shown in Table 4.
In the oral training group (group 1), the peak activity of the vastus medialis was 44.19 (7.40) V in the pre-condition and 44.38 (7.13) V in the post-condition. The peak activity of the rectus femoris was 48.31 (4.78) V in the pre-condition and 48.69 (4.01) V in the post-condition. The peak activity of the vastus lateralis was 60.26 (7.80) V in the pre-condition and 59.96 (9.14) V in the post-condition. For the ultrasound- imaging group (group 2), the peak activity of the vastus me- dialis was 43.61 (6.21) V in the pre-condition and 44.25 (6.74) V in the post-condition. The peak activity of the rectus femoris was 47.61(9.09) V in the pre-condition and 49.75 (9.53) V in the post-condition. The peak activity of the vastus lateralis was 59.11 (5.90) V in the pre-condition and
61.10 (5.24) V in the post-condition. In the graph group (group 3), the peak activity of the vastus medialis was 47.24 (6.47) V in the pre-condition and 52.88 (3.46) V in the post-condition. The peak activity of the rectus femoris was 51.69 (9.78) V in the pre-condition and 60.09 (12.17) V in the post-condition. The peak activity of the vastus lateralis was 61.40 (9.20) V in the pre-condition and 68.50 (5.97) V in the post-condition.
Differences in pre- and post MyotonPRO values be- tween groups
The differences in the MyotonPRO values between groups in the pre and post conditions are shown in Table 5.
Only muscle tone showed a statistically significant differ-
laxation, and creep) did not show statistically significant dif- ferences between groups.
Discussion
The muscle is a crucial structure in the human body be- cause it is used in all movements, from simple to detailed movements such as standing, sitting, and walking. Previous studies have shown that muscle thickness is proportional to muscle power [16]. However, as the age increases, the mus- cle volume decreases, leading to muscle weakening. This loss of muscle mass and strength is called sarcopenia, which is classified as a disease [2]. Sarcopenia increases the rates of disability, poor mobility, weakness, and hospitalization [17,18]. Therefore, as the elderly population is becoming large worldwide, sarcopenia is now a common disease and causes difficulty in daily movements. Sarcopenia incurred an additional >$18 billion in health-care costs in 2001 in the United States [19]. Elderly persons with sarcopenia have a higher risk of falling and lower physical performance than those without sarcopenia [20]. To address this problem, many studies on rehabilitation have been conducted [21]. A previous study showed that for selective muscle training, training with visual feedback using ultrasound imaging is more effective method than conventional methods in re- habilitation [6]. Another study showed that visual feedback training with ultrasound is more effective than without visu- al feedback using ultrasound [22]. However, most studies on rehabilitative ultrasound visual feedback have been related to speech training [22,23].
In the present study, we investigated whether using the RUSI 1.0 software with a hands-free fixed probe is more ef- fective than the conventional method for rehabilitation of the quadriceps muscles in the elderly. In training using this software, the participants performed isometric contraction of their quadriceps muscle because it is dangerous for the elderly to lift an external weight by flexing their knee.
Although external weight is absent in isometric contraction, it is effective in preventing muscle loss. Eccentric con- traction prevents and reduces sarcopenia, decreases the risk of falls, improves mobility and independence, provides rap- id gains in muscle strength and muscle mass, improves ath- letic performance (speed, jumping, change of direction), shifts the muscle length-tension relationship toward a longer muscle length, increases insulin sensitivity, improves the
[24].
In this study, we confirmed the effectiveness of the newly developed ultrasound-based software (RUSI 1.0) for in- creasing quadriceps muscle thickness in the elderly. The bar graph group, which used the RUSI 1.0 software, showed the highest quadriceps thickness and activity among the three groups, with significant differences (p<0.05). However, the variables that were measured using MyotonPRO (muscle tone, muscle stiffness, logarithmic decrement, relaxation, and creep) did not show significant differences between groups. This is because of the cross-sectional design of this study. Muscle stiffness and tone are affected when the inter- vention on the muscle is not applied for only a short time as in a previous study [25]. In addition, muscle stiffness and tone usually have a considerable influence on the re- habilitative prognosis of patients with neurologic diseases such as stroke, spinal cord injury, and Parkinson’s disease [26]. Moreover, this study showed that muscle activity is proportional to muscle thickness, as another study has re- ported [27].
The results of the present study showed that RUSI 1.0 was the most effective tool, followed by visual feedback from conventional ultrasound imaging, and oral training was the least effective in two aspects: muscle thickness and muscle activity. We assumed that the participants’ motivation dur- ing rehabilitation is the main reason for this result.
Compared with the previous studies on the effect of ultra- sound visual feedback training, the results of this study showed well that real-time visual feedback using ultrasound bar graph training is the most effective method for increas- ing muscle thickness compared to oral training and conven- tional ultrasound visual feedback training at the same time.
Another study showed that elderly people rely more on visu- al feedback than young people [28]. This suggests that RUSI 1.0 can be a useful training tool in demand. Previous studies have verified the reliability and validity of PC-BMW [10,11] and the hands-free fixed probe [12]. Thus, the pres- ent study suggested that the newly developed software RUSI 1.0 mounted on PC-BMW with a hands-free fixed probe is effective for training the quadriceps muscle in the elderly (Figure 3).
Our study had the limitation of a small sample size. Thus, our participants could not represent the entire elderly pop- ulation worldwide. In addition, with respect to the EMG electrode attachment site, because the ultrasound device and
Figure 3. Differences of thickness and activity mean of quadriceps between groups. VM: vastus medialis, VL: vas- tus lateralis, RF: rectus femoris.
MyotonPRO were used at the same time, the SENIAM (Surface electromyography for the non-invasive assessment of muscles) guidelines were not completely followed, and the adjacent site was selected [29].
Acknowledgements
This work was supported by a National Research Foundation grant funded by the Korean government (no. NRF-2018R1D1 A1B0704287013).
Conflicts of Interest
The authors declare no potential conflicts of interest with respect to the authorship and/or publication of this article.
References
1. Division of Nutrition, Physical Activity, and Obesity, National Center for Chronic Disease Prevention and Health Promotion.
Data, trends and maps [Internet]. Atlanta (GA): Centers for Disease Control and Prevention (CDC), 2015 [cited 연도 Mon date]. Available from: https://nccd.cdc.gov/dnpao_dtm/rdPag- e.aspx?rdReport=DNPAO_DTM.ExploreByTopic&islClass=
PA&islTopic=PA1&go=GO.
2. Zampieri S, Mosole S, Löfler S, Fruhmann H, Burggraf S, Cvečka J, et al. Physical exercise in aging: nine weeks of leg press or electrical stimulation training in 70 years old sedentary elderly people. Eur J Transl Myol 2015;25:237-42.
3. Hamed A, Bohm S, Mersmann F, Arampatzis A. Exercises of dy- namic stability under unstable conditions increase muscle
strength and balance ability in the elderly. Scand J Med Sci Sports 2018;28:961-71.
4. Langeard A, Bigot L, Chastan N, Gauthier A. Does neuro- muscular electrical stimulation training of the lower limb have functional effects on the elderly?: a systematic review. Exp Gerontol 2017;91:88-98.
5. Storberget M, Grødahl LHJ, Snodgrass S, van Vliet P, Heneghan N. Verbal augmented feedback in the rehabilitation of lower ex- tremity musculoskeletal dysfunctions: a systematic review. BMJ Open Sport Exerc Med 2017;3:e000256.
6. Lee DH, Hong SK, Lee YS, Kim CH, Hwang JM, Lee Z, et al. Is abdominal hollowing exercise using real-time ultrasound imag- ing feedback helpful for selective strengthening of the trans- versus abdominis muscle?: a prospective, randomized, parallel- group, comparative study. Medicine (Baltimore) 2018;97:e11369.
7. Jang MH, Ahn SJ, Lee JW, Rhee MH, Chae D, Kim J, et al.
Validity and reliability of the newly developed surface electro- myography device for measuring muscle activity during volun- tary isometric contraction. Comput Math Methods Med 2018;
2018:4068493.
8. Sanada K, Kearns CF, Midorikawa T, Abe T. Prediction and vali- dation of total and regional skeletal muscle mass by ultrasound in Japanese adults. Eur J Appl Physiol 2006;96:24-31.
9. Danish M, Agarwal A, Goyal P, Gupta D, Lal H, Prasad R, et al.
Diagnostic performance of 6-point lung ultrasound in ICU pa- tients: a comparison with chest x-ray and CT thorax. Turk J Anaesthesiol Reanim 2019;47:307-19.
10. Cho JE, Cho KH, Yoo JS, Lee SJ, Lee WH. Reliability and val- idity of a dual-probe personal computer-based muscle viewer for measuring the pennation angle of the medial gastrocnemius mus- cle in patients who have had a stroke. Top Stroke Rehabil 2018;
25:6-12.
11. Jeong JR, Han JH, Cho JE, Lee W. Reliability and validity of a personal computer based muscle viewer for measuring upper tra- pezius and transverses abdominis muscle thickness. Phys Ther
fixed probe in measuring the muscle structures of the tibialis an- terior and the gastrocnemius. Phys Ther Rehabil Sci 2019;8:
194-201.
13. Monajati A, Larumbe-Zabala E, Goss-Sampson M, Naclerio F.
Surface electromyography analysis of three squat exercises. J Hum Kinet 2019;67:73-83.
14. Pruyn EC, Watsford ML, Murphy AJ. Validity and reliability of three methods of stiffness assessment. J Sport Health Sci 2016;5:
476-83.
15. Wada M, Fujii T, Inagaki Y, Nagano T, Tanaka Y. Isometric con- traction of the quadriceps improves the accuracy of intra-articu- lar injections into the knee joint via the superolateral approach.
JB JS Open Access 2018;3:e0003.
16. Lee HJ, Lee KW, Lee YW, Kim HJ. Correlation between cycling power and muscle thickness in cyclists. Clin Anat 2018;31:
899-906.
17. Hairi NN, Cumming RG, Naganathan V, Handelsman DJ, Le Couteur DG, Creasey H, et al. Loss of muscle strength, mass (sar- copenia), and quality (specific force) and its relationship with functional limitation and physical disability: the Concord Health and Ageing in Men Project. J Am Geriatr Soc 2010;58:2055-62.
18. Janssen I, Heymsfield SB, Ross R. Low relative skeletal muscle mass (sarcopenia) in older persons is associated with functional impairment and physical disability. J Am Geriatr Soc 2002;50:
889-96.
19. Janssen I, Shepard DS, Katzmarzyk PT, Roubenoff R. The healthcare costs of sarcopenia in the United States. J Am Geriatr Soc 2004;52:80-5.
20. Landi F, Liperoti R, Russo A, Giovannini S, Tosato M, Capoluongo E, et al. Sarcopenia as a risk factor for falls in elderly individuals: results from the ilSIRENTE study. Clin Nutr 2012;
Care 2014;17:25-31.
22. Sjolie GM, Leece MC, Preston JL. Acquisition, retention, and generalization of rhotics with and without ultrasound visual feedback. J Commun Disord 2016;64:62-77.
23. Preston JL, Leece MC, McNamara K, Maas E. Variable practice to enhance speech learning in ultrasound biofeedback treatment for childhood apraxia of speech: a single case experimental study. Am J Speech Lang Pathol 2017;26:840-52.
24. Hody S, Croisier JL, Bury T, Rogister B, Leprince P. Eccentric muscle contractions: risks and benefits. Front Physiol 2019;10:
536.
25. Kong PW, Chua YH, Kawabata M, Burns SF, Cai C. Effect of post-exercise massage on passive muscle stiffness measured us- ing myotonometry - a double-blind study. J Sports Sci Med 2018;
17:599-606.
26. Persson CU, Holmegaard L, Redfors P, Jern C, Blomstrand C, Jood K. Increased muscle tone and contracture late after ische- mic stroke. Brain Behav 2020;10:e01509.
27. Kant P, Bhowate RR, Sharda N. Assessment of cross-sectional thickness and activity of masseter, anterior temporalis and orbi- cularis oris muscles in oral submucous fibrosis patients and healthy controls: an ultrasonography and electromyography study. Dentomaxillofac Radiol 2014;43:20130016.
28. Coats RO, Wann JP. The reliance on visual feedback control by older adults is highlighted in tasks requiring precise endpoint placement and precision grip. Exp Brain Res 2011;214:139-50.
29. Sacco IC, Gomes AA, Otuzi ME, Pripas D, Onodera AN. A method for better positioning bipolar electrodes for lower limb EMG recordings during dynamic contractions. J Neurosci Methods 2009;180:133-7.