The Empirical Study of Relationship between the obsolescence assets and Asymmetric Cost Behavior
Sang-kwon Cha
1, Dong-Pil Kim
2*1
Ph.D Course, The Department of Accounting, Hanyang University
2
Professor, The Department of Tax-Accounting, Jangan University
자산 노후화율이 원가의 비대칭성에 미치는 영향
차상권
1, 김동필
2*1
한양대학교 대학원 회계학과 박사과정,
2장안대학교 유통물류학부 세무회계과 교수
Abstract This study analyzes the effects of the obsolescence assets on the asymmetry of costs. Cost asymmetry refers to a lower percentage of costs when sales fall than increases in costs when sales increase. the obsolescence asset induces various decisions, including high maintenance costs and management improvements and replacement of facilities. This study is to analyze the cost behavior according to those decisions. The analysis showed that the higher the obsolescence of assets rate, we found cost elasticity, with a greater reduction in costs when sales decrease than the increase in costs when sales increase. Second, the lower the cost will not appear as the obsolescence of assets rate increases in case that the concentration of an item of property, plant and equipment is high, and when sales decrease. The above result means that the obsolescence of assets rate acts as operating risk and thus operates resources flexibly according to changes in sales, but when the concentration of property, plant and equipment is high, the decision-making constraint make it difficult for the flexible operation.
Key Words : The obsolescence of assets, Cost stickiness, Cost behavior, Asymmetric cost behavior, Tangible asset
요 약 본 연구는 기업의 자산 노후화가 원가의 비대칭성에 미치는 영향을 분석하였다. 원가의 비대칭성이란 매출액이 증가할 때 원가의 증가율보다 매출액이 하락할 때 원가의 감소율이 더 낮은 것을 가리킨다. 선행연구에서는 경영자의 설비용량 조정이나 유형자산의 비중이 높을수록 원가의 비대칭성이 보다 강하게 나타난다는 결과를 제시하였으나 주로 경영자의 재량적 의사결정에 산물로써 진행되었다. 그러나 원가의 비대칭성은 설비자산의 규모와 비중, 자산의 노후화 율 등과 같은 구조적인 문제에 기인한 현상이 존재할 것으로 예상되어 가설을 검증하였다. 실증분석결과는 다음과 같 다. 첫째, 자산의 노후화가 높을수록 총원가, 판매비와관리비의 하방탄력성이 나타났다. 둘째, 유형자산의 비중이 높은 경우 설비자산의 노후화가 높을수록 매출원가의 하방경직성이 나타났다. 이상의 결과는 선행연구가 주로 경영자의 의 사결정, 설비용량의 조정, 무형자산의 비중에 관해 다루었다면 본 연구는 설비자산의 노후화와 설비자산의 집중도를 고려하여 분석함으로써 선행연구를 확장하였다.
주제어 : 원가의 비대칭성, 원가의 하방경직성, 원가의 하방탄력성, 자산 노후화, 유형자산
*Corresponding Author : Dong-Pil Kim([email protected]) Received October 28, 2019
Accepted January 20, 2020 Revised December 17, 2019
Published January 28, 2020
1. Introduction
Property, plant and equipment is held by the entity for operating activities and plays a key role in generating cash flows. The greater the obsolescence of assets rate (the accumulated depreciation relative to the tangible asset) the more time is available for the replacement of the property, plant and equipment and thus the performance may be affected. Accumulated depreciation is the cumulative value of an entity's depreciation, meaning that the greater the accumulated amount, the greater the depreciation, the less residual value of an item of property, plant and equipment remains.
Accumulated depreciation is not significantly affected by changes in sales, and therefore can be considered to be immaterial to the However, this is judged to be a empirical problem. This is because empirical results in the domestic capital markets did not produce a primary consensus on whether cost asymmetry was rigid or resilient, and second, it was difficult to predict in advance what would happen if the obsolescence of assets rate was considered.
To this end, the present study conducted an analysis on listed companies in the KOSPI market and the KOSDAQ market from 2009 to 2018. The analysis showed a larger reduction in cost when sales declined as the obsolescence of assets. The higher the obsolescence of assets rate, the greater the firm's management risk, can be interpreted as a greater reduction in costs as a decision to enhance stability. However, if the concentration of an item of property, plant and equipment is high, the higher the obsolescence of assets rate, the lower the cost is. This can be interpreted as a result of the high concentration of items of property, plant and equipment, which is highly constrained in making flexible decisions, and therefore does not significantly reduce costs when sales are reduced.
This study is an empirical analysis of the
effects of obsolescence of property, plant and equipment on cost behavior, and has different contributions from those of the effect of earnings management and corporate governance on cost behavior in previous research.
Meanwhile, this study raised prior research and empirical problems in Chapter 2, and described the research methodology in Chapter 3, and the empirical analysis results in Chapter 4.
Finally, Chapter 5 describes conclusions and limitations.
2. Literature Review and Hypothesis
Following the Anderson et al.(2003) study, numerous studies were conducted on which factors caused cost asymmetry[1]. Calleja et al.(2006) argued that cost asymmetry is not a phenomenon that occurs only in certain industries or countries[2]. Empirical results showed common phenomena occurring in various countries. And they argued that It has resulted in stronger or weaker phenomena depending on cultural differences.
Studies have been actively conducted on the effects of variables on cost asymmetry on management's decision making. Prior studies showed that the manager's overconfidence, the existence of manager’s forecasting, and size of the board of directors, relation to asymmetric cost behavior[3-6]. On the other hand, there are consequences that the rigidity of costs is diminished when managers trying to avoids losses, when managers doing earnings management, or complying with the financial analyst's earnings forecast[7-9]. The premise of the mentioned studies is that cost asymmetry is a phenomenon resulting from management's decision-making[10].
There are studies exist on the effects of the
business environment facing the entity on cost
asymmetry. Xue & Hong(2016) presented the
result that the greater the uncertainty in demand, the greater the asymmetry in costs[11], and Lung et al.(2016) argued that the greater the industrial competition, the greater the asymmetry in costs[12]. In addition, Zhang et al.(2019) pointed out the problem of over asset possession in the tourism industry in the U.S., suggesting that the proportion of assets involving fixed expenditure should be reduced to increase financial performance[13].
Holzhacker et al.(2015) raised the risk of the entity's management environment as a cause of asymmetry in costs[14]. The study used Altman's z-score to argue that the asymmetry of costs increases as operating risk increases. In particular, the study argued that greater operating risk increases the downward elasticity of the cost. It indicates that when sales fall, the cost decrease is greater.
A similar study was conducted on the Korean capital market. Jung(2007) extended the study by Anderson et al.(2003) to confirm the downward rigidity of the cost[1,15], and Koo(2011) argued the association between earnings management adjusted inducement and cost asymmetry[7].
There is also an analysis using the financial ratio.
Lower cost is shown to be resilient when debt ratios are high and growth is low[16]. Jang et al.(2015) suggested that the higher the concentration of intangible assets, when sales reduction as a positive outlook for future demand, thereby increasing the downward rigidity of costs[17].
While the previous study mainly dealt with managerial decision-making, adjustment of equipment capacity, and the proportion of intangible assets, this study try to expand the previous researches by analyzing the obsolescence of assets and the concentration of tangible assets.
H1. : The higher the obsolescence of assets rate, the more asymmetric the cost.
H2. : As the concentration of tangible assets is high, the downward stickiness of cost will appear as the obsolescence of assets increases.
3. Methodology 3.1 Research Model
The research model used to verify the hypothesis 1. is based on the model of [1]. The objective of this study is to confirm whether the asset aging rate had an effect on the asymmetry of costs even after controlling certain variables.
In the case of
, it refers to the amount of change in cost as sales increase and in the case of the
, the amount of change in cost as sales decrease. Thus, if
shows negative value, it is interpreted as cost downward stickiness, and if it has positive value, it is interpreted as downward elasticity. The interest variable in this study is
which is the obsolescence of assets(AGED) interaction with the
. If
shows a significant negative value, the higher the asset aging rate, the lower the cost is considered rigid and the lower the positive value is considered resilient. In the regression analysis, two way(firm-year) clustering was performed.
The research model of the second hypothesis
is similar to the first model, but takes account of
asset concentration. An indicator variable of 1 is
defined as HIGH if asset concentration is greater
than the median by industry-year, and 0
otherwise. If
has a significant positive value,
the cost can be interpreted as downwardly
elastic, and if it has a negative value, it can be
interpreted as downwardly rigid.
log△
log△
log△
×
log△
× ×
log△
× ×
log△
× ×
log△
× ×
log△
×
log△
log△
log△
×
log△
× × ×
log△
× ×
log△
× ×
log△
× ×
log△
× ×
log△
×
variable operational definition ln △ : natural log of sales growth ln △ : natural log of cost growth
HIGH : 1 is for the greater than median value of tangible assets ratio by industry-year and others is 0.
AGED : depreciation divided by the sum of PP&E and depreciation
ASSINS : percentage of property, plant and equipment to total assets
FORE : foreign investor's equity ratio
EMP : number of employees to amount of sales DEC : Indicator variables for decrease in sales
3.2 Variable Definition
In the research model, COST was calculated as the sum of the cost of good and the cost of sales and general administration. SALES refers to sales revenue, and DEC is a indicator variable of 1 or 0 when the previous sales are greater than current sales. the obsolescence of assets rate is depreciation divided by the sum of property, plant and equipment and depreciation. the higher the ratio, the greater the obsolescence of the property, plant and equipment. The concentration of property, plant and equipment is the proportion of property, plant and equipment relative to the total of the assets, and the higher the proportion of the item, the greater
the asymmetry in costs. FORE was included as a control variable. According to prior study, the higher the foreign investor's equity ratio with the foreign investor's common share price, the lower the cost asymmetry. EMP is the ratio of employees to sales revenues. However, this is a very low percentage, we multiplied 1,000 by the number of employees. and we divided 10,000 by the sales.
3.3 Data Collection
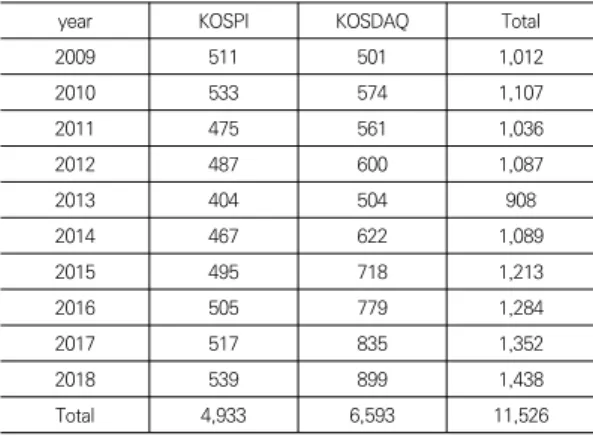
This study set an 11-year verification period from 2009 to 2018 and utilized 12 years of data from 2008 to 2018. There is a difference between the sample period and the analyzing period due to making lagged variable. The financial data were extracted from KISVALUE, the financial data base for NICE Information Service. We excluded the samples if the fiscal month is not December, if it belongs to the financial industry, or if it is impairment of capital, if data cannot be extracted from the KISVALUE. Evenly distributed by year, it was judged that the results of this study did not show distortion due to a specific year as Table 1. The distribution by industry is classified according to the Korean standard industry classification as Table 2. It was confirmed that the proportion of the manufacturing industry was large.
year KOSPI KOSDAQ Total
2009 511 501 1,012
2010 533 574 1,107
2011 475 561 1,036
2012 487 600 1,087
2013 404 504 908
2014 467 622 1,089
2015 495 718 1,213
2016 505 779 1,284
2017 517 835 1,352
2018 539 899 1,438
Total 4,933 6,593 11,526
Table 1. Samples distribution by year
Industry Freq.
Agriculture, forestry and fishing 47
Mining and quarrying 13
Manufacturing 7,859
Electricity, gas, steam and air conditioning supply 80 Water supply; sewage, waste management, materials
recovery 48
Construction 395
Wholesale and retail trade 1,002
Transportation and storage 195
Accommodation and food service activities 15
Information and communication 1,067
Real estate activities 27
Professional, scientific and technical activities 548 Business facilities management and business support
services 92
Education 55
Arts, sports and recreation related services 80 Membership organizations, repair and other personal
services 3
Total 11,526
Table 2. Samples distribution by industry
4. Results 4.1 Descriptive Statistics
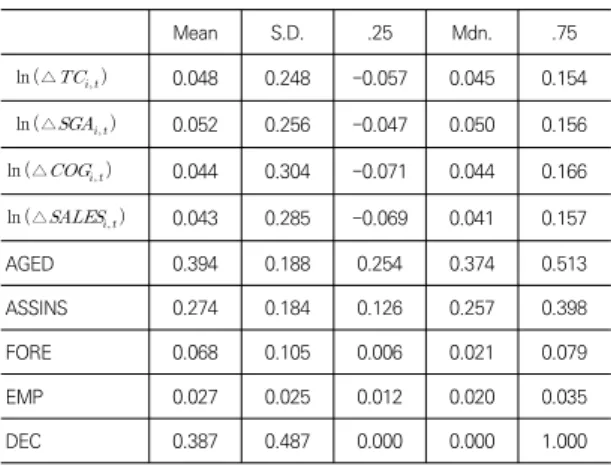
Descriptive statistics of the main variables used in this study are presented in Table 3. There are three main types of cost analysis in this study. First, ln△
is the natural logarithm of the change in total cost, which is the sum of the selling, general expense and cost of sales.
The mean of ln△
was 0.048 while the standard deviation was very large at 0.248, indicating that the change in total cost between firms was very large. ln△
is natural logarithms value of change sales management costs, with an average of 0.052 and a standard deviation of 0.256. ln△
is the value of natural logarithms to changes in the cost of sales, with an average of 0.044 and a standard deviation of 0.304. The findings showed a similar distribution as in a preceding study of the Korean capital market.
Looking at DEC result, 38.7 percent of the total sample is larger than current-year sales.
The asset aging rate showed 39.4 percent, with the concentration of property, plant and equipment showed 27.4 percent. Foreign investors' equity ratio averaged 6.8 percent, the report showed. These findings are generally similar to those researches on cost asymmetry in the Korean capital market.
Mean S.D. .25 Mdn. .75
ln△ 0.048 0.248 -0.057 0.045 0.154 ln△ 0.052 0.256 -0.047 0.050 0.156 ln △ 0.044 0.304 -0.071 0.044 0.166 ln △ 0.043 0.285 -0.069 0.041 0.157
AGED 0.394 0.188 0.254 0.374 0.513
ASSINS 0.274 0.184 0.126 0.257 0.398
FORE 0.068 0.105 0.006 0.021 0.079
EMP 0.027 0.025 0.012 0.020 0.035
DEC 0.387 0.487 0.000 0.000 1.000
ln △ : natural log value of total cost in the current term divided by total cost in the previous term, ln △ : natural log value of sales administration and general cost in the current term divided by sales administration and general cost in the previous term, ln △ : natural log value of cost of sales in the current term divided by cost of sales in the previous term,
log△
: natural log value of change in sales, AGED : depreciation divided by the sum of PP&E and depreciation, ASSINS : percentage of property, plant and equipment to total assets, FORE : foreign investor's equity ratio, EMP : number of employees to amount of sales, DEC : Indicator variables for decrease in salesTable 3. Descriptive Statistics
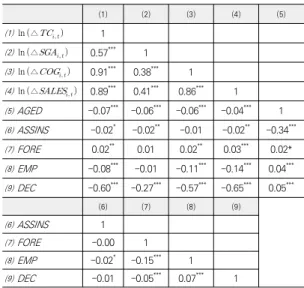
4.2 Correlation
In this section, Pearson correlation analysis of
major variables was conducted as Table 4. First,
looking at ln△
and the rate of change in
sales(log△
) results in a significant
amount of value at the 1% level. This was very
high because of the correlation between changes
in sales and changes in costs. At the 1% level,
there was a significant negative relationship
between ln△
and AGED. This means that
the higher the asset aging rate, the lower the
cost. Since these results represent simple
correlations, it will be necessary to look at the regression analysis to see if the same results can be inferred even after controlling a given variable.
⑴ ⑵ ⑶ ⑷ ⑸
⑴ ln△ 1
⑵ ln△ 0.57*** 1
⑶ ln△ 0.91*** 0.38*** 1
⑷ ln△ 0.89*** 0.41*** 0.86*** 1
⑸ AGED -0.07*** -0.06*** -0.06*** -0.04*** 1
⑹ ASSINS -0.02* -0.02** -0.01 -0.02** -0.34***
⑺ FORE 0.02** 0.01 0.02** 0.03*** 0.02*
⑻ EMP -0.08*** -0.01 -0.11*** -0.14*** 0.04***
⑼ DEC -0.60*** -0.27*** -0.57*** -0.65*** 0.05***
⑹ ⑺ ⑻ ⑼
⑹ ASSINS 1
⑺ FORE -0.00 1
⑻ EMP -0.02* -0.15*** 1
⑼ DEC -0.01 -0.05*** 0.07*** 1
The definition of a variable is as shown in Table 3.
*,**,*** indicates significant levels of 10%, 5%, and 1% respectively.
Table 4. Correlation
4.3 Regression
This section presents the hypothesis verification results as Table 5. The analysis results are attributable to differences in dependent variables. That is, Model 1 is the total cost of the dependency, Model 2 is the cost of selling and managing the dependency, and Model 3 is the cost of sales.
As a result of the empirical analysis, the results of the interest variable(
) showed a significant amount of results at the 5% level when the dependent variable is based on total cost and on sales management costs. This indicated cost elasticity, with a greater reduction in costs when sales decrease than the increase in costs when sales increase.
Such a result is not differ from preceding study, in which a manager drastically reduces idle resources and adjusts the management structure, to a greater extent of reduction in
costs. The study by Jang & Paik(2009) suggests that the greater the operating risk of an entity, cost elasticity showed[10].
log△
log△
log△
×
log△
× ×
log△
× ×
log△
× ×
log△
× ×
log△
×
(1) (2) (3)
Total cost SGA COG
0.03***(8.05) 0.04***
(4.95) 0.02***
(4.21)
0.79***(15.66) 0.43***
(8.97) 0.90***
(12.59)
0.00(0.04) -0.22***
(-2.95) 0.04
(0.67)
0.23**(1.99) 0.20**
(2.10) 0.12
(0.70)
0.42***(3.09) 0.52***
(4.74) 0.12
(0.81)
0.22(1.32) 1.75***
(6.03) 0.46
(1.29)
-5.30(-3.66)*** -3.33(-2.59)*** (-0.80)-1.13
(-0.57)-0.07 (0.12)0.02 (-0.47)-0.07
-0.03(-2.56)** -0.07(-4.84)*** (-1.39)-0.02
(0.79)0.01 -0.00(0.27) (0.90)0.01
(0.51)0.00 0.09(4.47)*** (0.54)0.01
(-0.24)-0.04 (0.83)0.14 (0.49)0.07
-0.01(-3.64)*** 0.02(3.08)*** (-0.08)-0.00Firm-Year
clustered yes yes yes
N 11,526 11,526 11,526
R-sq 0.803 0.186 0.746
The definition of a variable is as shown in Table 3.
*,**,*** indicates significant levels of 10%, 5%, and 1% respectively.
Table 5. Regression for Hypothesis 1
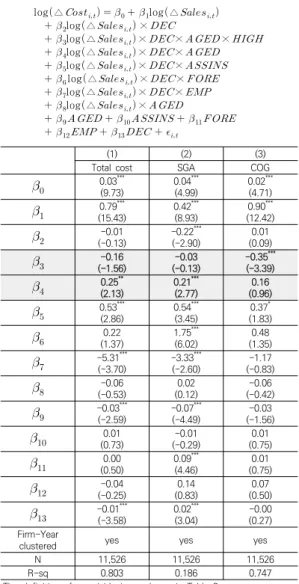
This section further validated the effects of higher concentrations of property, plant and equipment on the asymmetry of costs as the asset aging rate increases as Table 6.
The empirical analysis results in a significant
negative value for
if the dependent variable is
the cost of sales. This means that the lower the
cost will not appear as the obsolescence of assets rate increases in case that the concentration of an item of property, plant and equipment is high, and when sales decrease. In other words, on the condition that the concentration of property, plant and equipment is high, it is difficult to make flexible decisions about idle resources, resulting in cost stickiness.
log△
log△
log△
×
log△
× × ×
log△
× ×
log△
× ×
log△
× ×
log△
× ×
log△
×
(1) (2) (3)
Total cost SGA COG
0.03(9.73)*** 0.04(4.99)*** 0.02(4.71)***
0.79***(15.43) 0.42***
(8.93) 0.90***
(12.42)
-0.01(-0.13) -0.22***
(-2.90) 0.01
(0.09)
(-1.56)-0.16 (-0.13)-0.03 -0.35(-3.39)***
0.25(2.13)** 0.21(2.77)*** (0.96)0.16
0.53***(2.86) 0.54***
(3.45) 0.37*
(1.83)
0.22(1.37) 1.75***
(6.02) 0.48
(1.35)
-5.31(-3.70)*** -3.33(-2.60)*** (-0.83)-1.17
-0.06(-0.53) 0.02
(0.12) -0.06
(-0.42)
-0.03***(-2.59) -0.07***
(-4.49) -0.03
(-1.56)
(0.73)0.01 (-0.29)-0.01 (0.75)0.01
(0.50)0.00 0.09(4.46)*** (0.75)0.01
-0.04(-0.25) 0.14
(0.83) 0.07
(0.50)
-0.01***(-3.58) 0.02***
(3.04) -0.00
(0.27) Firm-Year
clustered yes yes yes
N 11,526 11,526 11,526
R-sq 0.803 0.186 0.747
The definition of a variable is as shown in Table 3.
*,**,*** indicates significant levels of 10%, 5%, and 1% respectively.