1. Introduction
1)Cultivation of strawberries begins with the development of seedlings. Strawberries disperse nutrition and breed through the plant’s runners, and the timing and methods used to raise seedlings may vary; thus, it is difficult to obtain optimal daughter plants with a high degree of uniformity (Kim et al., 1999). The lack of uniformity in planting seedlings
leads to extreme differences in the growth and development of different plants. Additionally, large differences are observed between entities, which lead to differences in the initial number of strawberries cultivated from each farm. To obtain superior seedlings with large amounts of accumulated nutrients that have been stored since the seedling stage and without root damage, which affects growth and development after formation as well as the
Received 21 September, 2018; Revised 19 October, 2018;
Accepted 20 October, 2018
*Corresponding author: Kook-han Lee, Korea Agency of Education, Promotion & Information Service in Food, Agriculture, Forestry &
Fisheries, Sejong 30033, Korea Phone: +82-44-861-8732 E-mail: [email protected]
ⓒ The Korean Environmental Sciences Society. All rights reserved.
This is an Open-Access article distributed under the terms of the Creative Commons Attribution Non-Commercial License (http://
creativecommons.org/licenses/by-nc/3.0) which permits unrestricted non-commercial use, distribution, and reproduction in any medium, provided the original work is properly cited.
ORIGINAL ARTICLE
Effects of LED Light Quality of Urban Agricultural Plant Factories on the Growth of Daughter Plants of ‘Seolhyang’ Strawberry
Kook-Han Lee
*Korea Agency of Education, Promotion & Information Service in Food, Agriculture, Forestry & Fisheries, Sejong 30033, Korea
Abstract
This study was conducted to examine the influence of Light-Emitting Diode (LED) light quality in urban agricultural plant factories on the growth and development of Seolhyang strawberry daughter plants in order to improve the efficiency of daughter plant growth and urban agriculture. LED light quality by demonstrated that above-ground growth and development were greatest for daughter plant 2. Daughter plant 1 showed the next highest growth and development, followed by daughter plant 3. Among the different qualities of LED light, the stem was thickest and growth rate of leaves was highest for R + B III (LED quality: red 660 nm + blue 450 nm/p
hotosynthetic photon flux density (PPFD)
: 241–
243 μmol·m-2·s-1) and lowest for R (red 660 nm/115–
117 μ mol·m-2·s-1). Plant height, leaf width, petiole length, and the leaf growth rate were highest for W (white fluorescent lamp/241–
243 μ mol·m-2·s-1) and lowest for R + B Ⅰ (red 660 nm + blue 450 nm/80–
82 μ㏖·m-2·s-1). For above-ground growth and development, as the plants surpassed the seedling age, mixed light (red + blue), rather than monochromatic light (red or blue), and higher PPFD values tended to increase development. Regarding the quality of the LED light, daughter plant 2 showed the highest chlorophyll content, followed by daughter plant 1, and daughter plant 3 showed the least chlorophyll content. When the wavelength was monochromatic, chlorophyll content increased, compared to that when PPFD values were increased. Mixed light vitality was highest in daughter plant 2, followed by 1, and 3, showed increased photosynthesis when PPFD values were high with mixed light, in contrast to the results observed for chlorophyll content.Key words : Light-emitting diode light quality, Photosynthetic photon flux density, Seedling quality
number of strawberries harvested, it is important to obtain uniform seedlings among daughter plants.
The period for raising strawberry seedlings in South Korea is from April to August. Considering the hot climate and environmental factors during these months, it is difficult to generate healthy and uniform seedlings in large quantities. Therefore, farmers often raise seedlings at an altitude of at least 800 m or higher to avoid harmful surroundings, generate high-quality seedlings, and induce stable fruit separation. However, because of the high transportation costs associated with cultivation on high ground and the geographical conditions, farms typically raise seedlings in soil, nurseries, pots, and mid-air in covered areas, resulting in technical issues and the high costs of facilities (Chungnam Agricultural Research and Extension Services, 2009).
Recently, plant factories have gained attention for their ability to manually control light, temperatures, humidity, nutrient liquids, and other conditions necessary for plants to grow and develop (Lee at al., 2004). Plant factories are a form of urban farming and consist of spaces or facilities used for crop cultivation and food creation. Thus, they provide stable food sources regardless of the location, climate, or weather (Ito, 1997). Particularly, after the fourth industrial revolution, Light-Emitting Diode (LED) artificial lighting technology, automated farming robots, and Information and Communication Technology (ICT) were combined with cutting-edge technology to increasa value.
Plant factories are primarily divided into those that adopt the sunlight utilization model, in which the factory takes advantage of both sunlight and artificial light, and those that use only artificial lighting to cultivate crops by integrating artificial light such as LEDs within a fully controlled facility. A specific wavelength of light emitted by LED can be chosen to ensure optimal photosynthesis and growth. It can also increase the effectiveness of the photosynthetic
photon flux density (PPFD). Additionally, the amount of electricity consumed by the light is extremely low and the life expectancy of the light source is very long, indicating the benefits of using artificial light sources for plant cultivation (Brown et al., 1995;
Okamoto et al., 1996; Yanagi et al., 1996). The light is not affected by environmental factors and natural disasters, facilitating uniform production of high-quality seedlings. That has led to an increase in the use of LEDs in nurseries.
This study was conducted to improve the efficiency of raising seedlings and contribute to the vitalization of urban farming by examining the effects of LED lights utilized in urban agricultural plant factories and PPDF on the growth and development of daughter plants of Seolhyang strawberry.
2. Materials and Methods
2.1. Duration and location of experiment
This study on the growth and development of daughter strawberry plants was conducted for 37 days from July 24, 2011 to August 18, 2011, at Kongju National University, located at Chungcheongnam-do Yesan-gun, in the horticulture department’s LED growth chamber and single-model polyethylene-house (2).
2.2. Experiment materials
The Seolhyang daughter strawberry plants were obtained using a mother plant received from the Nonsan Strawberry Experiment Station. No fertilizer was used, and runners were gathered from May 4, 2011 to July 8, 2011. Daughter plants were collected from the seeds of the runners. Daughter plants 1–3 were cut from July 8, 2011 to July 23, 2011. within an enclosed seedling creation system at the thremmatology laboratory.
Fertilizer was not used on the mother plant to
minimize inorganic components and enable analysis
of only the effects of light and seedling quality on the growth and development of daughter plants.
Soil, prepared for strawberry seedlings was used as the bed soil (cham grow soil, cham grow), and the fertilizer was comprised of standard Korean liquid fertilizer (EC). The LED lights used in the growth chamber (PGL-BOX, Parus, Shanghai, China) to study the effects of LED on growth and development were red (R), blue (B), and mixed light (R + B) LED and white light (W). Light quality and PPFD are shown in Table 1.
2.3. Cultivation method and research environment A total of six beds, each with a top and bottom, were placed in a 120 (L) × 52 (W) × 48 cm (H) LED growth chamber. In each bed, three daughter plants, each with three completely opened leaves, were placed in plastic pots (No. 3, 10.5 cm) and arranged after randomizing their order three times. Water was distributed by a sprayer on an automatic watering device. The plants were watered each day for 2 min every 3 h from 09:00 to 18:00, resulting in a total of 100 mL of water received each week. Daytime and nighttime temperatures were 20–25°C and humidity was 60–70%.
2.4. Method
The plants were exposed to artificial light for 7 days in the LED growth chamber after setting the daughter plants, and 25 mL of EC 0.8 dS·m
-1liquid
fertilizer was added twice weekly from August 1, 2011 to August 22, 2011, for a total of seven administrations.
2.5. Observation and analysis
The above-ground growth and development were observed and analyzed every 15 days, for a total of three observations, from August 1, 2011 to August 30, 2011. Chlorophyll content and photosynthesis analysis was conducted once at 30 days after light exposure.
Growth and development of the daughter plant was evaluated as stem thickness (diameter), plant weight, leaf length, leaf width, and petiole length of leaves, which were measured using a digital Vernier caliper (500-15, Mitutoyo, Kanagawa, Japan). Live weight was measured using a digital scale (JP/ER-180A, A&D Company, Tokyo, Japan).
To determine the chlorophyll content, a 0.2 of acetone at 4°C, which was stored for 24. To accurately measure light absorption, a spectrophotometer (X-ma 1200, Human Corporation, Tokyo, Japan) was at wavelengths of 645 and 663 nm wavelengths or the extracted samples. Additionally, chlorophyll a and b, and total chlorophyll contents.
Chlorophyll a (mg·g)
= 12.7 × A663 - 2.69 × A645 Chlorophyll b (mg·g)
= 22.9 × A645 - 4.68 × A663
LED quality (wavelength, nm)
PPFD (μmol·m-2·s-1)
W (fluorescent lamp) 241
–
243R (660) 115
–
117B (450) 115
–
117R+B (2:1) (660 + 450) 80
–
82R+B II (2:1) (660 + 450) 160
–
162R+B III (2:1) (660 + 450) 241
–
243*PPFD: Photosynthetic photon flux density, Measurement distance of 200 mm Table 1. LED light quality and PPFD
Total chlorophyll (mg·g) = 20.2 × A645 - 8.02 × A663
A portable photosynthesis measuring apparatus (LCpro-SD, ADC Bioscientific, Ltd., Hoddesdon, UK) was used to measure photosynthesis in the plants. The device was used to measure samples from within and outside of 7 cm from the tip of the top leaves of daughter plants. Specifically, the rates of photosynthesis, production, and stomatal conductance were measured.
3. Results and Consideration
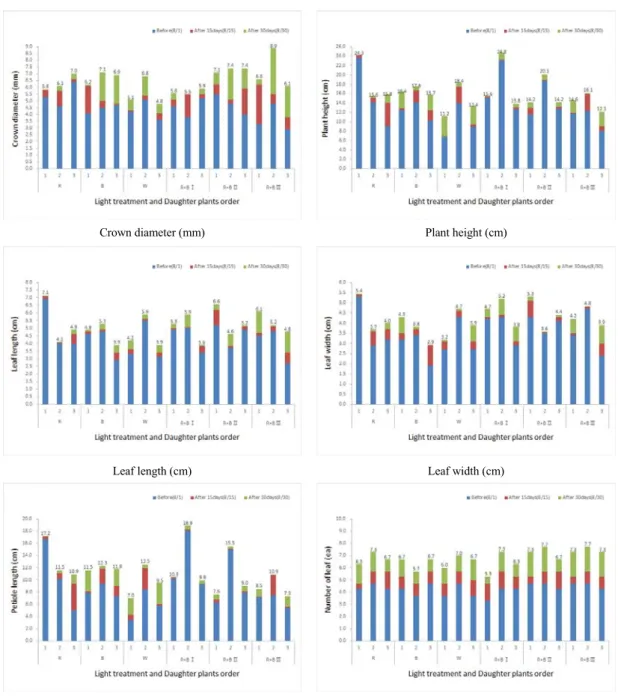
3.1. Changes in above-ground growth and development The order of growth and development for the daughter plants, from highest to lowest, was 2, 1, and 3. R + B III caused the greatest increase in stem thickness and leaf length while the lowest increase was caused by R. The increase in plant weight, leaf width, petiole length, and number of leaves was highest in the plants treated with W and lowest in those treated with R + B I. Therefore, the order of daughter plants was appropriate for determining the order of above-ground growth and development for each of the daughter plants. The best LED light for growth and development was mixed light rather than monochromatic light, and growth and development increased as the PPFD value increased (Fig. 1).
The typical time required for a new leaf to grow and take root after cuttage is 14 days. Based on each plant’s root development characteristics and order of seedlings, seedlings created early aged quickly and were of poor quality, while seedlings created late were of reduced quality and number. Appropriately, daughter plant number 2 in this study showed the best above-ground growth and development.
Overall growth and development were higher for mixed-light LED than for monochrome LED. Eun and Choi(2010) reported that for perilla seeds and
LED light sources, plant weight, leaf area and above-ground live and dry weight were highest for blue light LED, mixed-light LED was most effective for seed growth. Additionally, Lee et al. (2010) reported that a mixed light source of red and blue light was more effective than red light for facilitating the growth of red lettuce. Our results are consistent with those of previous studies.
Depending on the length of time and PPFD, plants undergo vegetative and reproductive growth, which differs under exposure to light of different wavelengths (Fankhauser and Chory, 1997). After estimating the optimal environment for cultivating lettuce using the photosynthesis-effectiveness model, Kim et al.(2004) reported that a PPFD of 200 μ mol·m
-2·s
-1increased the rate of photosynthesis.
Therefore, a plant factory that utilizes artificial LED light and nurseries with insufficient natural light should maintain PPFD values of 200 μmol·m
-2·s
-1.
3.2. Chlorophyll content
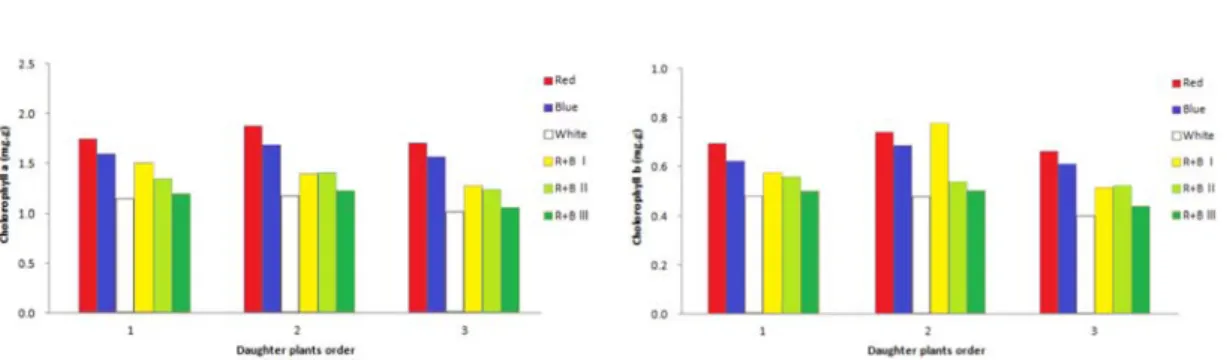
Examination of the content of chlorophyll a for each type of light revealed that, daughter plant 1 contained the most chlorophyll (1.75 mg·g) when provided with light R and least chlorophyll (1.14 mg·g) when provided with light W. Daughter plant 2 contained the most chlorophyll (1.88 mg·g) when provided with light R and least chlorophyll (1.18 mg·g) when provided with light W. Daughter plant 3 contained the most chlorophyll (1.71 mg·g) with light R and least (1.01 mg·g) with light W. The order of daughter plants, from the most chlorophyll a to the least, was 2, 1, and 3. The order of light types from the most chlorophyll a to the least was R, B, R + B I, R + B II, R + B III, and W (Fig. 2).
Daughter plant 1 showed the highest (0.70 mg·g)
chlorophyll b content from R and lowest (0.48 mg·g)
from W. Daughter plant 2 showed the highest (0.77
mg·g) from R+B I and lowest (0.47 mg·g)
chlorophyll b content from W. Daughter plant 3 had
the highest chlorophyll b content (0.66 mg·g) from R and lowest (0.40 mg·g) from W. The order of daughter plants from highest to lowest chlorophyll b content was 2, 1, and 3. The order of the type of light
from the highest to lowest chlorophyll b content was R, B, R + B I, R + B II, R + B III, and W (Fig. 3).
The total chlorophyll content was highest (2.46 mg·g) for daughter plant 1 provided with R and
Crown diameter (mm) Plant height (cm)
Leaf length (cm) Leaf width (cm)
Petiole length (cm) Number of leaf (ea)
Fig. 1. Order of daughter plants and differences in plant growth between light qualities.
lowest (1.63 mg·g) when provided with W. For daughter plant 2, the total chlorophyll content was highest (2.63 mg·g) for R and lowest (1.65 mg·g) for W. For daughter plant 3, the total chlorophyll content was highest (2.38 mg·g) for R and lowest (1.42 mg·g) for W. The order of daughter plants, from the highest to lowest chlorophyll content, was 2, 1, and 3. The order of light type, from the highest to lowest total chlorophyll content, was R, B, R + B I, R + B II, R + B III and W (Fig. 4).
In summary, the chlorophyll content changed based on the daughter plant order, light type, and PPFD values in the order of daughter plants 2, 1, and 3, while the order for the different types of light was R, B, R + B I, R + B II, R + B III, and W. These results reveal a correlation between the chlorophyll content in each daughter plant and the plant above-ground growth and development, where chlorophyll content increases when the light quality (wavelength) is a single color, such as R (red, 660
nm) or B (blue, 450 nm). Additionally, light quality (wavelength) had a greater effect on chlorophyll content than an increased PPFD value.
Park et al.(2007) reported that the chlorophyll content in cabbage stored in a refrigerator with a monochrome, red LED light installed was four-fold higher than that in cabbage stored without light, which agrees with our results. The study also showed that the amount of light absorbed is high at approximately 660 and 450 nm on the absorption spectrum, and thus these two wavelengths facilitate photosynthesis. The results of the present study agree with those of this previous study. Additionally, our results are consistent with those of Mohr(1969) who reported that for the relationship between PPFD and chlorophyll content, a plant's reaction to dim light, excluding stomata opening and closing, is related to the development of photomorphism; chlorophyll content in most foliage plants is not increased at high temperatures, but rather at optimal temperatures
Fig. 2. Chlorophyll a content for each type of light. Fig. 3. Chlorophyll b content for each type of light.Fig. 4. Total chlorophyll content for each Light type. Fig. 5. Photosynthetic rate for each light type.