INTRODUCTION
Worldwide, colorectal cancer (CRC) is the third most com- monly diagnosed cancer in men and second in women, with
an estimated 1.4 million cases and 693900 deaths occurring in 2012.1 While CRC incidence rates are highest in Western coun- tries, such as Australia/New Zealand, Europe, and Northern America,1 CRC incidence rates have recently been increasing in regions historically at low risk of CRC.2 In Korea, CRC inci- dence rates have risen markedly over the past few years, with 5.0% and 3.7% increases in annual percentage changes (APC) in men and women, respectively, from 1999 to 2013.3 In 2014, CRC had the third highest incidence rate among all major can- cers in both genders.3
In general, socioeconomic status (SES) has been shown to account for increases in the prevalence of various diseases, especially non-communicable disease.4,5 Regarding cancer, previous studies have indicated that cancer deaths are more common among individuals of low SES.6-8 However, these in- dividuals are less likely to undergo screening. In developed
Socioeconomic Inequalities in Colorectal Cancer
Screening in Korea, 2005–2015: After the Introduction of the National Cancer Screening Program
Tran Thi Xuan Mai1, Yoon Young Lee2, Mina Suh2, Eunji Choi1, Eun Young Lee1, Moran Ki1, Hyunsoon Cho1, Boyoung Park1, Jae Kwan Jun2, Yeol Kim2, Jin-Kyoung Oh1, and Kui Son Choi1
1Graduate School of Cancer Science and Policy, National Cancer Center, Goyang;
2National Cancer Control Institute, National Cancer Center, Goyang, Korea.
Purpose: This study aimed to investigate inequalities in colorectal cancer (CRC) screening rates in Korea and trends therein using the slope index of inequality (SII) and relative index of inequality (RII) across income and education groups.
Materials and Methods: Data from the Korean National Cancer Screening Survey, an annually conducted, nationwide cross-sec- tional survey, were utilized. A total of 17174 men and women aged 50 to 74 years were included for analysis. Prior experience with CRC screening was defined as having either a fecal occult blood test within the past year or a lifetime colonoscopy. CRC screening rates and annual percentage changes (APCs) were evaluated. Then, SII and RII were calculated to assess inequality in CRC screening for each survey year.
Results: CRC screening rates increased from 23.4% in 2005 to 50.9% in 2015 (APC, 7.8%; 95% CI, 6.0 to 9.6). Upward trends in CRC screening rates were observed for all age, education, and household income groups. Education inequalities were noted in 2009, 2014, and overall pooled estimates in both indices. Income inequalities were inconsistent among survey years, and overall esti- mates did not reach statistical significance.
Conclusion: Education inequalities in CRC screening among men and women aged 50 to 74 years were observed in Korea. No apparent pattern, however, was found for income inequalities. Further studies are needed to thoroughly outline socio-economic inequalities in CRC screening.
Key Words: Colorectal neoplasms, inequalities, socioeconomic factors, early detection of cancer
pISSN: 0513-5796 · eISSN: 1976-2437
Received: February 8, 2018 Revised: August 2, 2018 Accepted: September 3, 2018
Co-corresponding authors: Kui Son Choi, PhD, Graduate School of Cancer Science and Policy, National Cancer Center, 323 Ilsan-ro, Ilsandong-gu, Goyang 10408, Korea.
Tel: 82-31-920-2912, Fax: 82-31-920-2189, E-mail: [email protected] and Jin-Kyoung Oh, PhD, Graduate School of Cancer Science and Policy, National Cancer Center, 323 Ilsan-ro, Ilsandong-gu, Goyang 10408, Korea.
Tel: 82-31-920-2921, Fax: 82-31-920-2929, E-mail: [email protected]
•The authors have no financial conflicts of interest.
© Copyright: Yonsei University College of Medicine 2018
This is an Open Access article distributed under the terms of the Creative Com- mons Attribution Non-Commercial License (https://creativecommons.org/licenses/
by-nc/4.0) which permits unrestricted non-commercial use, distribution, and repro- duction in any medium, provided the original work is properly cited.
Yonsei Med J 2018 Nov;59(9):1034-1040 https://doi.org/10.3349/ymj.2018.59.9.1034
countries, including Korea, Japan, and the United States, indi- viduals of lower SES have commonly been found to undergo less screening than those of high SES.9-13
In Korea, the National Cancer Screening Program (NCSP) was implemented by the Ministry of Health and Welfare to provide free screening services for major cancers, starting with gastric and breast cancer in 1999.14 Nationwide CRC screening was first initiated in 2004 as part of the NCSP for low-income groups. Due to a limited capacity to perform colonoscopy screening for every age eligible participant, the NCSP offers a fecal occult blood test (FOBT) annually as the initial mass screening method for men and women ≥50 years.15 For indi- viduals with a positive FOBT result, the NCSP covers further investigation with a colonoscopy or double-contrast barium enema. In 2004, Medical Aid recipients and National Health Insurance (NHI) beneficiaries within the lower 30% income bracket were eligible for free-of-charge CRC screening servic- es under the NCSP. In 2005, the target population was expand- ed to the 50% bracket. Apart from these nationwide screening programs, CRC screening tests are available at outpatient clin- ics or private health centers as opportunistic screening options at full out-of-pocket payment from recipients.16
After implementation of CRC screening in the NCSP, screen- ing rates have increased.16,17 Notwithstanding, even though overall screening rates have increased, whether inequalities in the uptake of screening are present, specifically in CRC, re- mains unclear. Previous studies focusing on SES disparity or inequality in CRC screening have applied conventional logis- tic regression or the concentration index to report inequality outcomes.18-20 Inequality indicates for the degree of associa- tion between rates for a health indicator and the distribution of the population among ordered groups (e.g., education and income). On the other hand, health disparity is defined as a par- ticular type of health difference that is closely linked with so- cial, economic, and/or environmental disadvantages.21 In this study, we utilized the slope index of inequality (SII) and rela- tive index of inequality (RII) to describe inequalities in CRC screening. Compared to traditional approaches, these mea- sures have two ideal properties: First, because they are regres- sion-based, they give an inequality measure across the full range of SESs, not just a comparison of the two most extreme groups as in conventional logistic regression. Second, they both take into account changes in the inequality by SES groups over time.
This study was conducted to evaluate CRC screening rates in Korea and trends therein from 2005 to 2015 for individual screening modalities using data collected via a population- based survey. Further, we assessed inequalities in CRC screen- ing in Korea using SII and RII according to education and in- come levels.
MATERIALS AND METHODS
Study population
This study applied data from the Korean National Cancer Screening Survey (KNCSS). The KNCSS is an annual nation- wide, population-based, cross-sectional survey conducted by the National Cancer Center in Korea to assess behavioral pat- terns associated with cancer screening rates (five cancers: gas- tric, liver, colorectal, breast, and cervical cancers). Multi-stage random sampling based on annual resident registration data was applied to obtain a representative sample. Face-to-face in- terview surveys were conducted by trained interviewers. Can- cer-free men between 40 and 74 years of age and cancer-free women between 30 and 74 years of age comprised the eligible population of the KNCSS. Informed consent was obtained from all participants. Details on the survey have been described fully elsewhere.22
The present study included men and women between 50 and 74 years of age who participated in the KNCSS between 2005 and 2015. A total of 17174 participants were included in the final analysis. This study was approved by the Institutional Review Board of the National Cancer Center, Korea (approval number: NCCNCS-08-129).
Measures
Using a structured questionnaire, participants were asked about their experiences with screening for CRC. The questions included “Have you ever undergone CRC screening?” and, if so, “When did you last undergo CRC screening?” and “What tests did you receive for CRC screening?” Screening status was defined as “screened” for those who underwent FOBT within the past year or who ever had a colonoscopy. Otherwise, par- ticipants were considered as “non-screened.”
In this study, education and monthly household income were utilized as SES indicators. Education was grouped into four levels: no formal education and elementary graduates (lowest level); middle school graduates; high school gradu- ates; and college or university graduates and higher level of education (highest level).
In the KNCSS, monthly household income had been col- lected as a categorical variable with 13 categories, ranging from 1000 to 5000 US dollars in 2005 and from 1000 to 10000 US dollars since 2006. Then, for a sufficient number of individ- uals in each group, monthly household income was grouped into three groups based on tertiles: the 1st tertile represents low income status; the 2nd tertile represents middle income status;
and the 3rd tertile represents high income status. Thus, income levels were classified into three groups as follows: <1500, 1500–
2499, and ≥2500 in 2005, 2006, and 2007; <1500, 1500–2999, and ≥3000 in 2008 and 2009; <2000, 2000–3499, and ≥3500 in 2010 and 2011; <2500, 2500–3499, and ≥3500 in 2012; and
<3000, 3000–4499, and ≥4500 in 2013, 2014, and 2015.
Statistical analysis
Consecutive CRC screening rates over 11 years were calculat- ed with adjustment for weight-reflected age structures of Ko- rean men and women for each study year from 2005 to 2015.
Weighted screening rates are presented as APCs within a 95%
confidence interval (CI) to assess significantly changing trends in CRC screening rates. APCs were estimated for levels of each socioeconomic variable, fitted by SEER*Stat software from the National Cancer Institute (Bethesda, MD, USA).
Since our indicators of socioeconomic position reflect a hi- erarchical order (education and household income), we ad- opted regression-based measures of inequality, SII (an absolute inequality measure) and RII (a relative inequality measure).23,24 SII describes an actual context of public health intervention in terms of changes in screening rates (%), and RII provides an indication of progress. Thus, estimation of both measures (SII and RII) is essential to deriving a complete outlook on poten- tial inequalities. Both indices are obtained through age-adjust- ed Poisson regression analysis of a dependent variable (CRC screening) as an indicator of a cumulative relative position of each group with respect to education and income levels.
The SII is a coefficient regressed between the mean of CRC screening rates in each socioeconomic group and the mid- point of each cumulative range of hierarchically lined-up so- cial groups. By weighting social groups by their population share, the SII is able to incorporate changes in the distribution of social groups over time that affect population CRC screen- ing rates. Thus, SII is calculated from the slope of the weighted least squares regression, and is interpreted as the absolute dif- ference in CRC screening rate between those having the lowest education/income levels and those having the highest educa- tion/income levels. A positive SII value indicates that most privileged group had more screening experience, while a neg- ative SII value indicates the opposite. Further, greater absolute values, or SII, indicate higher levels of inequality, and an SII val- ue equal to zero indicates no inequality in CRC screening expe- rience.
From the identical equation, RII is obtained by dividing the screening rates of those who are in the most privileged cate- gory by that for the least privileged, thereby reflecting relative disparity. Its interpretation is similar to that for SII, except that it measures proportionate increases (in regard to the average population level) rather than the absolute increase or decrease in CRC screening rate between the highest and lowest socio- economic groups. Thus, an RII value greater than 1 indicates fold changes in screening rates within the highest and lowest socioeconomic groups. Thus, an RII value equal to 1 indicates no inequality in CRC screening experience, whereas an RII value greater than 1 indicates fold higher CRC screening rates in high SES groups and vice versa.
To assess statistically significant changes in trends of CRC according to education and income inequalities during the study period, forest plot analysis was applied for SII and RII.
Pooled estimates of SII and RII across study years were also calculated. Statistical analyses were conducted using SAS sta- tistical software (version 9.2, SAS Institute Inc., Cary, NC, USA).
Survey weights were used in all analyses. For all tests of statis- tical significance, p<0.05 was used.
RESULTS
Characteristics of the study population
Baseline characteristics of the study population in the KNCSS from 2005 to 2015 are described in Table 1. From 2005 to 2009, each study year had approximately 900 participants, while the last 6 years had about 2000 participants each year. Propor- tions of men were slightly lower than those of women in all survey years. From 2008 to 2015, the youngest age group (50–
54) accounted for the highest proportion of participants, com- pared to other age groups. Proportions of participants varied by levels of household income among studied years. From 2008, the highest proportion of participants were high school graduates, comprising around 40% to greater than 50% of all participants. Demographic characteristics showed a similar distribution in both sexes (Supplementary Table 1, only online).
Table 2 provides CRC screening rates for each year, strati- fied by age group and SES status. CRC screening rates contin- uously increased from 23.4% in 2005 to 50.9% in 2015 with an approximately 28% point increase over the 11-year period.
The APC in participation rates between 2005 and 2015 was 7.8% (95% CI, 6.0 to 9.6). Men had higher CRC screening rates than those of women. Further, individuals of ages from 60-64 and 65-74 years had higher screening rates than those of younger age. However, individuals aged 50 to 54 years showed the highest APC (10.0%, 95% CI 7.8 to 12.2) in participation rates, followed by those aged 55 to 59 years (7.3%, 95% CI, 4.6 to 10.1). Screening rate increased from 2005 to 2015 in all three household income groups. The APC in screening rates was highest in the middle income group (8.7%, 95% CI, 5.8 to 11.7) and lowest in the high income group (6.8%, 95% CI 4.8 to 8.9). Screening rates were higher for those with higher edu- cation levels (high school graduates or higher levels) in the majority of study years. However, those with the lowest edu- cation levels showed the highest APCs in participation rates (8.4%, 95% CI, 6.0 to 10.9). All APC values were statistically sig- nificant. The overall increasing trends in CRC screening rates according to education and income levels were similar for both men and women (Supplementary Table 2, only online). In men, the highest APC values were observed in individuals aged 50 to 54 years (10.7%, 95% CI, 8.7 to 12.7), those with the middle household income level (9.0%, 95% CI, 5.8 to 12.2), and those with lowest education level (9.1%, 95% CI, 5.7 to 12.6). Howev- er, in women, those with the highest education levels showed the highest APCs in participation rates.
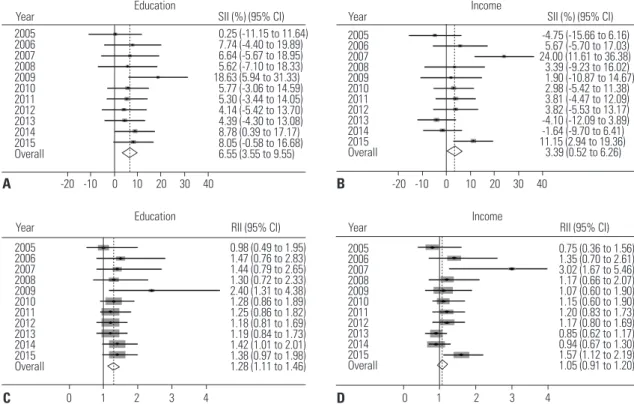
Absolute and relative inequality in CRC screening Socioeconomic inequalities in CRC cancer screening partici- pation are illustrated in Fig. 1. With regard to education level, absolute and relative inequalities were significant in 2009 and 2014, and favored participants with higher educational attain- ment (Fig. 1A and C). In detail, in 2009, the difference in CRC screening participation between the highest and lowest levels of education reached 18.63% (Fig. 1A); in the same year, par-
ticipants with the highest education level were 2.4 times more likely to have experienced CRC screening (RII=2.40) (Fig. 1C).
In 2014, this difference was much smaller, but still favored those with higher education in both relative and absolute mea- sures (SII=8.78% and RII=1.42). In other years, both absolute and relative inequality values indicated that individuals with higher education were likely to experience more CRC screen- ing; however, none of those reached statistical significance.
Table 1. Baseline Characteristics of the Study Population in the Korean National Cancer Screening Survey, 2005–2015
2005 2006 2007 2008 2009 2010 2011 2012 2013 2014 2015
n % n % n % n % n % n % n % n % n % n % n %
Total 939 883 904 926 913 1998 2101 2112 2154 2122 2122
Gender
Men 438 46.6 417 47.2 418 46.2 445 48.1 435 47.6 955 47.8 1001 47.6 1028 48.7 1046 48.6 1051 49.5 1051 49.5 Women 501 53.4 466 52.8 486 53.8 481 51.9 478 52.5 1043 52.2 1100 52.4 1084 51.3 1108 51.4 1071 50.5 1071 50.5 Age groups (yr)
50–54 269 28.6 263 29.8 251 27.8 295 31.8 274 30.0 706 35.3 717 34.1 735 34.8 728 33.8 709 33.4 646 30.5 55–59 214 22.8 200 22.7 176 19.4 195 21.1 212 23.2 385 19.3 463 22.0 453 21.4 494 22.9 477 22.5 521 24.6 60–64 183 19.5 163 18.5 223 24.7 176 19.0 177 19.4 447 22.4 419 20.0 417 19.8 522 24.2 438 20.7 450 21.2 65–74 273 29.1 257 29.1 254 28.1 260 28.0 250 27.4 460 23.0 502 23.9 507 24.0 410 19.0 498 23.4 505 23.8 Household income
Low 392 41.8 228 25.9 315 34.8 295 31.9 270 29.7 568 28.5 568 27.0 803 38.0 590 27.4 593 27.9 647 30.5 Middle 285 30.4 378 42.8 266 29.5 362 39.1 337 36.9 723 36.2 782 37.2 628 29.7 703 32.6 785 37.0 771 36.3 High 262 27.9 277 31.3 323 35.7 269 29.0 306 33.5 707 35.4 751 35.8 681 32.2 861 40.0 744 35.1 704 33.2 Education level
Elementary or lower 336 35.8 350 39.7 335 37.0 261 28.3 282 30.9 315 15.8 319 15.2 378 17.9 211 9.8 174 8.2 174 8.2 Middle school graduates 240 25.5 198 22.4 219 24.3 266 28.7 180 19.7 394 19.7 393 18.7 323 15.3 261 12.1 246 11.6 290 13.7 High school graduates 299 31.9 268 30.4 273 30.2 331 35.7 355 38.9 1010 50.6 1082 51.5 1111 52.6 1182 54.9 1203 56.7 1212 57.1 College or more 64 6.8 67 7.6 77 8.5 68 7.3 96 10.5 279 14.0 307 14.6 300 14.2 501 23.3 499 23.5 446 21.0
Table 2. Colorectal Cancer Screening Rates according to Socioeconomic Status with APCs in the Korean National Cancer Screening Survey, 2005–2015 (%) 2005 2006 2007 2008 2009 2010 2011 2012 2013 2014 2015 APC 95% CI
Total 23.4 26.4 31.2 35.1 35.6 35.2 34.8 44.1 47.2 51.9 50.9 7.8 6.0–9.6
Gender
Men 25.0 27.1 34.0 34.5 36.3 38.3 37.0 45.9 47.5 56.1 54.5 8.0 6.3–9.7
Women 22.0 25.8 28.7 35.6 34.9 32.2 32.8 42.3 46.8 47.9 47.5 7.5 5.2–9.9
Age groups (yr)
50–54 20.0 22.9 23.5 31.9 31.8 31.9 30.6 41.4 44.1 50.2 51.5 10.0 7.8–12.2
55–59 22.3 25.5 35.0 40.8 36.8 35.6 33.9 43.1 48.4 52.4 51.2 7.3 4.6–10.1
60–64 26.0 32.9 33.4 38.7 39.4 37.6 36.5 47.2 48.6 54.9 53.2 6.9 4.9–8.9
65–74 25.8 24.9 31.3 32.1 36.1 37.7 40.2 46.2 49.6 51.2 48.0 6.8 5.2–8.5
Household income
Low 25.2 23.5 24.5 36.3 33.6 37.7 37.3 44.1 47.8 52.3 46.9 7.7 5.4–10.0
Middle 20.7 24.8 33.2 31.0 35.9 31.3 31.2 42.6 48.7 51.5 50.1 8.7 5.8–11.7
High 23.7 31.0 36.0 39.4 37.0 37.2 36.7 45.3 45.4 52.0 55.4 6.8 4.8–8.9
Education level
Elementary or lower 23.0 24.0 29.2 34.0 31.9 33.4 33.0 46.8 47.3 49.9 48.0 8.4 6.0–10.9 Middle school graduates 24.2 27.4 30.1 36.8 37.3 37.5 36.9 38.8 46.8 47.3 49.1 6.4 4.7–8.1 High school graduates 23.3 29.6 34.2 31.5 32.3 33.7 34.0 44.0 46.7 52.0 48.9 7.7 5.3–10.1 College or more 22.6 23.5 32.5 50.1 55.2 39.3 37.1 46.4 48.5 54.6 58.7 7.0 3.0–11.1 APC, annual percent change; CI, confidence interval.
Overall educational inequality was significant with a pooled estimate of 6.55% (95% CI, 3.55 to 9.55) in absolute terms and 1.28 in relative terms (95% CI, 1.11 to 1.46).
In terms of inequality by household monthly income, incon- sistent results and no apparent trend were observed among survey years (Fig. 1B and D). Statistically significant results were found in 2007 with SII=24.00% (95% CI, 11.61 to 36.38) and in 2015 with SII=11.15% (95% CI, 2.94 to 19.36) (Fig. 1B).
Consistently, significant results were found in relative terms in the same years: RII=3.02 (95% CI, 1.67 to 5.46) in 2007 and RII=1.57 (95% CI, 1.12 to 2.19) in 2015 (Fig. 1D). These results indicated that individuals of high income status underwent more CRC screening than those of low income status. Howev- er, overall pooled estimates for income inequality were only marginally statistically significant in absolute terms (SII=3.39;
95% CI, 0.52 to 6.26) and were insignificant in relative terms (RII=1.05; 95% CI, 0.91 to 1.20).
The absolute and relative inequalities in CRC screening by gender are described in Supplementary Table 3 (only online).
In men, with regard to education, we found statistically signif- icant differences in absolute inequality in 2009 and overall pooled estimates (pooled SII=7.40%; 95% CI, 3.142 to 11.66).
Also, income inequalities were statistically significant in abso- lute pooled estimates (pooled SII=5.32%; 95% CI, 1.18 to 9.47).
In women, absolute inequality by education level was signif- icant in overall pooled estimates, with a SII value of 5.65% (95%
CI, 1.42 to 9.88). However, pooled estimates of inequality by
income in both absolute and relative terms were not significant.
DISCUSSION
This study attempted to measure education- and income-re- lated inequalities in the use of CRC screening services by esti- mating absolute and relative inequalities and by evaluating changes in observed inequalities over the past decade. Using the cross-sectional KNCSS database, we found that CRC screening rates annually increased within the 11-year period from 2005–
2015. Persons of younger age, lower household income, lower education, and male sex experienced more substantial in- creases in screening rates, with higher APC values. Our results indicated educational inequalities existed in CRC screening in Korea during the studied period and favored those who had higher education, with significant pooled estimate values in both absolute and relative indices. Regarding household in- come inequality, although significant results were noted in two separate study years, the overall pooled estimates of RII were not significant. Further, no apparent trend was observed in income inequality among survey years.
Our results were in line with previous studies in Korea in which an increase in CRC screening uptake was reported. One study of the Korea NCSP database noted an overall uptake rate for CRC screening of 30.1%, with an upward trend from 2006 to 2011.16 Another study using Korea National Health and Nutri-
Income
Year SII (%) (95% CI)
2005 -4.75 (-15.66 to 6.16)
2006 5.67 (-5.70 to 17.03)
2007 24.00 (11.61 to 36.38)
2008 3.39 (-9.23 to 16.02)
2009 1.90 (-10.87 to 14.67)
2010 2.98 (-5.42 to 11.38)
2011 3.81 (-4.47 to 12.09)
2012 3.82 (-5.53 to 13.17)
2013 -4.10 (-12.09 to 3.89)
2014 -1.64 (-9.70 to 6.41)
2015 11.15 (2.94 to 19.36)
Overall 3.39 (0.52 to 6.26)
-20 -10 0 10 20 30 40 Education
Year RII (95% CI)
2005 0.98 (0.49 to 1.95)
2006 1.47 (0.76 to 2.83)
2007 1.44 (0.79 to 2.65)
2008 1.30 (0.72 to 2.33)
2009 2.40 (1.31 to 4.38)
2010 1.28 (0.86 to 1.89)
2011 1.25 (0.86 to 1.82)
2012 1.18 (0.81 to 1.69)
2013 1.19 (0.84 to 1.73)
2014 1.42 (1.01 to 2.01)
2015 1.38 (0.97 to 1.98)
Overall 1.28 (1.11 to 1.46)
0 1 2 3 4
Income
Year RII (95% CI)
2005 0.75 (0.36 to 1.56)
2006 1.35 (0.70 to 2.61)
2007 3.02 (1.67 to 5.46)
2008 1.17 (0.66 to 2.07)
2009 1.07 (0.60 to 1.90)
2010 1.15 (0.60 to 1.90)
2011 1.20 (0.83 to 1.73)
2012 1.17 (0.80 to 1.69)
2013 0.85 (0.62 to 1.17)
2014 0.94 (0.67 to 1.30)
2015 1.57 (1.12 to 2.19)
Overall 1.05 (0.91 to 1.20)
0 1 2 3 4 Education
Year SII (%) (95% CI)
2005 0.25 (-11.15 to 11.64)
2006 7.74 (-4.40 to 19.89)
2007 6.64 (-5.67 to 18.95)
2008 5.62 (-7.10 to 18.33)
2009 18.63 (5.94 to 31.33)
2010 5.77 (-3.06 to 14.59)
2011 5.30 (-3.44 to 14.05)
2012 4.14 (-5.42 to 13.70)
2013 4.39 (-4.30 to 13.08)
2014 8.78 (0.39 to 17.17)
2015 8.05 (-0.58 to 16.68)
Overall 6.55 (3.55 to 9.55)
-20 -10 0 10 20 30 40 A
C
B
D
Fig. 1. Absolute and relative inequalities in CRC screening from 2005 to 2015. (A) Absolute educational inequalities in CRC screening rates. (B) Absolute household income inequalities in CRC screening rates. (C) Relative educational inequalities in CRC screening rates. (D) Relative household income inequali- ties in CRC screening rates. Solid line represents the line of equality; dotted line reflects pooled coefficients. CRC, colorectal cancer; SII, slope index of in- equality; RII, relative index of inequality; CI, confidence interval.
tion Examination Survey (KNHANES) data reported that CRC screening rates increased from 1998 to 2012, with an average rate of 30.4%.15 Using data from the NCSP, participation rates for CRC screening were again reported to have increased gradually from 7.3% in 2004 to 25.0% in 2012.17 The noted in- crease in participation in CRC screening was expected due to the implementation of the NCSP in Korea. Continuity in nation- wide cancer screening services through the NCSP was deemed to have contributed to the gradual increase in CRC screening rates. In addition, a previous study reported that the increase in CRC screening might be attributable to a substantial in- crease in FOBT testing, compared to other modalities, espe- cially among women and low-income groups.16 This could be explained by the introduction of annual FOBT testing at no charge as an initial screening tool for low-income individuals beginning in 2004.
To illustrate disparities in screening, we selected education as one indicator of SES. Even though education is a central in- dicator of SES, it has not received focus in previous studies of screening disparity: the majority of related studies on CRC screening disparity have addressed race, ethnicity, income, and insurance status.19,25-27 A few studies have previously found education to be associated with screening participation,28,29 and results from our analyses showed that education inequal- ity is present in CRC screening. This is in line with previous publications on differences in CRC screening according to education levels. One study suggested that health literacy is an associated factor with educational attainment, and might have mediated the contribution of education to screening in- equality, to some extent.20 In the context of CRC screening, pre- vious studies have reported that a low level of health literacy results in more problems in seeking and understanding health- related information or completing screening procedures.30-32 In Korea, one reason for this inequality could be a lack of knowl- edge about cancer screening or a lack of awareness of the exis- tence of the nationwide screening program.33 Further, research should be conducted to investigate the pathway of how low education level influences the uptake of CRC screening.
In this study, results on income inequality in CRC screening were inconsistent throughout the study period, and therefore, no distinct income inequality was found. Although overall findings did not show income inequality for the total study population or each gender separately, significant results were observed in 2007 and 2015 among women participants. Op- posite outcomes were also observed in other years with nega- tive values for both absolute and relative measures; however, these were not statistically significant. A previous study re- ported that higher CRC screening rates were observed among men of higher income status, whereas income disparities were not seen among women.11 There could be many reasons for income inequalities in CRC screening. We suspect that dif- ferences in eligible criteria for being tested by FOBT and colo- noscopy might contribute to income inequality in CRC screen-
ing. While NCSP ensures free-of-charge FOBT testing for all individuals, only those with positive FOBT results are provid- ed free-of-charge endoscopy testing. Furthermore, the NHI only reimburses colonoscopy costs for those with symptoms or colorectal problems. Therefore, income inequalities in CRC might be due to a greater use of endoscopy tests among indi- viduals of higher income status. Indeed, another study reported that low household income was associated with lower screen- ing rates with colonoscopy in urban areas in Korea.18 Mean- while, one study hypothesized that nationwide expansion of public cancer screening would likely increase both total screen- ing rates and income inequality in the uptake of cancer screen- ing services.34 One plausible explanation mentioned by the au- thors is that, while income mainly represents an individual’s ability to pay for services, utilization of cancer screening ser- vices might be influenced by other factors.34 For example, even though national screening services are free to all target indi- viduals, those with low income occupations might face more difficulties in leaving work to receive screening.
Our study has several limitations. The KNCSS survey is heav- ily reliant on self-reported screening information. Therefore, our screening information may reflect recall bias in describing past screening experiences. However, previous studies have shown that self-reported cancer screening history is reliable and agrees well with medical records.35,36 Thus, the impact of recall bias on the outcomes would likely be small. Further, only income and education levels were considered among vari- ous socioeconomic factors that can influence health care uti- lization. Finally, using SII and RII as inequality indices limited our choice of SES variables for analysis, as variables must be able to be hierarchically ordered.
This study provides evidence on changes in education and income inequalities in CRC screening in Korea over an 11- year period. Here, we discovered education inequalities in screening experience for CRC among individuals targeted for screening in the NCSP and these inequalities tended to de- crease toward the end of the study period. No apparent trend was noted in income inequalities. The introduction of free CRC screening appears to have been effective in increasing CRC screening rates among low-income groups in Korea. However, around half of adults in Korea still do not participate in CRC screening. It will be important to continue to monitor inequal- ity trends in screening, as well as to investigate factors associ- ated with CRC screening particularly among those with low educational level. Moreover, further studies are needed to thoroughly outline SES inequalities in CRC screening, as well as factors associated therewith.
ACKNOWLEDGEMENTS
This study was supported by a Grant-in-Aid for Cancer Re- search and Control from the National Cancer Center of Korea (#1610401). Three authors, Tran Thi Xuan Mai, Eunji Choi, and
Eun Young Lee received funding from the “International Co- operation & Education Program (#NCCRI.NCCI 52210-52211, 2018)” of National Cancer Center, Korea.
ORCID
Jin-Kyoung Oh https://orcid.org/0000-0001-9331-3054 Kui Son Choi https://orcid.org/0000-0001-5336-3874
REFERENCES
1. Torre LA, Bray F, Siegel RL, Ferlay J, Lortet-Tieulent J, Jemal A.
Global cancer statistics, 2012. CA Cancer J Clin 2015;65:87-108.
2. Center MM, Jemal A, Ward E. International trends in colorectal cancer incidence rates. Cancer Epidemiol Biomarkers Prev 2009;
18:1688-94.
3. Jung KW, Won YJ, Oh CM, Kong HJ, Lee DH, Lee KH; Community of Population-Based Regional Cancer Registries. Cancer statistics in Korea: incidence, mortality, survival, and prevalence in 2014.
Cancer Res Treat 2017;49:292-305.
4. Kim YJ, Jeon JY, Han SJ, Kim HJ, Lee KW, Kim DJ. Effect of socio- economic status on the prevalence of diabetes. Yonsei Med J 2015;
56:641-7.
5. Agardh E, Allebeck P, Hallqvist J, Moradi T, Sidorchuk A. Type 2 diabetes incidence and socio-economic position: a systematic re- view and meta-analysis. Int J Epidemiol 2011;40:804-18.
6. Kogevinas M, Porta M. Socioeconomic differences in cancer sur- vival: a review of the evidence. IARC Sci Publ 1997;138:177-206.
7. Woods LM, Rachet B, Coleman MP. Origins of socio-economic inequalities in cancer survival: a review. Ann Oncol 2006;17:5-19.
8. Kim CW, Lee SY, Moon OR. Inequalities in cancer incidence and mortality across income groups and policy implications in South Korea. Public Health 2008;122:229-36.
9. Whynes DK, Frew EJ, Manghan CM, Scholefield JH, Hardcastle JD. Colorectal cancer, screening and survival: the influence of so- cio-economic deprivation. Public Health 2003;117:389-95.
10. Finney Rutten LJ, Nelson DE, Meissner HI. Examination of popu- lation-wide trends in barriers to cancer screening from a diffusion of innovation perspective (1987-2000). Prev Med 2004;38:258-68.
11. Lee K, Lim HT, Hwang SS, Chae DW, Park SM. Socio-economic disparities in behavioural risk factors for cancer and use of cancer screening services in Korean adults aged 30 years and older: the Third Korean National Health and Nutrition Examination Survey, 2005 (KNHANES III). Public Health 2010;124:698-704.
12. McKinnon B, Harper S, Moore S. Decomposing income-related inequality in cervical screening in 67 countries. Int J Public Health 2011;56:139-52.
13. Hao Y, Jemal A, Zhang X, Ward EM. Trends in colorectal cancer in- cidence rates by age, race/ethnicity, and indices of access to medi- cal care, 1995–2004 (United States). Cancer Causes Control 2009;
20:1855-63.
14. Kim Y, Jun JK, Choi KS, Lee HY, Park EC. Overview of the National Cancer Screening Programme and the cancer screening status in Korea. Asian Pac J Cancer Prev 2011;12:725-30.
15. Yoo KY. Cancer control activities in the Republic of Korea. Jpn J Clin Oncol 2008;38:327-33.
16. Choi KS, Jun JK, Lee HY, Hahm MI, Oh JH, Park EC. Increasing uptake of colorectal cancer screening in Korea: a population- based study. BMC Public Health 2010;10:265.
17. Suh M, Song S, Cho HN, Park B, Jun JK, Choi E, et al. Trends in participation rates for the National Cancer Screening Program in Korea, 2002-2012. Cancer Res Treat 2017;49:798-806.
18. Suh M, Choi KS, Lee HY, Hahm MI, Lee YY, Jun JK, et al. Socioeco- nomic disparities in colorectal cancer screening in Korea: a nation- wide cross-sectional study. Medicine (Baltimore) 2015;94:e1368.
19. Trivers KF, Shaw KM, Sabatino SA, Shapiro JA, Coates RJ. Trends in colorectal cancer screening disparities in people aged 50-64 years, 2000-2005. Am J Prev Med 2008;35:185-93.
20. Solmi F, Von Wagner C, Kobayashi LC, Raine R, Wardle J, Morris S.
Decomposing socio-economic inequality in colorectal cancer screening uptake in England. Soc Sci Med 2015;134:76-86.
21. The Secretary’s Advisory Committee on National Health Promo- tion and Disease Prevention Objectives for 2020. Phase I report:
recommendations for the framework and format of Healthy Peo- ple 2020. Section IV: Advisory Committee findings and recom- mendations [accessed on 2018 July 30]; Available at: https://
www.healthypeople.gov/sites/default/files/PhaseI_0.pdf.
22. Park B, Choi KS, Lee YY, Jun JK, Seo HG. Cancer screening status in Korea, 2011: results from the Korean National Cancer Screen- ing Survey. Asian Pac J Cancer Prev 2012;13:1187-91.
23. Mackenbach JP, Kunst AE. Measuring the magnitude of socio-eco- nomic inequalities in health: an overview of available measures il- lustrated with two examples from Europe. Soc Sci Med 1997;44:
757-71.
24. Regidor E. Measures of health inequalities: part 2. J Epidemiol Community Health 2004;58:900-3.
25. Liss DT, Baker DW. Understanding current racial/ethnic dispari- ties in colorectal cancer screening in the United States: the contri- bution of socioeconomic status and access to care. Am J Prev Med 2014;46:228-36.
26. Crawford ND, Jones CP, Richardson LC. Understanding racial and ethnic disparities in colorectal cancer screening: Behavioral Risk Fac- tor Surveillance System, 2002 and 2004. Ethn Dis 2010;20:359-65.
27. Burnett-Hartman AN, Mehta SJ, Zheng Y, Ghai NR, McLerran DF, Chubak J, et al. Racial/ethnic disparities in colorectal cancer screen- ing across healthcare systems. Am J Prev Med 2016;51:e107-15.
28. Gimeno García AZ. Factors influencing colorectal cancer screen- ing participation. Gastroenterol Res Pract 2012;2012:483417.
29. Power E, Miles A, von Wagner C, Robb K, Wardle J. Uptake of colorectal cancer screening: system, provider and individual fac- tors and strategies to improve participation. Future Oncol 2009;5:
1371-88.
30. von Wagner C, Baio G, Raine R, Snowball J, Morris S, Atkin W, et al. Inequalities in participation in an organized national colorec- tal cancer screening programme: results from the first 2.6 million invitations in England. Int J Epidemiol 2011;40:712-8.
31. Arnold CL, Rademaker A, Bailey SC, Esparza JM, Reynolds C, Liu D, et al. Literacy barriers to colorectal cancer screening in commu- nity clinics. J Health Commun 2012;17 Suppl 3:252-64.
32. Kobayashi LC, Wardle J, von Wagner C. Limited health literacy is a barrier to colorectal cancer screening in England: evidence from the English Longitudinal Study of Ageing. Prev Med 2014;61:100-5.
33. Lee YY, Jun JK, Suh M, Park BY, Kim Y, Choi KS. Barriers to cancer screening among medical aid program recipients in the Republic of Korea: a qualitative study. Asian Pac J Cancer Prev 2014;15:589-94.
34. Kim S, Hwang J. Assessment of trends in socioeconomic inequali- ties in cancer screening services in Korea, 1998-2012. Int J Equity Health 2016;15:30.
35. Caplan LS, McQueen DV, Qualters JR, Leff M, Garrett C, Calonge N. Validity of women’s self-reports of cancer screening test utiliza- tion in a managed care population. Cancer Epidemiol Biomarkers Prev 2003;12(11 Pt 1):1182-7.
36. Hoffmeister M, Chang-Claude J, Brenner H. Validity of self-report- ed endoscopies of the large bowel and implications for estimates of colorectal cancer risk. Am J Epidemiol 2007;166:130-6.