INTRODUCTION
Prostate cancer (Pca) is one of the most frequent cancers in men worldwide.1 The incidence of Pca is consistently increas- ing with aging societies. Pca has been the most frequent uro- logical cancer since 2004. The number of patients who are di-
agnosed with Pca has remained greater than the sum of patients who are diagnosed with bladder and renal cancers since 2008.2 Moreover, the mortality of Pca has sharply increased about 12 times, as of 2002, compared to 1983. Pca is the most rapidly increasing cancer among all cancers in South Korea.3,4
The social burden of Pca, including medical cost, has in- creased consistently. This is associated with the increasing prevalence of Pca due to not only the increased incidence of Pca, but also due to an increased survival rate among Pca pa- tients.5 In the United States, the cost burden of Pca treatment was estimated to be 10 billion dollars in 2006. In Japan, it was 174.5 billion yen in 2002. The cost is expected to be much higher in 2020.6,7
Compared to other treatments, radical prostatectomy (RP) is chosen more for younger and less morbid patients who are less likely to have peri-operative or post-operative complications than for older patients.8 However, about 80% of Pca patients
Trends in Prostate Cancer Prevalence and Radical Prostatectomy Rate according to Age Structural Changes in South Korea between 2005 and 2015
Hyun Young Lee
1, Suyeon Park
2, Seung Whan Doo
1, Won Jae Yang
1, Yun Seob Song
1, and Jae Heon Kim
11Department of Urology, Soonchunhyang University Seoul Hospital, Soonchunhyang University Medical College, Seoul;
2Department of Biostatistics, Soonchunhyang University Seoul Hospital, Seoul, Korea.
Purpose: Radical prostatectomy (RP) is one of main treatments for prostate cancer (Pca). The prevalence of Pca has been de- creasing in recent reports. However, no study has reported trends in Pca prevalence or RP rate according to age structural chang- es. The objective of this study was to investigate trends in Pca prevalence and frequency of RP according to age structural change.
Materials and Methods: We evaluated trends in Pca prevalence and RP rate using National Health Insurance Data from 2005 to 2015. Relationships for Pca prevalence and RP rate with age structural change were also determined. Primary outcomes included trends in Pca prevalence and RP rates according to age groups, comparing those before and after 2011.
Results: Pca prevalence tended to increase before 2011 and decreased after 2011 in persons in the 60-years age group. RP rate in- creased pattern before 2011 and decreased after 2011 in age groups of 50s, 60s, and over 70s. Pca prevalence and age structural change showed a significantly positive relationship in all age groups, except for the age group under 40 years. RP rate and age structural change also showed a significantly positive relationship in all age groups.
Conclusion: Age structural change can affect the decreasing trend in Pca prevalence and RP rate in South Korea. Future studies are needed to validate this result.
Key Words: Prostate cancer, prostatectomy, prevalence
pISSN: 0513-5796 · eISSN: 1976-2437
Received: November 22, 2018 Revised: January 22, 2019 Accepted: January 24, 2019
Corresponding author: Jae Heon Kim, MD, PhD, Department of Urology, Soonc- hunhyang University Seoul Hospital, Soonchunhyang University College of Medi- cine, 59 Daesagwan-ro, Yongsan-gu, Seoul 04401, Korea.
Tel: 82-2-709-9375, Fax: 82-2-795-3687, E-mail: [email protected]
•The authors have no potential conflicts of interest to disclose.
© Copyright: Yonsei University College of Medicine 2019
This is an Open Access article distributed under the terms of the Creative Com- mons Attribution Non-Commercial License (https://creativecommons.org/licenses/
by-nc/4.0) which permits unrestricted non-commercial use, distribution, and repro- duction in any medium, provided the original work is properly cited.
Yonsei Med J 2019 Mar;60(3):257-266 https://doi.org/10.3349/ymj.2019.60.3.257
are over 65 years of age. Age at diagnosis of Pca has increased consistently over the last 10 years.9,10 This phenomenon could be explained by age structural change and decreased Pca screen- ing test. Recent evidence suggests that patients are undergoing RP at a higher age than before. However, RP rate are decreas- ing compared to rates for other treatments, including watchful waiting, active surveillance, radiation therapy, and hormone therapy.11,12 This phenomenon could be more prominent in South Korea, considering that this country has the highest speed of age structural change and a relatively high proportion of RP, compared to the United States, which has other treat- ment options. Thus, determining the trend of Pca prevalence according to age structural change is important for estimating the future disease burden of Pca.12,13
To date, there are no standard guidelines for screening for Pca, including performance of prostate-specific antigen (PSA), in South Korea. Regarding the performance of prostate biop- sy, indicated criteria include more than 5 years of remnant life expectancy and patients with symptoms.14
South Korea is now facing the issue of an aging society. It has the lowest fertility rate among all Organization for Eco- nomic Cooperation and Development (OECD) countries. The proportion of South Korea’s population over 65 years was more than 10% in 2008 and 15% in 2015. It is expected to in- crease to about 30% by 2030.15,16
Because healthcare budgets are limited, it is important to allocate the budget in consideration of the balanced benefit of healthcare. If there is a decreasing trend for RP in Pca and if the possible phenomenon could be explained by aging changes, medical and healthcare funding can be distributed appropri- ately, and other treatments, such as watchful waiting, active surveillance, radiation therapy, and hormone therapy, should be considered.
Our previous study revealed that age structural changes can affect the performance of urologic diagnostic tools.17 Consid- ering an increasing socioeconomic burden due to an increased prevalence of Pca and the lack of studies on age structural chang- es in Pca patients, the objective of this study was to investigate trends in Pca prevalence and frequency of surgical treatment according to age structural change using National Health In- surance Data covering 99% of all South Korean men.
MATERIALS AND METHODS
Data collection
Annual reports of cancer statistics from National Health Insur- ance Service (NHIS) of South Korea between 2005 and 2015 were used. The National Health Insurance (NHI) program in South Korea was started in 1970s; this program came to offer universal health care in 1989. The NHIS covers 99% of all South Koreans and provides information about the number of pa- tients with each type of cancer registered in NHI, including
age, gender, diagnosis, medical procedures, and so on.17 Pca (C61) was coded according to the Korean standard classifica- tion of disease and cause of death, 6th edition (KCD-6). We collected the number of males in South Korea from 2005 to 2015 from the Korean Statistical Information Service (KOSIS).
The KOSIS collects economic, social, and medical statistics for South Korea. Among patients who had a code of C61 from 2005 to 2015, we selected patients who had received primary treat- ment for Pca, such as surgical treatment. This work was ap- proved by the Institutional Review Board of Soonchunhyang University Seoul Hospital (SCHUH 2018-12-020).
Surgical treatment included radical prostatectomy, such as retropubic RP, perineal RP, laparoscopic RP, and robot-assist- ed laparoscopic prostatectomy (RALP). Reimbursement codes of RP in NHIS were R3950, R3960, and RZ512. RALP had no code because it was not reimbursed by NHIS. An alternative defining method was used to detect RALP using codes of gen- eral anesthesia (L1211) and postoperative pathologic examina- tion (C5500, C5501, C5502, C5503, C5504, C5505, C5506, C5507, C5508, C5509, C5911, C5912, C5913, C5914, C5915, C5916, C5917, C5918, C5919).18
Measurement outcomes
The primary outcomes of this study were the following two re- lationships: 1) between annual Pca prevalence and age struc- tural change, and 2) between annual trend in operation rate and age structural change. To investigate these two outcomes, cumulative age-standardized prevalence rates per year ac- cording to age groups, cumulative age-standardized opera- tion rates per year according to age groups, age-standardized operation rates/patients per year according to age groups, cor- relation between Pca patient rates per year and percentage of population, correlation between operation rates per year and percentage of population, and correlation between operations/
patients rates per year and percentage of population were mea- sured. We subdivided age into the following groups: less than 40 years old, 40s, 50s, 60s, and over 70 years old. We described all outcomes as rates standardized as per 100000 males using real general population of the relevant year.
Data analysis
The total number of males per year was calculated for each age group in South Korea using data of National Statistical Of- fice. The total number of Pca patients and total number of op- erations per year according to age groups were calculated based on diagnosis codes. Cumulative patient and operation rates according to year were analyzed. Cumulative age-stan- dardized patients and operations according to year and age groups were also analyzed. For analysis, generalized linear models were used. Results are displayed as estimates with stan- dard errors and were plotted as a line graph. Analysis was per- formed for cumulative age-standardized patient rates per 100000 people, operation rates per 100000 people, and opera-
tion/patient rates according to year and age groups. Piecewise linear regression model was used to compare trends before and after 2011. Analysis was performed for correlation coeffi- cients between patient rates and percentage of population, between operation rates and percentage of population, and between operation rates/patient rates and percentage of pop- ulation per year. Statistically significant differences were con- sidered when p was less than 0.05. All data were analyzed us- ing R software (v3.1.2; R Foundation, Vienna, Austria).
RESULTS
Annual trends in prevalence, operation rate, and operation rate/patient rates
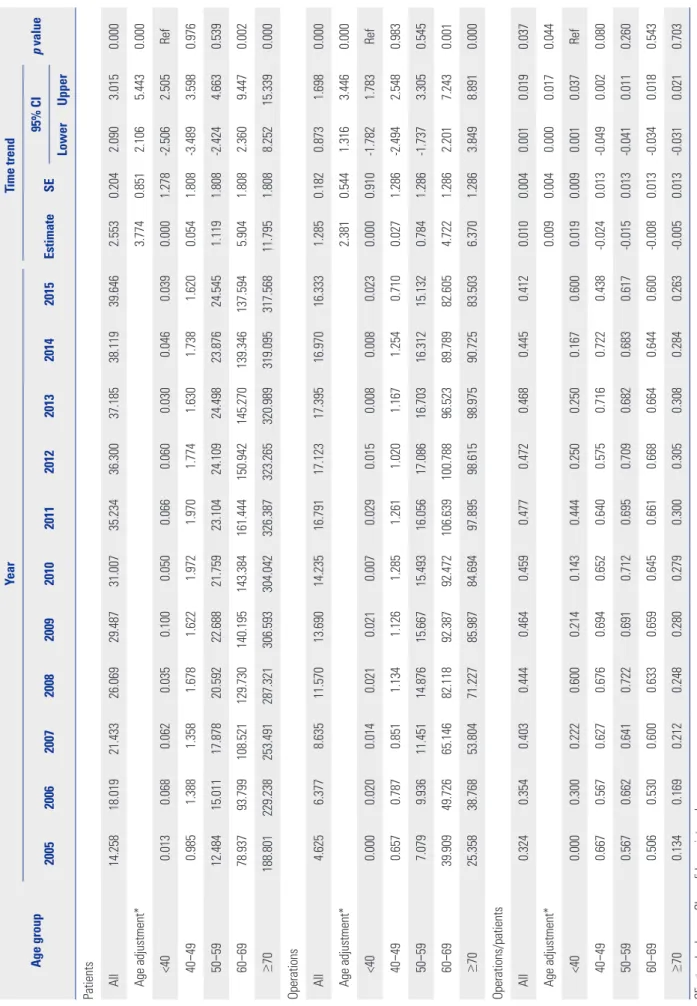
Table 1 shows the trend test results for Pca patients, opera- tions, and operations/patients of all Pca patients after age ad- justment according to age groups. Overall trends in patients and operations showed increases over the study period (β=
2.553, p=0.000; and β=1.285, p=0.000, respectively). However, the overall trend in operations/patients nearly did not change (β=0.01, p=0.037). Remarkably, trends in patients in the age groups of 60 and over 70 years showed increasing patterns in the study period (β=5.904, p=0.002; and β=11.795, p=0.000, re- spectively). Trends in operations in the 60s and over 70s age groups also showed increasing patterns (β=4.722, p=0.001;
and β=6.37, p=0.000, respectively). However, trends in opera- tions/patients in age groups of 60s and over 70s showed statis- tically insignificant patterns (β=-0.008, p=0.543; and β=-0.005, p=0.703, respectively). Table 2 shows piecewise linear regres- sion results of Pca patients in the overall population according to age grouping and trend test results before and after 2011.
Trends in Pca patients followed an increasing pattern before 2011 and a decreasing pattern after 2011 in the 60s age group (β=13.789, p=0.000 before 2011; and β=-5.929, p=0.000 after 2011). Table 3 shows the results of piecewise linear regression of operations in the overall population according to age groups.
Trends in operations also had an increasing pattern before 2011 and a decreasing pattern after 2011 in the age groups of 50s, 60s, and over 70s (β=1.772, p=0.000 before 2011 and β=
-0.728, p=0.040 after 2011 in 50s; β=11.65, p=0.000 before 2011 and β=-5.907, p=0.000 after 2011 in 60s; β=13.022, p=0.000 be- fore 2011 and β=-3.667, p=0.022 after 2011 in over 70s). Table 4 shows the results of piecewise linear regression of opera- tions/patients in the overall population according to age groups. Trends in operations/patients followed an increasing pattern before 2011 and a decreasing pattern after 2011 in age groups of 50s, 60s, and over 70s (β=0.025, p=0.007 before 2011 and β=-0.029, p=0.010 after 2011 in 50s; β=0.031, p=0.000 be- fore 2011 and β=-0.025, p=0.002 after 2011 in 60s; β=0.031, p=
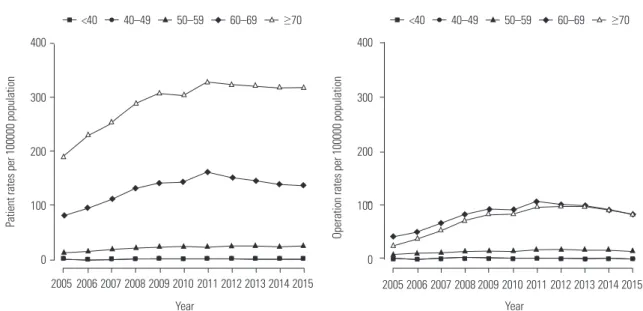
0.000 before 2011 and β=-0.018, p=0.000 after 2011 in over 70s). Fig. 1 shows patient rates and operation rates per 100000 people per year. Both showed increasing patterns during the
study period. However, the increasing speed decreased after 2011. Fig. 2 shows cumulative age-standardized prevalence rates and operation rates per year according to age groups. The rates exhibited a plateau pattern that peaked in 2011, showing a decreasing pattern in age groups of 60s and over 70s. Fig. 3 shows age-standardized operation rates/patients per year ac- cording to age groups. These rates also had a plateau pattern.
They increased until 2009 (46%), with a similar portion until 2013, and decreased (41%) in 2015.
Relationships between trends in Pca prevalence, operation rates, or operation rates/prevalence and age structural changes per year
Fig. 4 shows the relationships between patient rates and per- centage of population per year according to age groups. The red line represents trends in patient rates per year, while the black line represents trends in the percentage of population.
Patient rate and percentage of population of each age group had a positive relationship (r=0.79, p=0.004 in 40s; r=0.915, p=
0.000 in 50s; r=0.633, p=0.037 in 60s; r=0.845, p=0.001 in over 70s) except for the age group of under 40 years (r=0.044, p=
0.897). Fig. 5 shows the relationship between operation rate and percentage of population per year according to age groups.
The red line represents the trend in operation rate per year, while the black line represents the trend in percentage of pop- ulation. The operation rate of Pca and percentage of popula- tion of each age group also had a positive relationship (r=
0.935, p=0.000 in 40s; r=0.837, p=0.001 in 50s; r=0.582, p=0.050 in 60s; and r=0.825, p=0.002 in over 70s) except for the age group of under 40 (r=-0.142, p=0.677). Fig. 6 shows the rela- tionship between operation rates/patients and the percentage of population per year according to age groups. The red line represents the trend of operation rates/patients per year, while the black line represents the trend of percentage of popula- tion. Operation rates/patients and percentage of population per year had no significant relationship (r=-0.316, p=0.343 in under 40 years; r=0.529, p=0.094 in 40s; r=0.339, p=0.307 in 50s; r=0.489, p=0.125 in 60s), except for the age group of over 70 years (r=0.788, p=0.004).
DISCUSSION
This is the first study to investigate trends in the prevalence of Pca and operation rates according to age structural change.
Investigating such trends is an important issue because South Korea has become an aged society. This study provides useful evidence with which to predict future medical costs of Pca treatment. We had two main hypotheses: 1) Pca prevalence and surgical treatment rate would be affected by age structur- al changes; 2) considering rapid decreases in younger indi- viduals, surgical treatment rates would decrease without showing correlations with the increasing age of the popula-
Table 1. Trend Test for Pca Patients, Operations, and Operations/Patients for All Pca Patients after Age Adjustment in Age Group Age group
YearTime trend p value 20052006200720082009201020112012201320142015EstimateSE95% CI LowerUpper Patients All14.25818.01921.43326.06929.48731.00735.23436.30037.18538.11939.6462.5530.2042.0903.0150.000 Age adjustment*3.7740.8512.1065.4430.000 <400.0130.0680.0620.0350.1000.0500.0660.0600.0300.0460.0390.0001.278-2.5062.505Ref 40–490.9851.3881.3581.6781.6221.9721.9701.7741.6301.7381.6200.0541.808-3.4893.5980.976 50–5912.48415.01117.87820.59222.68821.75923.10424.10924.49823.87624.5451.1191.808-2.4244.6630.539 60–6978.93793.799108.521129.730140.195143.384161.444150.942145.270139.346137.5945.9041.8082.3609.4470.002 ≥70188.801229.238253.491287.321306.593304.042326.387323.265320.989319.095317.56811.7951.8088.25215.3390.000 Operations All4.6256.3778.63511.57013.69014.23516.79117.12317.39516.97016.3331.2850.1820.8731.6980.000 Age adjustment*2.3810.5441.3163.4460.000 <400.0000.0200.0140.0210.0210.0070.0290.0150.0080.0080.0230.0000.910-1.7821.783Ref 40–490.6570.7870.8511.1341.1261.2851.2611.0201.1671.2540.7100.0271.286-2.4942.5480.983 50–597.0799.93611.45114.87615.66715.49316.05617.08616.70316.31215.1320.7841.286-1.7373.3050.545 60–6939.90949.72665.14682.11892.38792.472106.639100.78896.52389.78982.6054.7221.2862.2017.2430.001 ≥7025.35838.76853.80471.22785.98784.69497.89598.61598.97590.72583.5036.3701.2863.8498.8910.000 Operations/patients All0.3240.3540.4030.4440.4640.4590.4770.4720.4680.4450.4120.0100.0040.0010.0190.037 Age adjustment*0.0090.0040.0000.0170.044 <400.0000.3000.2220.6000.2140.1430.4440.2500.2500.1670.6000.0190.0090.0010.037Ref 40–490.6670.5670.6270.6760.6940.6520.6400.5750.7160.7220.438-0.0240.013-0.0490.0020.080 50–590.5670.6620.6410.7220.6910.7120.6950.7090.6820.6830.617-0.0150.013-0.0410.0110.260 60–690.5060.5300.6000.6330.6590.6450.6610.6680.6640.6440.600-0.0080.013-0.0340.0180.543 ≥700.1340.1690.2120.2480.2800.2790.3000.3050.3080.2840.263-0.0050.013-0.0310.0210.703
SE, standard error; CI, confidence interval. *p value adjusted by age group.
tion. Hence, we used prevalence of Pca and age-specific oper- ation rates of Pca. Prevalence was used as an indicator of real demand for Pca treatment, because it reflects the changing status of treatment patterns. Thus, it would be affected by re- cent age structural changes.
Due to the absence of standard guidelines for screening of Pca, the performance of PSA is generally done during a general health checkup or during an initial evaluation of benign pros- tatic hyperplasia. Considering the continuously rising phe- nomenon of Pca specific mortality in South Korea, the cost- effectiveness of Pca screening has to be refocused again.19
In the United States, over one-third of all patients who un- derwent operation treatment were patients aged over 65
years. Over half of the patients who underwent RP were aged over 65 years in 2007.20,21 According to demographic changes in an aging society, this trend will become of greater importance in future health care.
Due to age structural changes and decreased opportunities for screening tests for Pca, age at diagnosis has increased. Re- portedly, patients underwent RP at a higher age than before, resulting in a decreasing portion of surgical treatments.11 Pca in South Korea had shown an increasing trend until 2011. Af- ter 2011, its increasing speed slowed. Song and Jeon2 have re- ported that the incidence of Pca rapidly increased in the age group of 55–59 years, showing a peak increasing rate in the age group of 70–74 years from 1999 to 2010. Considering South Korea is becoming an aging society at a high rate, older age groups could have a higher prevalence rate than relatively younger age groups. In our results, the prevalence of Pca in- Table 2. Piecewise Linear Regression of Pca Patients in the Overall
Population and Age Groups
Year Trend test
beta SE p value*
Overall <2011 8.017 12.488 0.524
≥2011 -1.585 16.520 0.924
Age group
<40 <2011 0.007 0.006 0.239
≥2011 -0.007 0.007 0.366
40–49 <2011 0.170 0.027 0.000
≥2011 -0.073 0.035 0.037
50–59 <2011 2.060 0.249 0.000
≥2011 0.265 0.329 0.421
60–69 <2011 13.789 1.072 0.000
≥2011 -5.929 1.419 0.000
≥70 <2011 24.060 2.508 0.000
≥2011 -2.181 3.318 0.511
SE, standard error.
*p value by piecewise linear regression and adjusted by age group.
Table 3. Piecewise Linear Regression of Operations in the Overall Population and Age Groups
Year Trend test
beta SE p value*
Overall <2011 5.318 4.209 0.212
≥2011 -1.985 5.569 0.721
Age group
<40 <2011 0.001 0.002 0.597
≥2011 -0.002 0.003 0.547
40–49 <2011 0.127 0.035 0.008
≥2011 -0.087 0.046 0.061
50–59 <2011 1.772 0.216 0.000
≥2011 -0.728 0.354 0.040
60–69 <2011 11.650 0.990 0.000
≥2011 -5.907 1.309 0.000
≥70 <2011 13.022 1.214 0.000
≥2011 -3.667 1.606 0.022
SE, standard error.
*p value by piecewise linear regression and adjusted by age group.
Table 4. Piecewise Linear Regression of Operations/Patients in the Overall Population and Age Groups
Year Trend test
beta SE p value*
Overall <2011 0.025 0.022 0.280
≥2011 -0.009 0.030 0.762
Age group
<40 <2011 0.014 0.049 0.781
≥2011 0.046 0.081 0.568
40–49 <2011 0.011 0.021 0.616
≥2011 -0.037 0.034 0.285
50–59 <2011 0.025 0.007 0.007
≥2011 -0.029 0.011 0.010
60–69 <2011 0.031 0.005 0.000
≥2011 -0.025 0.008 0.002
≥70 <2011 0.031 0.003 0.000
≥2011 -0.018 0.005 0.000
SE, standard error.
*p value by piecewise linear regression and adjusted by age group.
Fig. 1. Prevalence and operation rates of prostate cancer per year per 100000 people.
50
40
30
20
10
0
2005 2006 2007 2008 2009 2010 2011 2012 2013 2014 2015 Year
Rates per 100000 people 14.26
4.62 6.38
8.63 11.57 13.69 14.2416.79 17.12 17.39 16.97 16.33 18.0221.43
26.07 29.49 31.01
35.23 36.3 37.18 38.1239.65 Patient rates per 100000 people
Operation rates per 100000 people
creased until 2014, but decreased in 2015, while surgical treat- ments increased until 2013, but decreased from 2014. Unless Pca detection rates decreased, this meant that Pca patients chose other treatment options, such as watchful waiting, ac- tive surveillance, radiation therapy, and hormone therapy.
Because Pca incidence was not decreased and Pca mortality was slightly increased in South Korea, the stabilization or de- crease in Pca prevalence could be explained by a decrease in the utilization rate of medical services.22,23
Chen, et al.12 have studied national trends in Pca in the Unit- ed States from 2004 to 2013, a study period similar to ours. Re- garding operation rates, there were also about 35% of Pca pa- tients who were treated by operation, showing a peak operation
rate of 40% in 2007.12 The operation rate then began to de- crease from 2013.12 Their study showed similar findings to our study in that the number of Pca patients increased with higher age at diagnosis, while the number of Pca patients who chose surgical treatment for Pca decreased with higher age at diagno- sis.12 They concluded that the trend was that younger patients had more proper surgical treatment, while older patients sought non-surgical treatment, although surgical technique had improved.
The decreasing Pca prevalence might reflect several possi- bilities. First, the number of screening tests performed for Pca decreased. In South Korea, almost 15% of all male South Ko- reans over 50 years old undergo PSA screening, compared to 75% of all males in the United States. Additionally, in 2011, the USPSTF recommended restrict routine screening test for Pca using PSA, because it might cause over-diagnosis and over- treatment.24 Many urologists might be influenced by this rec- ommendation, especially when they treat older patients. Sec- ond, medical utilization rates decreased among older patients due to various reasons, including financial dependence on their supporters. Failure to maintain financial independence in older adults can cause a reduction in individual medical ex- penditures and eventually decrease medical utilization rates.25 The decreasing trend in RP could be explained by patient pref- erence for safer and more convenient treatment strategies, in- cluding watchful waiting, active surveillance, radiation thera- py, and hormone therapy over surgical therapy.26,27
Tamada, et al.27 have reported that treatment outcomes are similar between radiation therapy and surgical treatment.
They compared the two using overall survival, cancer-specific survival, and biochemical failure-free survival. Cancer-specif- ic survival was similar between the two groups, although sur- gical treatment was superior to radiation therapy in overall survival. Otherwise, radiation therapy was superior to surgical treatment in biochemical failure-free survival. Post-treatment Fig. 2. Cumulative age-standardized patient rates and operation rates per year by age group.
Fig. 3. Age-standardized operation rates/patients per year by age group.
400
300
200
100
0
400
300
200
100
0
Patient rates per 100000 population Operation rates per 100000 population
2005 2006 2007 2008 2009 2010 2011 2012 2013 2014 2015 2005 2006 2007 2008 2009 2010 2011 2012 2013 2014 2015
Year Year
<40 40–49 50–59 60–69 ≥70 <40 40–49 50–59 60–69 ≥70
1.0
0.8
0.6
0.4
0.2
0.0
Operation rate per patients
2005 2006 2007 2008 2009 2010 2011 2012 2013 2014 2015 Year
<40 40–49 50–59 60–69 ≥70
complications, including urinary incontinence and erectile dysfunction, occurred less in the radiation therapy group than in the surgical treatment group both in the short and long term.27 Considering the relatively long survival of Pca patients after treatment of Pca and the quality of life in Pca patients, fewer complications are crucial. When new Pca patients de- cide the type of treatment, they might choose one that has less peri-operative and post-operative complications.28,29
Pca patients tend to decide to undergo other treatment op- tions, including radiation therapy and active surveillance due to their similar oncologic results, with less or no risk, because morbidity increases with complications of general anesthesia or a huge operation.30 Hamdy, et al.31 reported that the metas- tasis and progression rates of Pca are higher in active surveil- lance groups than in RP and radiotherapy groups, although mortality rates are not significantly different among these
groups. Wilt, et al.30 also reported that there is no significant difference in all-cause or Pca mortality between surgical treat- ment and active surveillance groups of localized Pca patients with over 10 years of follow up; meanwhile, surgical treatment elicited higher adverse events than active surveillance.30,31 Nevertheless, active surveillance is rarely used in South Korea, because the portion of localized Pca is 54%, compared to 82%
in the US.29 Pathological results for half of Pca patients who were treated by surgical treatment showed aggravated fea- tures, compared to prostate biopsy pathology results in South Korea.32 Surgical treatment including RP comprised a higher portion (60%) of total Pca treatment in South Korea from 2000 to 2010 than (35%) in the US from 2004 to 2013.12,13
In our study, Pca prevalence and surgical treatment includ- ing RP showed a decreasing trend due to age structural change, because South Korea has become an aging society. Based on 320
300 280 260 240 220 200 24 22 20 18 16 14 0.10 0.08 0.06 0.04 0.02
160 140 120 100 80 2.0 1.8 1.6 1.4 1.2 1.0
7.0 6.5 6.0 5.5 5.0 4.5 4.0 16 15 14 13 12 11 60 58 56 54 52 50
9.5 9.0 8.5 8.0 7.5 7.0 17.8
17.7
17.6
17.5
2006 2008 2010 2012 2014
2006 2008 2010 2012 2014
2006 2008 2010 2012 2014
2006 2008 2010 2012 2014
2006 2008 2010 2012 2014
Age (≥70) Age (50–59)
Age (<40)
Age (60–69) Age (40–49)
Year Year Year
Year Year
Patient rates per 100000 peoplePatient rates per 100000 peoplePatient rates per 100000 people Patient rates per 100000 peoplePatient rates per 100000 people
Percentage of populationPercentage of populationPercentage of population Percentage of populationPercentage of population
Patient rates per 100000 people Percentage of population r=0.845, p=0.001
Patient rates per 100000 people Percentage of population r=0.915, p=0.000
Patient rates per 100000 people Percentage of population r=0.044, p=0.897
Patient rates per 100000 people Percentage of population r=0.633, p=0.037
Patient rates per 100000 people Percentage of population r=0.79, p=0.004
Fig. 4. Correlation between patient rates and percentage of population per year by age group.
our study results, we need guidelines for Pca screening and treatment considering South Korea has the fastest age struc- tural change speed among OECD countries. More advanced studies are needed to verify our results.
Androgen deprivation therapy (ADT) was first introduced for Pca treatment in 1942. ADT can be used as an adjuvant therapy or combine therapy for advanced Pca. Even if it has no benefit for localized Pca, it can improve cancer-free survival and over- all survival in advanced Pca. Considering this advantage of ADT, it should be used more for high-risk patients in the future.33
This study has several limitations. First, there was no statis- tical indicator of Pca incidence. Therefore, we could not dif- ferentiate patients who were newly diagnosed and those who were previously diagnosed. However, prevalence is more im- portant than incidence itself because prevalence can reflect the real medical utilization rate and predict socioeconomic
burden of Pca treatment and post-treatment. Second, there was no statistical information on other treatment options, includ- ing watchful waiting, active surveillance, radiation therapy, or hormone therapy. Our study was based on NHIS data that had no definite information on other treatments. The most difficult point that could be raised with using National Health Claim Data was that we could not define cases undergoing ro- botic surgeries. However, unlike other cancers, there is a vali- dated method for identifying cases for robotic-assisted laparo- scopic surgery for Pca.18 In South Korea, national health insurance covers Pca treatments, except stereotactic body ra- diation and robotic surgery. It covered 22.4% of all cancer pa- tients in 2011; private insurance covered Pca treatments, in- cluding stereotactic body radiation and robotic surgery.34 Our previous study reported that radiation therapy for Pca, includ- ing stereotactic body radiation, had continuously increased 100
80
60
40 16 14 12 10 8 0.030 0.025 0.020 0.015 0.010 0.005 0.000
100 90 80 70 60 50 40 1.3 1.2 1.1 1.0 0.9 0.8 0.7
7.0 6.5 6.0 5.5 5.0 4.5 4.0 16 15 14 13 12 11 60 58 56 54 52 50
9.5 9.0 8.5 8.0 7.5 7.0 17.8
17.7
17.6
17.5
2006 2008 2010 2012 2014
2006 2008 2010 2012 2014
2006 2008 2010 2012 2014
2006 2008 2010 2012 2014
2006 2008 2010 2012 2014
Age (≥70) Age (50–59)
Age (<40)
Age (60–69) Age (40–49)
Year Year Year
Year Year
Patient rates per 100000 peoplePatient rates per 100000 peoplePatient rates per 100000 people Patient rates per 100000 peoplePatient rates per 100000 people
Percentage of populationPercentage of populationPercentage of population Percentage of populationPercentage of population
Patient rates per 100000 people Percentage of population r=0.825, p=0.002
Patient rates per 100000 people Percentage of population r=0.837, p=0.001
Patient rates per 100000 people Percentage of population r=-0.142, p=0.677
Patient rates per 100000 people Percentage of population r=0.582, p=0.050
Patient rates per 100000 people Percentage of population r=0.935, p=0.000
Fig. 5. Correlation between operation rates and percentage of population per year by age group.
from 2005 to 2014. Considering these two factors, economic burden did not affect the choice of Pca treatment.35
This study revealed age structural change to be a unique fea- ture of South Korea that could affect trends in the prevalence and surgical treatment rate of Pca, both of which were predict- ed to follow a decreasing trend according to age structural change. Future studies are needed to investigate underlying causes of the decreasing prevalence of Pca and surgical treat- ment rates for Pca. Possible socioeconomic and cultural fac- tors affecting patient preferences for specific treatment op- tions also need to be determined in the future.
ACKNOWLEDGEMENTS
This work was supported by the Soonchunhyang University Research Fund.
AUTHOR CONTRIBUTIONS
Conceptualization: Jae Heon Kim. Data curation: Hyun Young Lee, Suyeon Park. Formal analysis: Suyeon Park. Funding acquisition: Jae Heon Kim. Methodology: Jae Heon Kim. Supervision: Won Jae Yang, Yun Seob Song. Writing—original draft: Hyun Young Lee, Jae Heon Kim. Writing—review & editing: All authors.
ORCID iDs
Hyun Young Lee https://orcid.org/0000-0002-6706-3554 Suyeon Park https://orcid.org/0000-0002-6391-557X Seung Whan Doo https://orcid.org/0000-0002-5924-6908 Won Jae Yang https://orcid.org/0000-0002-7356-4312 Yun Seob Song https://orcid.org/0000-0002-0909-3341 Jae Heon Kim https://orcid.org/0000-0002-4490-3610 1.0
0.8 0.6 0.4 0.2 0.0 1.0 0.8 0.6 0.4 0.2 0.0 1.0 0.8 0.6 0.4 0.2 0.0
1.0 0.8 0.6 0.4 0.2 0.0 1.0 0.8 0.6 0.4 0.2 0.0
7.0 6.5 6.0 5.5 5.0 4.5 4.0 16 15 14 13 12 11 60 58 56 54 52 50
9.5 9.0 8.5 8.0 7.5 7.0 17.8
17.7
17.6
17.5
2006 2008 2010 2012 2014
2006 2008 2010 2012 2014
2006 2008 2010 2012 2014
2006 2008 2010 2012 2014
2006 2008 2010 2012 2014
Age (≥70) Age (50–59)
Age (<40)
Age (60–69) Age (40–49)
Year Year Year
Year Year
Operation rate per patientsOperation rate per patientsOperation rate per patients Operation rate per patientsOperation rate per patients
Percentage of populationPercentage of populationPercentage of population Percentage of populationPercentage of population
Operation rate per patients Percentage of population r=0.788, p=0.004
Operation rate per patients Percentage of population r=0.339, p=0.307
Operation rate per patients Percentage of population r=-0.316, p=0.343
Operation rate per patients Percentage of population r=0.489, p=0.125
Operation rate per patients Percentage of population r=0.529, p=0.094
Fig. 6. Correlation between operation rates/patients and percentage of population per year by age group.
REFERENCES
1. Center MM, Jemal A, Lortet-Tieulent J, Ward E, Ferlay J, Brawley O, et al. International variation in prostate cancer incidence and mortality rates. Eur Urol 2012;61:1079-92.
2. Song W, Jeon HG. Incidence of kidney, bladder, and prostate can- cers in Korea: an update. Korean J Urol 2015;56:422-8.
3. Park SK, Sakoda LC, Kang D, Chokkalingam AP, Lee E, Shin HR, et al. Rising prostate cancer rates in South Korea. Prostate 2006;66:
1285-91.
4. Lim D, Ha M, Song I. Trends in major cancer mortality in Korea, 1983-2012, with a joinpoint analysis. Cancer Epidemiol 2015;39:
939-46.
5. Sammon JD, Abdollah F, D’Amico A, Gettman M, Haese A, Suardi N, et al. Predicting life expectancy in men diagnosed with pros- tate cancer. Eur Urol 2015;68:756-65.
6. Kitazawa T, Matsumoto K, Fujita S, Seto K, Hanaoka S, Hasegawa T. Cost of illness of the prostate cancer in Japan--a time-trend analysis and future projections. BMC Health Serv Res 2015;15:453.
7. Roehrborn CG, Black LK. The economic burden of prostate can- cer. BJU Int 2011;108:806-13.
8. Mistry PK, Gaunay GS, Hoenig DM. Prediction of surgical com- plications in the elderly: can we improve outcomes? Asian J Urol 2017;4:44-9.
9. Barocas DA, Alvarez J, Resnick MJ, Koyama T, Hoffman KE, Tyson MD, et al. Association between radiation therapy, surgery, or ob- servation for localized prostate cancer and patient-reported out- comes after 3 years. JAMA 2017;317:1126-40.
10. Daniyal M, Siddiqui ZA, Akram M, Asif HM, Sultana S, Khan A.
Epidemiology, etiology, diagnosis and treatment of prostate can- cer. Asian Pac J Cancer Prev 2014;15:9575-8.
11. Ahlering T, Huynh LM, Kaler KS, Williams S, Osann K, Joseph J, et al. Unintended consequences of decreased PSA-based prostate cancer screening. World J Urol 2018 Jul 12 [Epub]. Available at:
https://doi.org/10.1007/s00345-018-2407-3.
12. Chen J, Oromendia C, Halpern JA, Ballman KV. National trends in management of localized prostate cancer: a population based analysis 2004-2013. Prostate 2018;78:512-20.
13. Ahn H, Kim HJ, Jeon SS, Kwak C, Sung GT, Kwon TG, et al. Estab- lishment of Korean prostate cancer database by the Korean Uro- logical Oncology Society. Investig Clin Urol 2017;58:434-9.
14. The Korean Urological Association, The Korean Urologocal On- cology Society. Korean clinical practice guideline for the treat- ment of prostate cancer [accessed on 2018 September 30]. Avail- able at: http://www.urology.or.kr/mail/file/180912_2.pdf.
15. Lee EY, Kim HC, Rhee Y, Youm Y, Kim KM, Lee JM, et al. The Ko- rean urban rural elderly cohort study: study design and protocol.
BMC Geriatr 2014;14:33.
16. OECD. The percentage of elderly population in South Korea [ac- cessed on 2019 January 1]. Avilable at: https://data.oecd.org/
pop/elderly-population.htm.
17. Baek MJ, Park S, Kim KH, Kim YH, Kim WK, Sun HY, et al. National trend of uroflowmetry, urodynamic study and cystoscopy consid- ering the change in the population structure in Korea from 2010 to 2015. J Korean Med Sci 2018;33:e145.
18. Park J, Suh B, Shin DW, Hong JH, Ahn H. Changing patterns of
primary treatment in Korean men with prostate cancer over 10 years: a nationwide population based study. Cancer Res Treat 2016;48:899-906.
19. Ahn HS. Overdiagnosis in health care: impact of cancer screen- ing. J Korean Med Assoc 2017;60:323-9.
20. Townsend NT, Robinson TN. Surgical risk and comorbidity in older urologic patients. Clin Geriatr Med 2015;31:591-601.
21. Hall MJ, DeFrances CJ, Williams SN, Golosinskiy A, Schwartzman A. National hospital discharge survey: 2007 summary. National Health Statistics Reports; no 29. Hyattsville (MD): National Center for Health Statistics; 2010.
22. Kweon SS. Updates on cancer epidemiology in Korea, 2018.
Chonnam Med J 2018;54:90-100.
23. Kim JH, Kim SY, Yun SJ, Chung JI, Choi H, Yu HS, et al. Medical travel among non-Seoul residents to seek prostate cancer treat- ment in medical facilities of Seoul. Cancer Res Treat 2019;51:53-64.
24. Hoffman RM, Meisner AL, Arap W, Barry M, Shah SK, Zeliadt SB, et al. Trends in United States prostate cancer incidence rates by age and stage, 1995-2012. Cancer Epidemiol Biomarkers Prev 2016;25:
259-63.
25. Mathieson KM, Kronenfeld JJ, Keith VM. Maintaining functional independence in elderly adults: the roles of health status and fi- nancial resources in predicting home modifications and use of mobility equipment. Gerontologist 2002;42:24-31.
26. Wolff RF, Ryder S, Bossi A, Briganti A, Crook J, Henry A, et al. A systematic review of randomised controlled trials of radiotherapy for localised prostate cancer. Eur J Cancer 2015;51:2345-67.
27. Tamada S, Ninomiya N, Kitamoto K, Kato M, Yamasaki T, Iguchi T, et al. Comparative effectiveness of radical prostatectomy and cu- rative radiotherapy in localized prostate cancer: long-term follow- up. J Radiat Res 2017;58:552-8.
28. Donovan JL, Hamdy FC, Lane JA, Mason M, Metcalfe C, Walsh E, et al. Patient-reported outcomes after monitoring, surgery, or ra- diotherapy for prostate cancer. N Engl J Med 2016;375:1425-37.
29. Resnick MJ, Koyama T, Fan KH, Albertsen PC, Goodman M, Hamilton AS, et al. Long-term functional outcomes after treat- ment for localized prostate cancer. N Engl J Med 2013;368:436-45.
30. Wilt TJ, Jones KM, Barry MJ, Andriole GL, Culkin D, Wheeler T, et al. Follow-up of prostatectomy versus observation for early pros- tate cancer. N Engl J Med 2017;377:132-42.
31. Hamdy FC, Donovan JL, Lane JA, Mason M, Metcalfe C, Holding C, et al. 10-year outcomes after monitoring, surgery, or radiother- apy for localized prostate cancer. N Engl J Med 2016;375:1415-24.
32. Hwang I, Lim D, Jeong YB, Park SC, Noh JH, Kwon DD, et al. Up- grading and upstaging of low-risk prostate cancer among Korean patients: a multicenter study. Asian J Androl 2015;17:811-4.
33. Park JW, Jang WS, Koh DH, Ham WS, Rha KH, Hong SJ, et al. Im- pact of early salvage androgen deprivation therapy in localized prostate cancer after radical prostatectomy: a propensity score matched analysis. Yonsei Med J 2018;59:580-7.
34. Yoo KB, Noh JW, Kwon YD, Cho KH, Choi Y, Kim JH. Having pri- vate cancer insurance in Korea: gender differences. Asian Pac J Cancer Prev 2015;16:7981-6.
35. Kim JH, Kim SY, Yun SJ, Chung JI, Choi H, Yu HS, et al. Medical travel among non-Seoul residents to seek prostate cancer treat- ment in medical facilities of Seoul. Cancer Res Treat 2019;51:53-64.