INTRODUCTION
Stomach cancer poses a serious burden to global health.1 Stom-
ach cancer is the third leading cause of cancer death, with an es- timated 951600 new stomach cancer cases and 723100 deaths in 2012. Incidence rates are highest in East Asia, particularly in Korea, Mongolia, Japan, and China.2 However, other than Ko- rea and Japan, prevention and screening programs for stomach cancer in these countries are lacking.3 In Korea, stomach cancer is the second most common cancer in both sexes (37.2/100000), the most common cancer in men (54.1/100000), the fourth most common cancer in women (23/100000) (as of 2014), and the third leading cause of cancer death in both sexes (16.7/100000) (as of 2015).4
In 1999, Korea began organized screening for stomach can- cer as part of the National Cancer Screening Program (NCSP) at no charge for medical aids recipients (MAP).5 By 2002, the NCSP was expanded to provide screening free of charge for Na-
Socioeconomic Inequalities in Stomach Cancer
Screening in Korea, 2005–2015: After the Introduction of the National Cancer Screening Program
Eun-young Lee
1, Yoon Young Lee
2, Mina Suh
2, Eunji Choi
1, Tran Thi Xuan Mai
1, Hyunsoon Cho
1, Boyoung Park
1, Jae Kwan Jun
2, Yeol Kim
2, Jin Kyung Oh
1, Moran Ki
1, and Kui Son Choi
11Graduate School of Cancer Science and Policy, National Cancer Center, Goyang;
2National Cancer Control Institute, National Cancer Center, Goyang, Korea.
Purpose: This study aimed to investigate socioeconomic inequalities in stomach cancer screening in Korea and trends therein across income and education groups.
Materials and Methods: Data from the Korean National Cancer Screening Survey, a nationwide cross-sectional survey, were uti- lized. A total of 28913 men and women aged 40 to 74 years were included for analysis. Prior experience with stomach cancer screening was defined as having undergone either an endoscopy or gastrointestinal series within the past two years. The slope in- dex of inequality (SII) and relative index of inequality (RII) were evaluated to check inequalities.
Results: Stomach cancer screening rates increased from 40.0% in 2005 to 74.8% in 2015, with an annual percent change of 5.8%
[95% confidence interval (CI) 4.2 to 7.5]. Increases in stomach cancer screening rates were observed for all age, education, and household income groups. Inequalities in stomach cancer screening were noted among individuals of differing levels of educa- tion, with a pooled SII estimate of 6.14% (95% CI, 3.94 to 8.34) and RII of 1.26 (95% CI, 1.12 to 1.40). Also, income-related inequali- ties were observed with an SII of 6.93% (95% CI, 4.89 to 8.97) and RII of 1.30 (95% CI, 1.17 to 1.43). The magnitude of inequality was larger for income than for education.
Conclusion: Both education and income-related inequalities were found in stomach cancer screening, despite a continuous in- crease in screening rate over the study period. Income-related inequality was greater than education-related inequality, and this was more apparent in women than in men.
Key Words: Stomach neoplasm, mass screening, inequalities, early detection of cancer
pISSN: 0513-5796 · eISSN: 1976-2437
Received: February 23, 2018 Revised: July 20, 2018 Accepted: August 10, 2018
Co-corresponding authors: Kui Son Choi, PhD, Graduate School of Cancer Sci- ence and Policy, National Cancer Center, 323 Ilsan-ro, Ilsandong-gu, Goyang 10408, Korea.
Tel: 82-31-920-2912, Fax: 82-31-920-2189, E-mail: [email protected] and Moran Ki, MD, PhD, Graduate School of Cancer Science and Policy, National Can- cer Center, 323 Ilsan-ro, Ilsandong-gu, Goyang 10408, Korea.
Tel: 82-31-920-2736, Fax: 82-31-920-2189, E-mail: [email protected]
•The authors have no financial conflicts of interest.
© Copyright: Yonsei University College of Medicine 2018
This is an Open Access article distributed under the terms of the Creative Com- mons Attribution Non-Commercial License (https://creativecommons.org/licenses/
by-nc/4.0) which permits unrestricted non-commercial use, distribution, and repro- duction in any medium, provided the original work is properly cited.
Yonsei Med J 2018 Oct;59(8):923-929 https://doi.org/10.3349/ymj.2018.59.8.923
tional Health Insurance Service (NHIS) beneficiaries in the lowest 20% income stratum in 2002, and was further expand- ed to include those in the lowest 50% by 2005. Presently, MAP recipients and NHIS beneficiaries in the 50% or lower income bracket are eligible for stomach cancer screening free-of- charge, while remaining NHIS beneficiaries are eligible to un- dergo stomach cancer screening with a co-payment of 10% of the cost of the procedure.6 Through the NCSP, Korean men and women older than 40 years are eligible for stomach screening via endoscopy or upper gastrointestinal series (UGIS) bienni- ally. Upon implementation of stomach cancer screening in the NCSP, screening rates increased from 7.5% in 2002 to 47.3% in 2012.7 Overall stomach cancer screening rates for both orga- nized and opportunistic cancer screening programs increased annually by 4.2% from 2004 to 2013.8
Inequalities in the use of cancer screening according to so- cio-economic positions are higher in countries without popu- lation-based cancer screening programs.9 Nevertheless, na- tionwide screening programs do not completely eliminate inequalities.10 In a previous study, income disparities were re- ported to affect degrees of participation in cancer screening programs in Korea.11 However, this study applied convention- al logistic regression instead of inequality indices, and was unable to report trends in changes in noted disparities. Thus, the present study was conducted to evaluate stomach cancer screening rates in Korea and trends therein from 2005–2015 using data collected through a population-based survey. We also assessed social economic status inequalities in stomach cancer screening in Korea using the slope index of inequality (SII) and relative index of inequality (RII) according to educa- tion and income levels.
MATERIALS AND METHODS
Study population
Data were derived from the Korean National Cancer Screen- ing Survey (KNCSS). The KNCSS is an annual nationwide, population-based, cross-sectional survey conducted by the National Cancer Center in Korea, and seeks to assess behav- ioral patterns associated with cancer screening rates for stom- ach, liver, colorectal, breast, and cervical cancers. Eligible par- ticipants in the KNCSS include cancer free males aged 40 years or over and cancer free females aged 30 years or over. Informed consent was obtained from all participants. Details on the survey have been described elsewhere.12
We obtained KNCSS data from 2005 to 2015. In the NCSP, individuals aged between 40 to 74 years are targeted for stom- ach cancer screening. Thus, men and women aged between 40 to 74 years who participated in the KNCSS were included in the present study. The total number of KNCSS participants included in this study was 28913 persons. This study was ap- proved by the Institutional Review Board of the National Can-
cer Center, Korea (approval number: NCCNCS-08-129).
Measures
Using a structured questionnaire, participants were asked about their experience with stomach cancer screening. The ques- tions included “Have you ever undergone stomach cancer screening?,” “What test did you receive for stomach cancer screening?,” and “When did you receive these tests?” Screen- ing status was defined as “screened” for men and women who underwent UGIS or endoscopy tests within 2 years for stom- ach cancer screening.
This study used two indicators of socioeconomic status: ed- ucation level and monthly household income. Education level was categorized as elementary school graduates or lower, middle school graduates, high school graduates, and college graduates or more. Household income was categorized into quartiles. In the KNCSS, monthly household income has been collected as a categorical variable with 13 categories, ranging from 1000 USD to 5000 USD in 2005 and from 1000 USD to 10000 USD since 2006. In Stata (StataCorp, College Station, TX, USA), we used a default quartile function that automati- cally makes quartile points of household income for a sample according to income categories. Therefore, different cutoff points were applied for different years to divide income levels by quartile. The 1st quartile represents the lowest income group, whereas the 4th quartile indicates the highest income group. For each study year, income levels were divided into four groups as follows: <1500, 1500–1999, 2000–2999, and
≥3000 in 2005 and 2006; <1500, 1500–2499, 2500–3499, and
≥3500 in 2007, 2008, and 2009; <2000, 2000–2999, 3000–3999, and ≥4000 in 2010 and 2011; <2500, 2500–3499, 3500–3999, and ≥4000 in 2012; and <3000, 3000–3999, 4000–4999, and
≥5000 in 2013, 2014, and 2015.
Statistical analysis
Consecutive stomach cancer screening rates over 10 years were calculated with adjustment for weight reflected age struc- tures of the Korean population for each study year. Weighted screening rates are presented as annual percent changes (APCs) within a 95% confidence interval (CI) to reflect significantly changing trends in stomach cancer screening rates. APCs were estimated for levels of each socioeconomic variable, fit- ted by SEER*Stat software from the National Cancer Institute (Bethesda, MD, USA).
To evaluate inequalities among subgroups in regards to participation in stomach cancer screening, education level and income level were considered. As indexes of inequality, SII and RII were calculated. To calculate SII, the respective so- cial groups were first ordered from lowest to highest. Each so- cial-group category covers a range in the cumulative distri- bution of the population and is given a score based on the midpoint of its range in the cumulative distribution in the pop- ulation. SII is obtained via regression of the stomach cancer
screening rates on the mean relative rank of education and income variables. SII is interpreted as the absolute difference in health status between the bottom and top of the social group distribution.13,14 When the SII value equals zero, it means there is no inequality, and when the SII value is greater or less than zero, it means that stomach cancer screening rates are higher in the advantaged subgroups or in the disadvan- taged subgroups, respectively. Dividing SII by the mean popu- lation health provides a relative inequality measure, RII. Its interpretation is similar to SII, but it measures proportionate, rather than absolute, increases or decreases in health between the highest and lowest socioeconomic groups.13 Thus, an RII value greater than one indicates higher rates of stomach can- cer screening in high socioeconomic groups. An RII value equal to 1 indicates no inequality in stomach cancer screen- ing, whereas an RII value less than one indicates higher rates of stomach cancer screening in low socioeconomic groups.
Forest plotting was applied to depict the obtained SII and RII values and to visualize statistically significant changes in trends for educational and household income inequalities in stomach cancer screening uptake. Pooled estimates of SII and RII across study years were also calculated. All statistical anal- yses were weighted according to age structures of Korean men and women in each corresponding year using data from Sta- tistics Korea, and were performed using SAS statistical soft- ware (version 9.3; SAS Institute Inc., Cary, NC, USA).
RESULTS
Characteristics of the study population
Baseline characteristics of the study population in the KNCSS from 2005 to 2015 are presented in Table 1. Regarding sex ra- tio, men and women began to comprise 50% of the total study population in the latter half of the study years, with little dif- ferences by year. Individuals in their 40s and those in their 70s comprised the largest and smallest age groups, respectively.
High school graduates were in the majority at around 50% in every study year (Table 1). Regarding socioeconomic charac- teristics of the study population according to gender, men comprised higher numbers of individuals in the 3rd and 4th quartiles of income, whereas women generally had a higher proportion of individuals in the 1st quartile. Regarding educa- tion, fewer men were elementary graduates or lower, and more were college graduates or more. A high number of women were elementary graduates or lower, with fewer col- lege graduates or more especially in the first half of the study years (Supplementary Table 1, only online).
Stomach cancer screening rate and annual percentage changes
Overall stomach cancer screening rates increased continu- ously from 2005 to 2015. In subgroups of age and income level,
significant APCs were observed. All subgroups showed increas- ing trends in stomach cancer screening rate, as represented by positive APC values (Table 2). All subgroups (age, income, and education level) of both men and women showed signifi- cant increasing APC trends in stomach cancer screening rate (Supplementary Table 2, only online). For women, however, the magnitude of APC values was relatively lower than that in men generally.
Absolute and relative inequality in stomach cancer screening
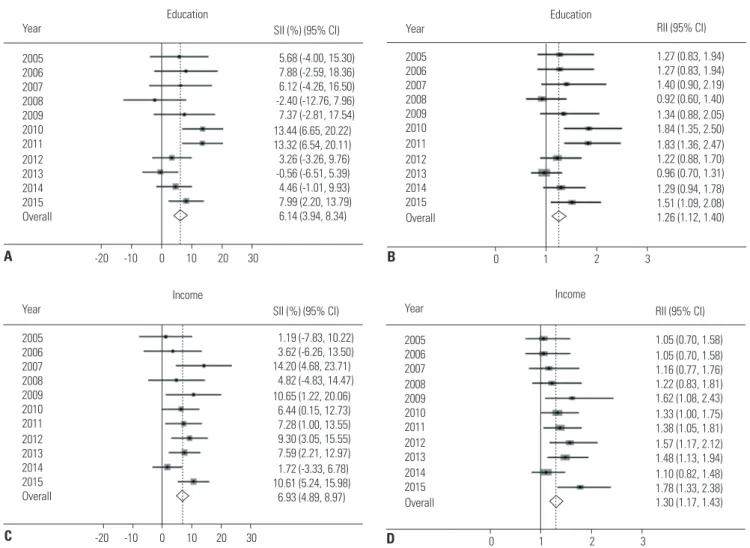
Socioeconomic inequalities in stomach cancer screening par- ticipation are illustrated in Fig. 1. In forest plots summarizing absolute and relative inequalities for the entire study popula- tion and study period, inequalities in stomach cancer screen- ing rates according to education and income level were found, and the magnitude of the inequalities for income level was larger than that for education level both in absolute and rela- tive measures.
Representing absolute disparity, positive SII values indicat- ed that advantaged individuals with greater education partici- pated more in stomach cancer screening in all study years, ex- cept 2008 and 2013, with magnitudes ranging between 3.26%
and 13.44% (Fig. 1A). Regarding RII, which represents relative disparity, values significantly greater than 1 indicated that ad- vantaged individuals in regards to education status participat- ed more in stomach cancer screening in 2010, 2011, and 2015 (Fig. 1B). Overall educational inequality was significant with pooled estimates of 6.14% (95% CI, 3.94 to 8.34) in absolute terms and 1.26 in relative terms (95% CI, 1.12 to 1.40).
Concerning household income, significant positive SII val- ues indicated that people who belonged to the higher income group participated more in stomach cancer screening in 2007, 2009, 2010, 2011, 2012, 2013, and 2015 (Fig. 1C). Further, RII values significantly greater than 1 appeared in 2009, 2010, 2011, 2012, 2013, and 2015, further demonstrating that people with higher income participated more in stomach cancer screen- ing (Fig. 1D). Overall pooled estimates for income inequality were statistically significant in both absolute terms (SII=6.93%;
95% CI, 4.89 to 8.97) and relative terms (RII=1.30; 95% CI, 1.17 to 1.43).
The absolute and relative inequalities in stomach cancer screening by gender are described in Supplementary Table 3 (only online). In men, with regard to education, we found sta- tistically significant differences in both absolute and relative overall pooled inequality estimates (pooled SII=7.68%; 95%
CI, 4.57 to 10.80, RII=1.25; 95% CI, 1.05 to 1.46). Also, income inequalities were statistically significant in both absolute and relative pooled estimates (pooled SII=6.04%; 95% CI, 3.12 to 8.96, RII=1.26; 95% CI, 1.08 to 1.45). In women, the overall pooled estimate in absolute inequality by education level was significant, with an SII value of 4.47% (95% CI, 1.36 to 7.59).
Also, pooled estimates of inequality by income in both abso-
Table 1. Baseline Characteristics of the Study Population in the Korean National Cancer Screening Survey, 2005–2015 20052006200720082009201020112012201320142015 n%n%n%n%n%n%n%n%n%n%n% Total1767100.01561100.01585100.01619 100.01607100.03411100.03474100.03498100.03509100.03441100.03441100.0 Gender Male81746.276348.977348.779949.478548.8168049.3169548.8173649.6173649.5173050.3173050.3 Female95053.879851.181251.382050.682251.2173150.7177951.2176250.4177350.5171149.7171149.7 Age groups 40–4979545.069844.767842.870043.369443.2140041.0138439.8139539.9135538.6130738.0127937.2 50–5949928.344828.742927.048630.048630.2109832.2117333.8118333.8122234.8119334.7118934.6 60–6935420.031019.842927.131819.631419.666519.566319.166218.968819.667719.771120.7 70–741196.71056.8493.11157.11137.02487.32547.32587.42447.02647.72627.6 Household income* 1st quartile53330.243127.636122.833320.646228.767219.766819.296627.689025.483024.185324.8 2nd quartile 22512.719412.445828.945628.126516.582224.184324.3106530.469519.878522.879123.0 3rd quartile52729.845629.241726.348830.146428.985425.087825.350514.487024.896027.999228.8 4th quartile 48227.348030.834922.134221.241625.9106331.2108531.296227.5105430.086625.280523.4 Education level† Elementary38021.537023.734822.027116.729718.53339.83319.539111.22116.02226.52025.9 Middle school 32918.627917.927517.432920.421813.644413.043212.435310.12958.43219.33339.7 High school 78244.268143.671445.075246.476547.6178652.4183852.9186753.4189153.9193456.2188554.8 College27615.623114.824815.626716.532720.384824.987325.188725.3111231.796428.0102129.7 *The 1st quartile represents the lowest income group, whereas the 4th quartile indicates the highest income group, †Elementary means elementary graduates or lower, Middle school means middle school gradu- ates, High school means high school graduates, College means college or more.
lute and relative terms were significant (pooled SII=7.61%;
95% CI, 4.77 to 10.46, RII=1.37; 95% CI, 1.17 to 1.56). Overall, men showed relatively bigger SII and RII inequality estimates than women by education level. On the other hand, women showed bigger inequality SII and RII estimates than men by income level.
DISCUSSION
This study analyzed stomach cancer screening rates from 2005 to 2015, and identified inequalities in screening participation according to education status and income level. Generally, stomach cancer screening rates continuously increased with time. The noted increase in stomach cancer screening rates was expected due to the implementation of the NCSP in Korea.
Continuity in nationwide cancer screening services through the NCSP was deemed to have contributed to the gradual in- crease in stomach cancer screening rates. Indeed, a previous study reported that participation rates have increased sub- stantially for organized stomach cancer screening, but have remained relatively constant for opportunistic screening. In potential explanation thereof, more advantaged groups have been found to be more likely to participate in both organized and opportunistic screening.5 This is partly explained by the fact that more advantaged individuals are more concerned about their health. Also, the NCSP has continuously expanded
its target population who can receive stomach cancer screen- ing free of charge and increased subsidization of screening costs. Additionally, the NHIS and public health centers send invitation letters and make telephone calls to encourage the target population to participate in screening. For these rea- sons, organized screening could have a positive effect across all groups.
Despite the observed increases of stomach cancer screen- ing, significant inequalities in stomach cancer screening rates according to education status and income level were found in the current study, and the magnitude of the inequality in rela- tion to income level was quite large. Actually, screening rates have been found to be influenced by several factors. Accord- ing to related studies for other cancers in other countries, even with the long-time presence of universal insurance cov- erage in Ontario, the disparities in the use of cancer screening procedures by the poor were similar to those in the United States, suggesting that universal coverage is not sufficient to overcome the large disparities in screenings across socioeco- nomic status.15 Meanwhile, organized screening programs for breast and colorectal cancer appear to have facilitated reduc- tions in relative socioeconomic inequalities in France, even though the results were not statistically significant.16 In the United States, continued differences in breast cancer screening rates related to income level have been found among women.17 In previous studies on participation in stomach cancer screen- ing in Korea, age, education, existence of spouse, drinking, Table 2. Stomach Cancer Screening Rates (%) according to Socioeconomic Status with APCs in the Korean National Cancer Screening Survey, 2005–2015
2005 2006 2007 2008 2009 2010 2011 2012 2013 2014 2015 APC (%) 95% CI
Total 40.0 42.6 46.2 53.7 57.1 65.0 64.6 70.9 73.6 76.7 74.8 5.8 4.2–7.5
Gender
Male 38.0 39.1 43.6 49.9 52.5 63.6 63.5 69.9 72.4 77.2 75.4 6.6 4.8–8.5
Female 41.7 46.0 48.6 57.4 61.6 66.4 65.6 71.9 74.8 76.2 74.2 5.1 3.4–6.8
Age groups
40–49 34.3 36.7 39.6 47.4 47.7 59.7 59.0 65.1 72.6 75.9 70.7 7.6 5.4–9.8
50–59 43.4 45.3 49.0 57.4 62.6 69.6 68.8 76.2 74.6 77.5 77.4 4.8 2.9–6.7
60–69 46.9 54.1 53.8 60.3 69.6 69.8 68.9 74.9 74.4 78.0 79.4 4.3 3.0–5.5
70–74 43.1 37.2 46.9 58.2 57.2 62.1 63.6 67.6 72.2 73.4 71.0 5.0 3.2–6.8
Household income*
1st quartile 41.9 47.0 41.5 60.8 60.4 67.3 66.0 69.7 71.1 75.4 72.3 4.8 2.9–6.8
2nd quartile 45.4 36.9 49.7 50.2 52.8 59.7 59.7 69.3 73.5 76.3 72.1 5.9 4.1–7.8
3rd quartile 35.5 39.2 44.0 49.9 54.5 62.3 61.9 68.9 71.6 78.6 74.7 7.0 5.2–8.8
4th quartile 40.4 44.3 49.1 57.1 59.3 69.9 69.6 74.9 77.5 76.2 80.3 5.5 3.5–7.5
Education level†
Elementary 39.7 45.7 51.0 63.0 63.6 65.4 65.2 70.3 75.0 70.6 63.5 4.8 2.2–7.5
Middle school 50.4 47.8 48.9 58.5 64.2 65.1 64.2 72.9 69.9 75.0 74.6 4.4 3.2–5.7
High school 37.3 38.8 42.4 49.6 52.5 63.3 62.9 71.1 74.4 77.2 76.0 6.7 4.8–8.8
College 35.6 42.7 47.2 50.0 57.5 68.5 67.9 70.0 73.0 77.5 75.1 5.1 2.9–7.3
APC, annual percent change; CI, confidence interval.
*The 1st quartile represents the lowest income group, whereas the 4th quartile indicates the highest income group, †Elementary means elementary graduates or lower, middle school means middle school graduates, high school means high school graduates, and college means college or more.
and smoking were found to be influential factors for the use of stomach cancer screening services.18 Another study showed that education-related inequality decreased, whereas income- related inequality increased, in organized screening and that both income and education-related disparities increased due to the widening of socioeconomic differences in opportunis- tic screening from 2005 to 2009 in Korea.5 In the current study, education inequality was significantly related to stomach can- cer screening among men. Further, income inequalities in stomach cancer screening were noted in both male and female participants. Many reasons could account for income inequal- ities in stomach cancer screening: While the NSCP ensures stomach cancer screening for all individuals at no or little charge, only those who can dedicate time to undergoing screen- ing can receive screening services. Regarding the observed gender differences in the magnitude of inequalities, especially in regards to income level, the present study indicates that women face greater inequality than men. Thus, the reasons for the gap among women in comparison to men warrant fur- ther study.
Our study has a few limitations. Participants were admin- istered self-reported surveys, thereby possibly introducing recall bias in describing past screening experiences or socio- economic variables. Further, several factors influencing partic- ipation in stomach cancer screening, beyond education and income level, such as residence area, were not considered and should be further studied. Specifically it is very meaningful to see the geographical gaps in screening rate in terms of in- equality. Thus, further study is needed with additional infor- mation (e.g., number of screening units for each region) to ex- plain geographical gaps.
This study identified groups of persons who were more like- ly to be excluded from the benefits of stomach cancer screen- ing, which has been found in previous studies to be effective in early diagnosis of stomach cancer and mortality reduction.
The disparity in screening rates in relation with income level appeared to be quite large. Active intervention through suit- able policies targeting these underprivileged groups is needed so that all members of society could share the benefits of screen- ing. Further studies are needed to outline longitudinal trends 2005
2006 2007 2008 2009 2010 2011 2012 2013 2014 2015 Overall
Education
Year SII (%) (95% CI)
-20 -10 0 10 20 30
5.68 (-4.00, 15.30) 7.88 (-2.59, 18.36) 6.12 (-4.26, 16.50) -2.40 (-12.76, 7.96) 7.37 (-2.81, 17.54) 13.44 (6.65, 20.22) 13.32 (6.54, 20.11) 3.26 (-3.26, 9.76) -0.56 (-6.51, 5.39) 4.46 (-1.01, 9.93) 7.99 (2.20, 13.79) 6.14 (3.94, 8.34)
0 1 2 3
1.05 (0.70, 1.58) 1.05 (0.70, 1.58) 1.16 (0.77, 1.76) 1.22 (0.83, 1.81) 1.62 (1.08, 2.43) 1.33 (1.00, 1.75) 1.38 (1.05, 1.81) 1.57 (1.17, 2.12) 1.48 (1.13, 1.94) 1.10 (0.82, 1.48) 1.78 (1.33, 2.38) 1.30 (1.17, 1.43) RII (95% CI) Income
Year 2005 2006 2007 2008 2009 2010 2011 2012 2013 2014 2015 Overall A
2005 2006 2007 2008 2009 2010 2011 2012 2013 2014 2015 Overall
Education Year
0 1 2 3
1.27 (0.83, 1.94) 1.27 (0.83, 1.94) 1.40 (0.90, 2.19) 0.92 (0.60, 1.40) 1.34 (0.88, 2.05) 1.84 (1.35, 2.50) 1.83 (1.36, 2.47) 1.22 (0.88, 1.70) 0.96 (0.70, 1.31) 1.29 (0.94, 1.78) 1.51 (1.09, 2.08) 1.26 (1.12, 1.40) RII (95% CI)
B
D -20 -10 0 10 20 30
1.19 (-7.83, 10.22) 3.62 (-6.26, 13.50) 14.20 (4.68, 23.71)
4.82 (-4.83, 14.47) 10.65 (1.22, 20.06)
6.44 (0.15, 12.73) 7.28 (1.00, 13.55) 9.30 (3.05, 15.55) 7.59 (2.21, 12.97) 1.72 (-3.33, 6.78) 10.61 (5.24, 15.98) 6.93 (4.89, 8.97) SII (%) (95% CI) Income
Year 2005 2006 2007 2008 2009 2010 2011 2012 2013 2014 2015 Overall
C
Fig. 1. Absolute and relative inequalities in stomach cancer screening from 2005 to 2015. (A) Absolute educational inequalities in stomach cancer screen- ing rates. (B) Relative educational inequalities in stomach cancer screening rates. (C) Absolute household income inequalities in stomach cancer screen- ing rates. (D) Relative household income inequalities in stomach cancer screening rates. Solid line represents the line of equality; dotted line reflects pooled coefficients. SII, slope index of inequality; RII, relative index of inequality; CI, confidence interval.
and identify other factors, such as geographical factors, in re- lation with disparities in stomach cancer screening.
ACKNOWLEDGEMENTS
This study was supported by a Grant-in-Aid for Cancer Re- search and Control from the National Cancer Center of Korea (#1610401). Three authors, Tran Thi Xuan Mai, Eunji Choi, and Eun-young Lee, received funding from the “International Cooperation & Education Program” (#NCCRI·NCCI 52210- 52211, 2017).
ORCID
Moran Ki https://orcid.org/0000-0002-8892-7104 Kui Son Choi https://orcid.org/0000-0001-5336-3874
REFERENCES
1. Hamashima C, Goto R. Potential capacity of endoscopic screen- ing for gastric cancer in Japan. Cancer Sci 2017;108:101-7.
2. Torre LA, Bray F, Siegel RL, Ferlay J, Lortet-Tieulent J, Jemal A.
Global cancer statistics, 2012. CA Cancer J Clin 2015;65:87-108.
3. Goto R, Hamashima C, Mun S, Lee WC. Why screening rates vary between Korea and Japan--differences between two national healthcare systems. Asian Pac J Cancer Prev 2015;16:395-400.
4. Jung KW, Won YJ, Oh CM, Kong HJ, Lee DH, Lee KH; Community of population-based regional cancer registries. Cancer statistics in Korea: incidence, mortality, survival, and prevalence in 2014.
Cancer Res Treat 2017;49:292-305.
5. Lee HY, Park EC, Jun JK, Hahm MI, Jung KW, Kim Y, et al. Trends in socioeconomic disparities in organized and opportunistic gas- tric cancer screening in Korea (2005-2009). Cancer Epidemiol Biomarkers Prev 2010;19:1919-26.
6. Kweon SS, Kim MG, Kang MR, Shin MH, Choi JS. Difference of stage at cancer diagnosis by socioeconomic status for four target cancers of the National Cancer Screening Program in Korea: Re- sults from the Gwangju and Jeonnam cancer registries. J Epide- miol 2017;27:299-304.
7. Suh M, Song S, Cho HN, Park B, Jun JK, Choi E, et al. Trends in participation rates for the National Cancer Screening Program in
Korea, 2002-2012. Cancer Res Treat 2017;49:798-806.
8. Suh M, Choi KS, Park B, Lee YY, Jun JK, Lee DH, et al. Trends in cancer screening rates among Korean men and women: results of the Korean National Cancer Screening Survey, 2004-2013. Cancer Res Treat 2016;48:1-10.
9. Palència L, Espelt A, Rodríguez-Sanz M, Puigpinós R, Pons-Vigués M, Pasarín MI, et al. Socio-economic inequalities in breast and cervical cancer screening practices in Europe: influence of the type of screening program. Int J Epidemiol 2010;39:757-65.
10. Kwon YM, Lim HT, Lee K, Cho BL, Park MS, Son KY, et al. Factors associated with use of gastric cancer screening services in Korea.
World J Gastroenterol 2009;15:3653-9.
11. Lee K, Lim HT, Hwang SS, Chae DW, Park SM. Erratum to: “Socio- economic disparities in behavioural risk factors for cancer and use of cancer screening services in Korean adults aged 30 years and older: The Third Korean National Health and Nutrition Examina- tion Survey, 2005 (KNHANES III)” [Public Health 124 (2010): 698–
704]. Public Health 2011;125:243.
12. Park B, Choi KS, Lee YY, Jun JK, Seo HG. Cancer screening status in Korea, 2011: results from the Korean National Cancer Screen- ing Survey. Asian Pac J Cancer Prev 2012;13:1187-91.
13. Harper S, Lynch J. Methods for measuring cancer disparities: us- ing data relevant to healthy people 2010 cancer related objectives.
NCI Cancer Surveillance Monograph Series, Number 6. Bethes- da, MD: National Cancer Institute; 2005.
14. Hosseinpoor AR, Nambiar D, Schlotheuber A, Reidpath D, Ross Z.
Health Equity Assessment Toolkit (HEAT): software for exploring and comparing health inequalities in countries. BMC Med Res Methodol 2016;16:141.
15. Katz SJ, Hofer TP. Socioeconomic disparities in preventive care persist despite universal coverage. Breast and cervical cancer screening in Ontario and the United States. JAMA 1994;272:530-4.
16. Kelly DM, Estaquio C, Léon C, Arwidson P, Nabi H. Temporal trend in socioeconomic inequalities in the uptake of cancer screening programmes in France between 2005 and 2010: results from the Cancer Barometer surveys. BMJ Open 2017;7:e016941.
17. Kim J, Jang SN. Socioeconomic disparities in breast cancer screen- ing among US women: trends from 2000 to 2005. J Prev Med Pub- lic Health 2008;41:186-94.
18. Shin JY, Lee DH. Factors associated with the use of gastric cancer screening services in Korea: the Fourth Korea National Health and Nutrition Examination Survey 2008 (KNHANES IV). Asian Pac J Cancer Prev 2012;13:3773-9.