Association between Variations in Body Mass Index and Cognitive Function in Older Korean Adults
Eun Mi Bae1, Sang Min Park2,3,*
1Department of Family Medicine, National Police Hospital, Seoul; 2Department of Family Medicine, Seoul National University Hospital, Seoul; 3Department of Biomedical Sciences, Seoul National University Graduate School, Seoul, Korea
Background: Although several studies have assessed obesity and cognitive impairment, most of these studies focus on body mass index (BMI) and cognitive impairment. Therefore to better understand the importance of weight maintenance with aging, this study investigated the relationship between variations in weight and cog- nitive impairment using the Korean version of the Mini-Mental State Examination (K-MMSE) in individuals aged 45 years or older in Korea.
Methods: Data on 3,477 adults with normal cognitive function (K-MMSE ≥24) at baseline were acquired from the Korean Longitudinal Study of Aging (KLoSA) 2006–2016. The association between weight variability and risk of cognitive impairment was assessed using multiple logistic regression models. We also assessed weight vari- ability and change in cognitive function over the 6-year follow-up using multiple linear regression.
Results: Overall, higher variations in BMI were associated with cognitive impairment. Patients in the quintile with the highest variation (Q5) in BMI (mean of BMI changes, 2.69) showed the greatest degree of cognitive im- pairments (adjusted odds ratio, 1.52; 95% confidence interval [CI], 1.08–2.14; P for trend=0.016). Furthermore, a higher frequency in the number of times (3 times) the patient’s body weight changed was associated with a lower cognitive function (adjusted odds ratio, 3.42; 95% CI, 1.67–7.03; P for trend<0.001).
Conclusion: In this nationally representative study, weight variability was associated with a higher risk of cog- nitive decline during mid- and late-life stages.
Key words: Body weight change, Body mass index, Cognitive dysfunction, Dementia
Received April 7, 2021 Reviewed May 11, 2021 Accepted May 22, 2021
* Corresponding author Sang Min Park
https://orcid.org/0000-0002-7498-4829 Department of Family Medicine, Seoul National University Hospital, 101 Daehak-ro, Jongno-gu, Seoul 03080, Korea Tel: +82-2-2072-3331 Fax: +82-2-766-3276 E-mail: [email protected]
INTRODUCTION
Globally, obesity and an overweight health statuses have been as- sociated with increased mortality and morbidity, and they are risk factors for cardiometabolic diseases, including diabetes mellitus, hypertension, cardiovascular disease, and some cancers. In a large- scale, longitudinal study, high body mass index (BMI) was associ- ated with increased risk of acute myocardial infarction and coro- nary heart disease even in young adults.
1Therefore, weight loss has been recommended as part of the efforts not only to reduce all- cause mortality and morbidity, but also to improve the quality of life. Weight loss is usually followed by weight gain (weight cycling)
and weight fluctuation, and this weight variability is an important risk factor for cardiovascular diseases and death.
2,3The importance of weight loss without weight variability has been emphasized in obese and overweight individuals. Despite the government’s efforts to reduce the increasing prevalence of obesity and overweight sta- tuses combined with weight cycling, the prevalence of these prob- lems is steadily increasing.
As life expectancy increases, there is a corresponding and rapid increase in the number of cases of dementia worldwide. Cognitive impairment, dementia and Alzheimer diseases are known to im- pact the quality of later life. Adiposity is directly and indirectly as- sociated with cognitive impairment and dementia.
4The relation-
Copyright © 2021 Korean Society for the Study of Obesity
This is an Open Access article distributed under the terms of the Creative Commons Attribution Non-Commercial License (https://creativecommons.org/licenses/by-nc/4.0/) which permits unrestricted non-commercial use, distribution, and reproduction in any medium, provided the original work is properly cited.
2017-03-16 https://crossmark-cdn.crossref.org/widget/v2.0/logos/CROSSMARK_Color_square.svg
ship of BMI with the risk of dementia is consistent with a U-shaped curve, and mid-life obesity is a significant risk factor for dementia and Alzheimer disease.
5In contrast, some reports have insisted that overweight and obesity statuses serve as protective factors for cog- nitive impairment.
6The association between fluctuations in mid-life body weight and dementia is controversial. Being underweight or having a lower BMI in later-life is also associated with a poor prognosis for demen- tia compared to a stable BMI.
7Similarly, mid-life variations in body weight that persist for over 5 years are associated with an increased risk of dementia.
8Some studies have reported that high body weight variability was associated with an increased risk of dementia in the elderly.
9,10Other studies have reported that in women, additional weight gain or loss, in late life did not affect the risk of cognitive im- pairment, although this is not the case in men.
11In this study, we aimed to examine the association between weight variability and cognitive impairment in populations over 45 years of age. This study investigated changes in BMI and compared groups with healthy cognitive function and those with impaired cognitive function, using the Korean Longitudinal Study of Aging (KLoSA) database information from 2006 to 2016.
METHODS Data and study population
The study population was acquired from the KLoSA, which is a nationally representative longitudinal survey of the population, 45 years of age and older, by the Korea Labor Institute and that has been collected since 2006.
12The participants were selected from a list of households that were comprised of at least one person aged 45 years or older in the census, based on a multistage stratified prob- ability sampling scheme. The survey collected detailed information on health and cognitive function, demographics, income and assets, and employment on a biennial basis by conducting computer-as- sisted personal interviews. Currently, data from six waves (2006, 2008, 2010, 2012, 2014, and 2016) are publicly available; we used the first, second and third waves to assess weight variability and the first and sixth waves to assess cognitive changes. Of the 10,254 eli- gible individuals, for whom cognitive function was measured at baseline, 7,568 individuals with normal cognitive function (Korean
version of the Mini-Mental State Examination [K-MMSE] score
≥ 24) were defined as the baseline study population and 2,686 in- dividuals were excluded because they were missing K-MMSE data in the first wave.
Among the 10,254 participants surveyed at baseline (2006), the following were excluded: 2,686 with mild or severe cognitive im- pairment (K-MMSE ≤ 23),
132,760 with missing values for BMI and self-reported weight changes, 191 with missing values for MMSE scores, and 1,140 with missing values for characteristics data. Final- ly, a total of 3,477 participants remained in our sample for analysis (Fig. 1).
Cognitive measures
Cognitive performance was assessed using the MMSE, which is composed of seven categories representing different cognitive func- tions: orientation of time; orientation of place; registration of three words; attention and calculation; recall of three objects; language;
and visual construction.
14This approach is a simple tool that is de- signed to assess the global cognitive status based on different cogni- tive domains and to help diagnose dementia. In general, a score of 23–18 is considered to be associated with cognitive impairment and < 18 is regarded as severe cognitive impairment. This study as- sessed changes in cognitive function that were evaluated using the
Figure 1. Diagram of final analytic sample using data from the Korean Longitudi- nal Study of Aging (KLoSA; 2006–20016). BMI, body mass index; MMSE, Mini- Mental State Examination.10,254 KLoSa
Population who was excluded cognitive impairment at 1st wave (2,686 excluded) 7,568 Population who normal
cognitive function at 1st wave
3,477 Study population
Population who did not answer BMI and Self-report of weight changes at 1st, 2nd, 3rd, 6th waves (2,760 excluded)
Population who did not answer MMSE at 1st, 6th waves (191 excluded)
Exclusion of missing values on characteristics data (1,140 excluded)
K-MMSE scores from 2006 to 2016.
Weight variability
Two methods were used to define weight variability: body-weight variability, and self-reported changes in weight. Measures of weight variability were assessed first, including the average successive vari- ability (ASV). ASV was defined as individual variability in body weight between three visits. ASV in this study was defined as the absolute difference between successive values.
15The predictor vari- ables were introduced as categorical variable (quintiles). ASV quin- tiles were defined as follows: Q1 was the quintile that had the least changes in BMI (mean, 0.20) and Q5 was the quintile that had the greatest changes in BMI (mean, 2.69). Self-reported weight chang- es were used as the second parameter for assessment. The predictor variables were calculated based on the questionnaire lists (from the 2006, 2010, and 2012 waves) and participants were asked whether there was a change of over 5 kg in body weight during the past year.
The values from self-reported weight changes were used to assess self-awareness of weight changes.
Covariates
Additional covariates were collected from the 2006 survey. The socio-demographic variables included ages (45–54 years, 55–64 years, or > 65 years), sex (male or female), marital status (married or un- married), education status (elementary school, middle school, high school, or college and higher), equalized household income quar- tiles, health insurance status (Medicaid or National Health Insur- ance), and location of residence (urban or rural). The analysis ad- justed for health behaviors, such as smoking (ever or never), drink- ing (current or not current) and physical activity (regularly or not regularly). In addition, health status was assessed using the follow- ing variables: chronic disease status included hypertension, diabe- tes, cancer, chronic obstruction pulmonary disease, liver disease, cardiac disease, neurovascular disease, psychiatric illness, arthritis and prostate disease (none or one or more events) and depression symptoms (based on the Center for Epidemiological Studies De- pression Scale: fewer than four or four or more symptoms).
Statistical analysis
To assess the association between weight variability and cognitive
impairment, we evaluated cognitive decline on a continuous scale by using the change in the K-MMSE scored from 2006 to 2016.
Multivariable logistic regressions were performed to assess cogni- tive impairments in 2016 (mild cognitive impairment and demen- tia), linear regressions were performed to assess the outcome of changes in the K-MMSE scores from 2006 to 2016 and estimated adjusted odds ratios (aORs). Multilevel analysis was performed to assess weight variability, based on measurements at three waves (2006, 2008, and 2010). We calculated ASV with BMI and the val- ues provided in the self-reported weight changes. We selected nor- mal K-MMSE scores at baseline to assess cognitive impairment and calculated the K-MMSE score changes in the 2016 wave.
For all analyses, Stata version 14 (StataCorp., College Station, TX, USA) was used, and the level of significance was set as 0.05 (two-sided). Longitudinal sampling BMI was employed and clus- tered standard error was estimated.
16All participants were required to read and sign an agreement form before participating in the KLoSA study. The requirement for approval for this study for using human subjects was waived by the Institutional Review Board at the Seoul National University Hospital because this study used publicly available de-identified data.
RESULTS Descriptive statistics
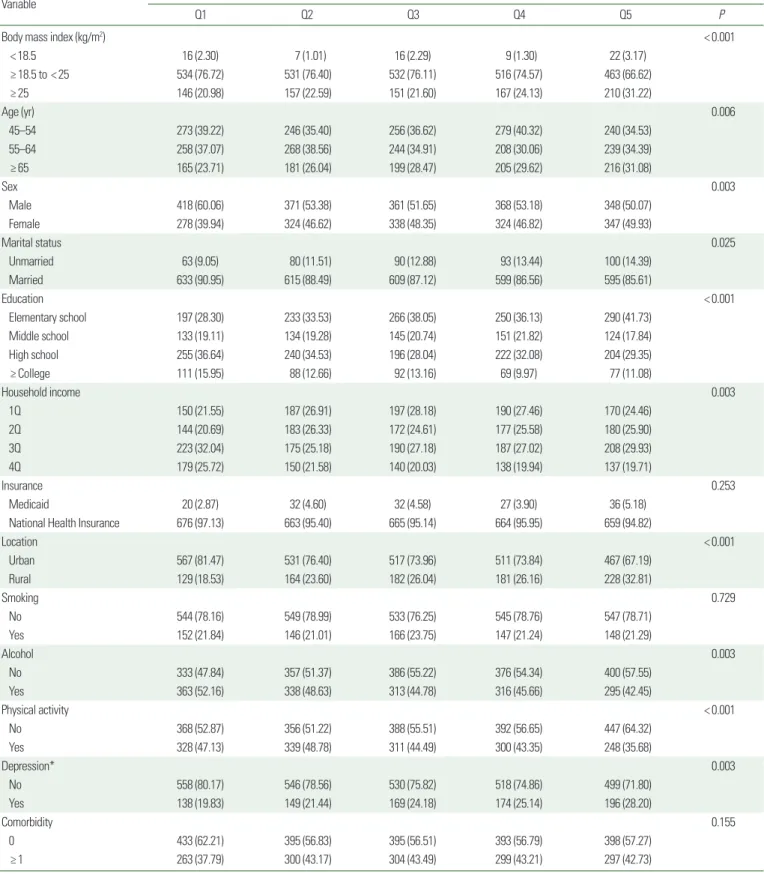
Table 1 shows demographic and clinical characteristics of the study participants at baseline. The average (± standard deviation) baseline BMI was 23.43 (± 0.04), and there was no significant dif- ference between the groups at baseline for BMI (Q1, 23.25± 0.09;
Q2, 23.45± 0.09; Q3, 23.28± 0.10; Q4, 23.53± 0.09; Q5, 23.67±
0.11). Across the age groups, the oldest group (aged ≥ 65 years)
had the largest proportion of the most BMI changes (Q5), and the
fewest BMI changes (Q1) were identified in this population. Inter-
estingly, the proportions of ASV differed by sex. The largest pro-
portion of Q1 was identified in men, whereas that of Q5 was in
women. Furthermore, the proportions of ASV differed significantly
between lifestyles. Alcohol consumption (52.16%) and physical
activity (47.13%) were associated with the lowest amounts of BMI
change, whereas smoking was not associated with BMI change.
Table 1. Descriptive characteristics of the study population
Variable Average successive variability (n= 3,477)
Q1 Q2 Q3 Q4 Q5 P
Body mass index (kg/m2) < 0.001
< 18.5 16 (2.30) 7 (1.01) 16 (2.29) 9 (1.30) 22 (3.17)
≥ 18.5 to < 25 534 (76.72) 531 (76.40) 532 (76.11) 516 (74.57) 463 (66.62)
≥ 25 146 (20.98) 157 (22.59) 151 (21.60) 167 (24.13) 210 (31.22)
Age (yr) 0.006
45–54 273 (39.22) 246 (35.40) 256 (36.62) 279 (40.32) 240 (34.53)
55–64 258 (37.07) 268 (38.56) 244 (34.91) 208 (30.06) 239 (34.39)
≥ 65 165 (23.71) 181 (26.04) 199 (28.47) 205 (29.62) 216 (31.08)
Sex 0.003
Male 418 (60.06) 371 (53.38) 361 (51.65) 368 (53.18) 348 (50.07)
Female 278 (39.94) 324 (46.62) 338 (48.35) 324 (46.82) 347 (49.93)
Marital status 0.025
Unmarried 63 (9.05) 80 (11.51) 90 (12.88) 93 (13.44) 100 (14.39)
Married 633 (90.95) 615 (88.49) 609 (87.12) 599 (86.56) 595 (85.61)
Education < 0.001
Elementary school 197 (28.30) 233 (33.53) 266 (38.05) 250 (36.13) 290 (41.73)
Middle school 133 (19.11) 134 (19.28) 145 (20.74) 151 (21.82) 124 (17.84)
High school 255 (36.64) 240 (34.53) 196 (28.04) 222 (32.08) 204 (29.35)
≥ College 111 (15.95) 88 (12.66) 92 (13.16) 69 (9.97) 77 (11.08)
Household income 0.003
1Q 150 (21.55) 187 (26.91) 197 (28.18) 190 (27.46) 170 (24.46)
2Q 144 (20.69) 183 (26.33) 172 (24.61) 177 (25.58) 180 (25.90)
3Q 223 (32.04) 175 (25.18) 190 (27.18) 187 (27.02) 208 (29.93)
4Q 179 (25.72) 150 (21.58) 140 (20.03) 138 (19.94) 137 (19.71)
Insurance 0.253
Medicaid 20 (2.87) 32 (4.60) 32 (4.58) 27 (3.90) 36 (5.18)
National Health Insurance 676 (97.13) 663 (95.40) 665 (95.14) 664 (95.95) 659 (94.82)
Location < 0.001
Urban 567 (81.47) 531 (76.40) 517 (73.96) 511 (73.84) 467 (67.19)
Rural 129 (18.53) 164 (23.60) 182 (26.04) 181 (26.16) 228 (32.81)
Smoking 0.729
No 544 (78.16) 549 (78.99) 533 (76.25) 545 (78.76) 547 (78.71)
Yes 152 (21.84) 146 (21.01) 166 (23.75) 147 (21.24) 148 (21.29)
Alcohol 0.003
No 333 (47.84) 357 (51.37) 386 (55.22) 376 (54.34) 400 (57.55)
Yes 363 (52.16) 338 (48.63) 313 (44.78) 316 (45.66) 295 (42.45)
Physical activity < 0.001
No 368 (52.87) 356 (51.22) 388 (55.51) 392 (56.65) 447 (64.32)
Yes 328 (47.13) 339 (48.78) 311 (44.49) 300 (43.35) 248 (35.68)
Depression* 0.003
No 558 (80.17) 546 (78.56) 530 (75.82) 518 (74.86) 499 (71.80)
Yes 138 (19.83) 149 (21.44) 169 (24.18) 174 (25.14) 196 (28.20)
Comorbidity 0.155
0 433 (62.21) 395 (56.83) 395 (56.51) 393 (56.79) 398 (57.27)
≥ 1 263 (37.79) 300 (43.17) 304 (43.49) 299 (43.21) 297 (42.73)
Values are presented as number (%).
*The Center for Epidemiologic Studies-depression 10-item scale ≥ 4 (yes), < 4 (no).
Weight variability and cognitive impairment
Table 2 presents the association between weight variability and overall cognitive impairment among all participants. Q1 was the quartile with the least amount of changes in BMI (mean, 0.20) and Q5 was the quintile with the greatest number of changes in BMI (mean, 2.69). Model 4 shows the estimates of aORs for Q2 (aOR, 1.32; 95% confidence interval [CI], 0.94–1.86), Q3 (aOR, 1.41;
95% CI, 1.00–1.99), Q4 (aOR, 1.46; 95% CI, 1.04–2.05), and Q5 (aOR, 1.52; 95% CI, 1.08–2.14) categories showed a linear trend in the risk of cognitive impairment (P for trend=0.016). A statisti- cally significant association was observed between weight variabili- ty and development of mild cognitive impairment (K-MMSE
≤ 23), although a significant association was not noted for severe cognitive impairment (K-MMSE≤ 17).
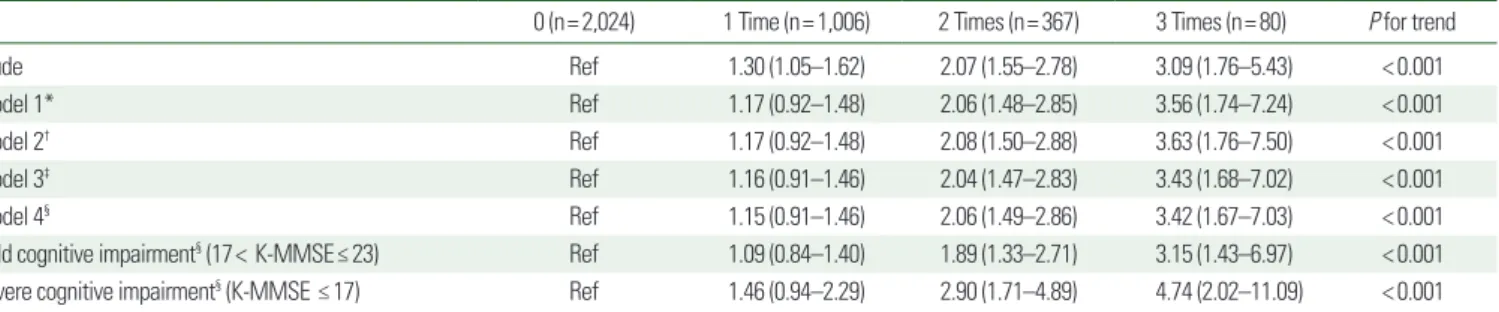
The relationship between self-awareness of weight variability and cognitive impairment were also assessed, and then self-awareness of weight variability was assessed based on a self-administered
questionnaire and cognitive function (Table 3). An increased fre- quency of changes in body weight was associated with mild cogni- tive impairment (K-MMSE≤ 23) and severe cognitive impairment (K-MMSE≤ 17) during the third follow-up. A linear trend was ob- served when the risk of mild cognitive impairment and severe cog- nitive impairment were assessed (P for trend<0.001).
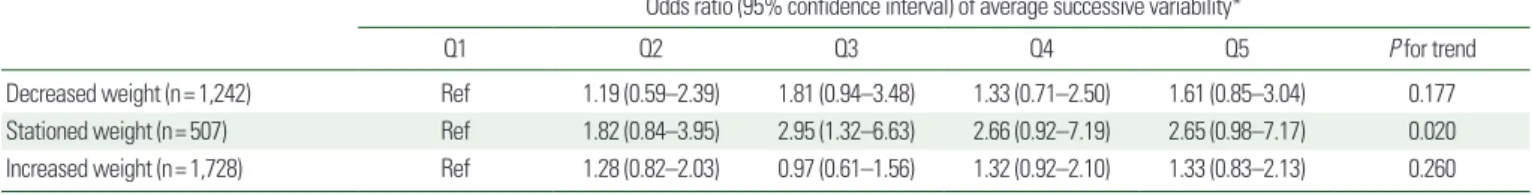
Changes in cognitive function according to weight status
Tables 4 and 5 presents the association between weight changes and cognitive function according to weight status. There was no statistically significant increase or decrease in final weight, but in the group that maintained their weight, weight variability was associated with cognitive impairment (P for trend=0.02). In comparison, self-awareness about weight change was significantly associated with cognitive impairment regardless of final weight (P for trend
< 0.001, 0.023, and 0.002).
Table 2. Adjusted odds ratios of average successive variability for cognitive impairment in Korean adults ≥ 45 years of age
Q1 Q2 Q3 Q4 Q5 P for trend
Weight variability 0.20± 0.13 0.56± 0.09 0.90± 0.11 1.42± 0.20 2.69± 0.88
Crude Ref 1.45 (1.06–2.00) 1.58 (1.16–2.16) 1.67 (1.22–2.28) 1.97 (1.45–2.68) < 0.001
Model 1* Ref 1.32 (0.94–1.86) 1.41 (1.00–2.00) 1.48 (1.05–2.08) 1.56 (1.11–2.20) 0.010
Model 2† Ref 1.33 (0.95–1.87) 1.42 (1.00–2.01) 1.48 (1.05–2.08) 1.55 (1.10–2.18) 0.012
Model 3‡ Ref 1.32 (0.94–1.86) 1.41 (1.00–1.99) 1.46 (1.04–2.05) 1.52 (1.08–2.14) 0.017
Model 4§ Ref 1.32 (0.94–1.86) 1.41 (1.00–1.99) 1.46 (1.04–2.05) 1.52 (1.08–2.14) 0.016
Mild cognitive impairment§ (17< K-MMSE ≤ 23) Ref 1.24 (0.85–1.79) 1.37 (0.94–1.99) 1.40 (0.98-2.02) 1.46 (1.01–2.11) 0.032 Severe cognitive impairment§ (K-MMSE ≤ 17) Ref 1.76 (0.95–3.28) 1.62 (0.86–3.04) 1.67 (0.86–3.26) 1.83 (0.97–3.49) 0.126 Values are presented as mean± standard deviation or odds ratio (95% confidence interval).
*Model 1: adjusted for sex, age, marital status, education level, income, health insurance, living place; †Model 2: Model 1+smoking, alcohol, physical activity; ‡Model 3: Model 2+co- morbidity, depression; §Model 4: Model 3+body mass index.
K-MMSE, Korean version of the Mini-Mental State Examination.
Table 3. Adjusted odds ratios for self-awareness of weight change values for cognitive impairment in Korean adults ≥ 45 years of age
0 (n= 2,024) 1 Time (n= 1,006) 2 Times (n= 367) 3 Times (n= 80) P for trend
Crude Ref 1.30 (1.05–1.62) 2.07 (1.55–2.78) 3.09 (1.76–5.43) < 0.001
Model 1* Ref 1.17 (0.92–1.48) 2.06 (1.48–2.85) 3.56 (1.74–7.24) < 0.001
Model 2† Ref 1.17 (0.92–1.48) 2.08 (1.50–2.88) 3.63 (1.76–7.50) < 0.001
Model 3‡ Ref 1.16 (0.91–1.46) 2.04 (1.47–2.83) 3.43 (1.68–7.02) < 0.001
Model 4§ Ref 1.15 (0.91–1.46) 2.06 (1.49–2.86) 3.42 (1.67–7.03) < 0.001
Mild cognitive impairment§ (17< K-MMSE≤ 23) Ref 1.09 (0.84–1.40) 1.89 (1.33–2.71) 3.15 (1.43–6.97) < 0.001 Severe cognitive impairment§ (K-MMSE ≤ 17) Ref 1.46 (0.94–2.29) 2.90 (1.71–4.89) 4.74 (2.02–11.09) < 0.001 Values are presented as odds ratio (95% confidence interval).
*Model 1: adjusted for sex, age, marital status, education level, income, health insurance, living place; †Model 2: Model 1+smoking, alcohol, physical activity; ‡Model 3: Model 2+co- morbidity, depression; §Model 4: Model 3+body mass index.
K-MMSE, Korean version of the Mini-Mental State Examination.
DISCUSSION
The purpose of this study was to investigate the relationship be- tween the extent of BMI change and cognitive impairment among a nationally representative sample of adults that were greater than 45 years of age. Our results suggested that large BMI changes were related to cognitive impairment. This relationship was also observed with the ASV of weight and self-awareness of the frequency of BMI changes.
Previous studies have found that obesity in mid-life is an impor- tant predictor of reduced cognitive performance, dementia, and Al- zheimer disease in later life.
1,17-19Several studies have reported that weight loss precedes cognitive decline and impairment.
20-22Howev- er, there are only a limited number of studies that have assessed the relationship between changes in weight and cognitive function. Our results add new evidence which support that weight change, inde- pendent of baseline BMI, is significantly associated with the devel- opment of overall cognitive impairment. This finding has valuable implications for developing preventive strategies for cognitive im- pairment.
Although many studies have assessed weight change and cogni- tive function and suggested various mechanisms for the associa- tion, the relationship between the two is still unclear. Studies have investigated the relationship between the brain and obesity, which is related to the volume of gray and white matter. Obesity is sug-
gested to be positively related to the process of increasing myelin and white matter volume.
23On the other hand, obesity is associat- ed with decreased grey matter volume in the orbitofrontal cortex and right cerebellum.
24Other mechanisms include systemic inflammation and disrup- tion of the metabolic system. Obesity is associated with systemic inflammation, which is associated with elevated levels of C-reactive protein, tumor necrosis factor, and serum amyloid A. These inflam- matory markers affect cognitive impairment.
25-27Further, the insu- lin resistance observed in obese individuals is associated with cog- nitive function because insulin helps to regulate brain function and cognitive processes. Individuals with insulin resistance, such as those who are obese, are more likely to develop Alzheimer disease and individuals with Alzheimer disease are more likely to have in- creased plasma insulin.
28,29Additionally, BMI may have different effects based on age, sex, income groups, comorbidities and depression.
30Especially in age- related studies, obesity has been noted to have a positive effect, whereas weight loss has a poor impact on cognitive function.
20Similarly, a systematic review has found that overweight individuals and those who are mildly obese are protected against mortality.
31These findings indicate that future research and interventions should critically assess these issues.
The present study had several limitations. First, because all weight measurements were self-reported, if overweight and obese adults
Table 4. Adjusted odds ratios for cognitive impairment of average successive variabilityOdds ratio (95% confidence interval) of average successive variability*
Q1 Q2 Q3 Q4 Q5 P for trend
Decreased weight (n= 1,242) Ref 1.19 (0.59–2.39) 1.81 (0.94–3.48) 1.33 (0.71–2.50) 1.61 (0.85–3.04) 0.177
Stationed weight (n= 507) Ref 1.82 (0.84–3.95) 2.95 (1.32–6.63) 2.66 (0.92–7.19) 2.65 (0.98–7.17) 0.020
Increased weight (n= 1,728) Ref 1.28 (0.82–2.03) 0.97 (0.61–1.56) 1.32 (0.92–2.10) 1.33 (0.83–2.13) 0.260
*Adjusted for sex, age, marital status, education level, income, health insurance, living place, smoking, alcohol, physical activity, comorbidity, depression, and body mass index.
Table 5. Adjusted odds ratios for cognitive impairment of self-aware about weight change number
Odds ratio (95% confidence interval) of self-aware about weight change number*
0 (n= 2,024) 1 time (n= 1,006) 2 times (n= 367) 3 times (n= 80) P for trend
Decreased weight (n= 1,242) Ref 0.90 (0.56–1.43) 2.63 (1.45–4.77) 8.50 (2.53–28.48) < 0.001
Stationed weight (n= 507) Ref 2.25 (1.21–4.15) 1.61 (0.60–4.33) 2.87 (0.71–11.62) 0.023
Increased weight (n= 1,728) Ref 1.14 (0.83–1.57) 1.91 (1.23–2.96) 2.16 (0.96–4.87) 0.002
*Adjusted for sex, age, marital status, education level, income, health insurance, living place, smoking, alcohol, physical activity, comorbidity, depression, and body mass index.