Association between Abdominal Obesity and
Cardiovascular Risk Factors in Adults with Normal Body Mass Index: Based on the Sixth Korea National Health and Nutrition Examination Survey
Hye Yun Kim
1, Jae Kyung Kim
1, Gook Gyeon Shin
1, Jin Ah Han
1, Jin Wook Kim
1,2,*
1
Department of Family Medicine, Obesity and Metabolic Disease Center, Seongnam Central Hospital, Seongnam;
2Department of Family Medicine, Korea University College of Medicine, Seoul, Korea
Background: Abdominal obesity predisposes individuals to cardiovascular disease, but the data in adults with normal body mass index (BMI) are relatively rare. This study aimed to evaluate the characteristics of subjects with normal BMI and abdominal obesity and to identify the relationship between central obesity and cardiovas- cular risk factors in normal BMI adults in Korea.
Methods: Ten thousands six hundred thirty-four adults with BMI between 18.5 to 24.9 kg/m
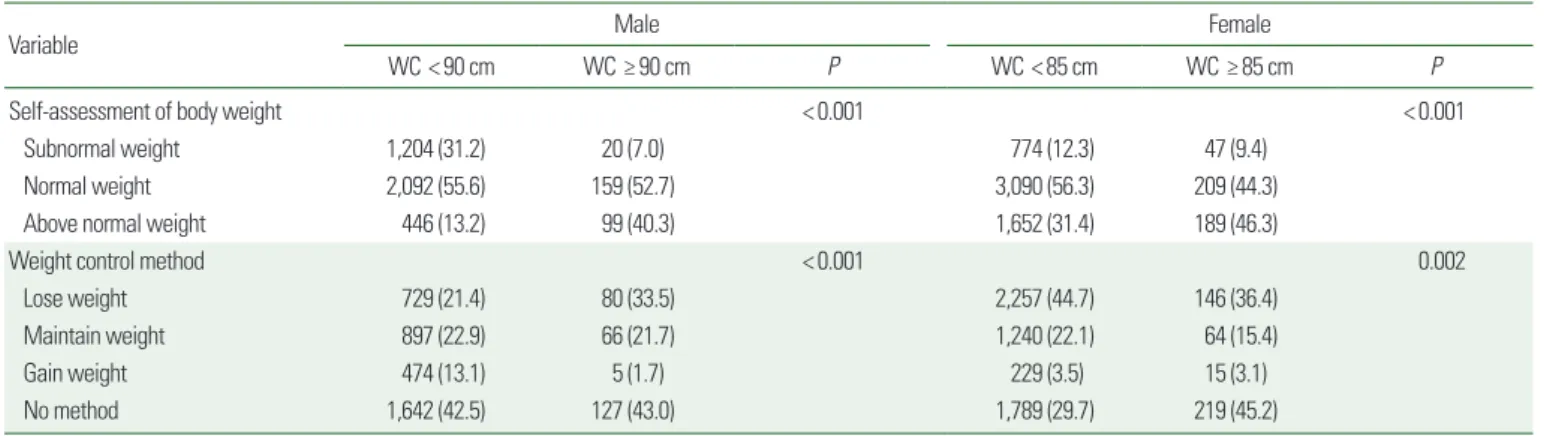
2who participated in the sixth Korea National Health and Nutrition Examination Survey were included. Abdominal obesity was de- fined as a waist circumference of ≥90 cm in males and ≥85 cm in females. Through logistic regression, we ana- lyzed the factors influencing abdominal obesity and the relationship between abdominal obesity and cardio- vascular risk factors.
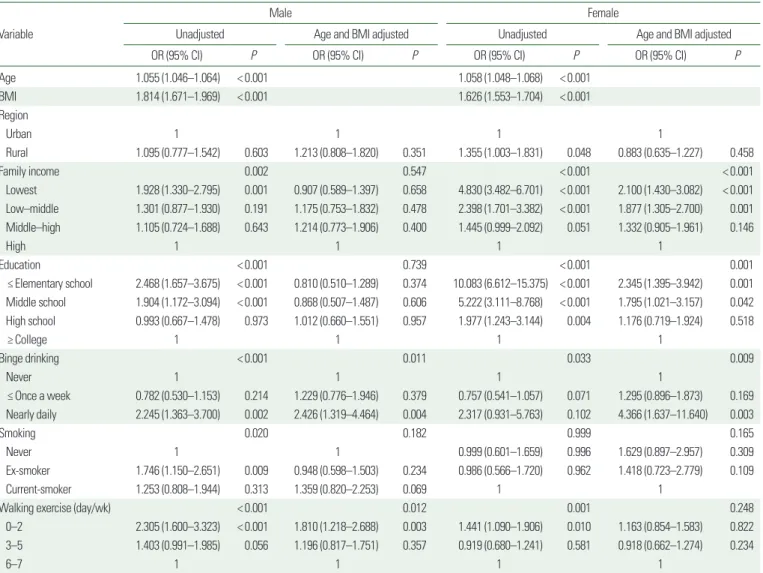
Results: The prevalence of abdominal obesity in adults with normal BMI was 6.9% for males and 7.7% for fe- males, and this prevalence tended to increase with age. When adjusted for age and BMI, daily excessive alcohol consumption increased the risk of abdominal obesity in adults of normal weight. Women with lower socioeco- nomic status and men in need of walking exercise also had a higher risk of abdominal obesity. In the model ad- justed for age and BMI, abdominal obesity was associated with fasting glucose intolerance and diabetes in men and hypertriglyceridemia and low high-density lipoprotein cholesterol in women.
Conclusion: Cardiovascular risk factors were associated with abdominal obesity in Korean adults with normal BMI. These results suggest that more careful management of abdominal obesity in those with normal weight is necessary.
Key words: Normal body weight, Abdominal obesity, Cardiovascular disease risk factors
Received June 28, 2019 Reviewed August 7, 2019 Accepted October 25, 2019
* Corresponding author Jin Wook Kim
https://orcid.org/0000-0001-9584-0974 Department of Family Medicine, Obesity and Metabolic Disease Center, Seongnam Central Hospital, 12 Sanseong-daero 476beon-gil, Jungwon-gu, Seongnam 13161, Korea Tel: +82-31-799-5541
Fax: +82-31-744-8994 E-mail: [email protected]
INTRODUCTION
Obesity is defined as a state of abnormal or excessive accumula- tion of adipose tissue that leads to health risks. Body mass index (BMI) was used to define the criteria for obesity.
1However, studies have reported that BMI may not accurately predict actual fat mass
if the value is below 30.0 kg/m
2.
2Moreover, recent studies have shown that abdominal obesity, rather than obesity simply defined by BMI, is more highly correlated with cardiovascular and meta- bolic diseases. According to studies in the United States and Canada, individuals with normal BMI and abdominal obesity showed high- er risks of cardiovascular diseases compared to individuals classi-
Copyright © 2019 Korean Society for the Study of Obesity
This is an Open Access article distributed under the terms of the Creative Commons Attribution Non-Commercial License (http://creativecommons.org/licenses/by-nc/4.0/) which permits unrestricted non-commercial use, distribution, and reproduction in any medium, provided the original work is properly cited.
2017-03-16 https://crossmark-cdn.crossref.org/widget/v2.0/logos/CROSSMARK_Color_square.svg
Association between Abdominal Obesity and
Cardiovascular Risk Factors in Adults with Normal Body Mass Index: Based on the Sixth Korea National Health and Nutrition Examination Survey
Hye Yun Kim
1, Jae Kyung Kim
1, Gook Gyeon Shin
1, Jin Ah Han
1, Jin Wook Kim
1,2,*
1