서 론
우울은 유병률과 질병 부담이 높은 질환으로 이로 인한 사회경제 적 비용이 매년 급격히 증가하는 것으로 보고되고 있다.1) 세계보건 기구(World Health Organization)는 전 세계적으로 우울로 야기되는 부담이 점차 증가하고 있고 2030년에는 가장 질병부담이 큰 질환이
될 것으로 전망하고 있다.2) 한국 일반 성인의 주요 정신질환실태를 파악하기 위해 5년마다 실시되는 정신질환 역학조사에 따르면 2011 년 우울증의 평생 유병률이 6.7%였으며 기존의 조사에 비해 높아졌 다.3) 우울증은 개인의 일상적인 업무를 다루는 능력에 상당한 장애 를 초래할 수 있으며 심지어 자살로 이어질 수도 있다.4)
체중과 우울증의 관계에 관한 연구들은 많지만 결과들은 다양하
Received May 29, 2018 Revised July 19, 2018 Accepted November 2, 2018
Corresponding author Dae Hyun Kim Tel: +82-53-250-7263, Fax: +82-53-250-7071 E-mail: [email protected]
ORCID: http://orcid.org/0000-0002-7313-2384
Copyright © 2019 The Korean Academy of Family Medicine
This is an open-access article distributed under the terms of the Creative Commons At- tribution Non-Commercial License (http://creativecommons.org/licenses/by-nc/4.0) which permits unrestricted noncommercial use, distribution, and reproduction in any medium, provided the original work is properly cited.
Original Article
https://doi.org/10.21215/kjfp.2019.9.2.127 eISSN 2233-9116
Korean J Fam Pract. 2019;9(2):127-132
Korean Journal of Family Practice
KJFP
한국 성인에서 체질량지수에 따른 우울증 발생과의 관계: 고령화 연구 패널 조사를 이용하여
박노철, 김나연, 허정화, 홍승완, 서영성, 김대현*
계명대학교 의과대학 가정의학과교실
The Association between the Body Mass Index and the Incidence of Depression in Korean Adults:
Result from the Korean Longitudinal Study
No Cheol Park, Na Yeon Kim, Jeong Hwa Heo, Seung Wan Hong, Young Sung Suh, Dae Hyun Kim*
Department of Family Medicine, School of Medicine, Keimyung University, Daegu, Korea
Background: Several conflicting studies exist on the relationship between body mass index (BMI) and depression. We investigated the effect of BMI on the development of depression in adults aged 45 years and older using the Korean Longitudinal Study of Aging Study (KLoSA).
Methods: The data from the wave 1 (2006), wave 2 (2008), wave 3 (2010), wave 4 (2012), and wave 5 (2014) database of the Korean Longitudinal Study on Aging (KLoSA) were analyzed. Depression was assessed using the Center for Epidemiologic Studies Depression Scale-10. To investigate the relationship between BMI and depression, ANOVA and chi-square test was used. Kaplan-Meier survival curves were generated, and Cox proportional hazard regression modeling was used to estimate the risk of depression according to obesity status, by controlling for age, sex, and health-related, lifestyle, and socioeconomic variables.
Results: This study included 6,811 individuals who were not found to have depression in the first survey. The incidence of depression was the highest in the underweight group (underweight, 74.3%; normal, 63.1%; overweight, 59.5%; obese, 63.0%; severe obese, 59.9%, P<0.001). The risk of depression was significantly lower in the overweight and severe obese groups than in the underweight group after adjusting for age, sex, and demographic, social, and physical factors (overweight: hazard ratio [HR]=0.872, 95% confidence interval [CI]=0.775–0.981; severe obese: HR=0.791, 95% CI=0.648–0.966).
Conclusion: The incidence of depression was the highest in the underweight group. The risk of depression was higher in the underweight group than in the overweight and severe obese groups.
Keywords: Depression; Body Mass Index; Aging
No Cheol Park, et al. The Association between the Body Mass Index and Depression
Korean Journal of Family Practice
KJFP
다. 체중과 우울증의 관계에 대한 일부 연구들은 체중이 증가할수 록 우울증이 증가하는 양의 상관관계를 보여주고 있지만,5-8) 다른 연 구들에서는 역의 상관관계를 보여주기도 한다.9-14)
또한, 다른 대부분의 연구들은 발병률보다는 유병률을 보고하였 다. 유병률은 전체 인구 중 특정한 장애나 질병 또는 심리 신체적 상 태를 지니고 있는 사람들의 분율이고 발병률은 질병의 새로운 발생 을 정량화한 것이다. Eaton 등15)의 연구에서는 주요 우울 장애는 첫 번째 에피소드 이후 35%에서 재발하고 이들 중 약 절반 정도가 회복 한다고 하였다. 이러한 측면에서 유병률 측정의 문제점은 현재의 우 울증이 과거의 우울증으로 인한 재발인지 체중 상태와 같은 다른 요 인들에 의한 것인지 구분하기 힘들다는 것이다.
그리고 대부분의 연구들은 주로 비만과 우울증 사이에 초점을 맞 추고 있다. 하지만 본 연구에서는 체질량지수(body mass index, BMI) 를 기준으로 저체중 그룹, 정상 그룹, 과체중 그룹, 비만 그룹, 고도비 만 그룹으로 분류했다. 이 연구는 우리나라 45세 이상 성인을 대표 하는 고령화 연구 패널 조사(Korean Longitudinal Study of Aging, KLoSA)를 이용하여 BMI에 따른 우울증 발생과의 관계를 분석하였 다.
방 법
1. 연구대상
본 연구는 노동부의 고령화 연구 패널 조사(KLoSA) 1차, 2차, 3차, 4차, 5차년도 자료를 활용하였다. KLoSA는 제주도를 제외한 우리나 라에 거주하는 45세 이상 성인들을 대상으로 사회적 관계, 건강, 경 제 상태를 조사한 자료로서 2006년부터 자료수집을 시작하여 2년 간격으로 동일한 응답자를 추적 조사한 자료이다. KLoSA에 포함된 한국인들은 컴퓨터를 이용한 대인 면접(computer assisted personal interviewing)을 통하여 인구사회학적 요인, 생활건강 요인과 신체 정 신 요인 그리고 우울 관련 요인을 수집하였다. 본 연구에서는 2006년 1차 조사에 참여한 45세 이상 성인 10,254명 중, Center for Epidemio- logical Studies Depression Scale (CESD)-10 점수를 기준으로 우울증이 없다고 판단된 6,811명을 연구 분석하였다.
2. 변수측정 1) 우울
우울은 표준화된 CESD 10개 문항을 사용하여 측정했다.16,17) CESD-10은 지난 일주일간 본인의 느낌과 행동에 대한 10가지 문항 의 질문에 대해 yes, no의 응답으로 데이터를 처리하였고 임계치인 4 점 이상이면 우울증이 있는 것으로 판단하였다.18) 본 연구는 우울증
이 없는 사람들에게서 우울증 발생을 보기 위한 연구로 1차 조사에 서 우울증이 있다고 판단된 3,443명의 참가자들은 제외되었다. 그리 하여 1차 조사의 총 10,254명 중 우울 증상이 없다고 판단된 6,811명 을 대상으로 분석하였다.
2) 신체측정 및 체질량지수
체중 상태는 자가 보고된 키와 몸무게에 기초하였고, 체질량지수 (BMI)는 몸무게(kg)를 키의 제곱(m2)으로 나누어 계산하였다. 이 연 구에서 조사 대상자들을 World Health Organization Western Pacific Region suggested revised Asia-Pacific criteria에 따라 저체중 그룹, 정상 그룹, 과체중 그룹, 비만 그룹, 고도비만 그룹으로 분류하였다(각각, 18.5 이하, 18.6–22.9, 23.0–24.9, 25.0–29.9, 30 초과).19)
3) 인구사회학적 요인
나이, 성별, 교육 정도, 배우자 유무, 고용상태를 조사하였다. 교육 정도는 초등학교 졸업 이하, 중학교 졸업, 고등학교 졸업 이상의 세 그룹으로 범주화하였다. 배우자와의 관계는 배우자와 함께 사는지 여부로 나누었다. 고용 상태는 현재 고용되어 근로하는지를 확인하 였다.
4) 생활건강 요인
흡연과 음주, 고혈압, 당뇨 유병 여부를 조사하였다. 흡연은 현재 담배를 피우고 있으면 현재 흡연자로, 과거 5갑 이상 담배를 피운 적 이 있으면 과거 흡연자로, 5갑 이상 피운 적이 없으면 비흡연자로 구 분하여 현재 흡연자를 한 그룹으로, 과거 흡연자와 비흡연자를 다른 그룹으로 구성하였다. 음주는 현재 술을 마시는 경우 음주자로, 술 을 끊은 경우와 술을 마시지 않는 경우 비음주자로 구분하였다. 고 혈압과 당뇨병은 의사로부터 진단을 받았는지 아닌지로 구분하였 다.
5) 신체 정신 요인
인지 기능, 평소 운동 여부, 주관적 건강 상태를 조사하였다. 인지 기능은 한국판 간이 정신 상태 검사(Korean version of the mini-men- tal state examination-Korea)를 이용하여 평가하였으며 점수가 23점 이하일 경우 인지 기능 저하 그룹, 점수가 24점 이상일 경우 인지 기 능 정상 그룹으로 나누었다.20) 평소 운동을 1주일에 1회 이상 했을 경 우 “예”, 그렇지 않을 경우 “아니오”로 분류하였다. 주관적 건상 상태 는 “매우 좋음”, “좋은 편”, “보통”을 한 그룹으로, “나쁜 편”, “매우 나쁨”
을 다른 그룹으로 구성하였다.
박노철 외. 한국 성인에서 체질량지수에 따른 우울증 발생과의 관계 Korean Journal of Family Practice
KJFP
3. 분석방법
대상자들을 BMI에 따라 저체중, 정상, 과체중, 비만, 고도비만 그 룹으로 나누어 나이, 성별, 교육 정도, 배우자 유무, 고용 상태, 흡연 및 음주 여부, 고혈압 및 당뇨병 여부, 인지 기능, 평소 운동 여부, 주 관적 건강 상태의 차이를 비교하기 위해 카이제곱 검정 및 일원 배치 분산분석(ANOVA)을 시행하였다.
그리고 BMI와 시간에 따른 우울증 발생 빈도를 분석하기 위해 Kaplan-Meier 생존 분석을 이용하였다. 그런 다음 Cox의 회귀 모형을 사용하여 BMI에 따른 우울증 발생 위험비(hazard ratio, HR)를 계산 하였다. 세 가지 모델을 이용하였으며, 모델 1은 아무것도 보정하지 않았고, 모델 2는 나이와 성별을, 모델 3에서는 나이, 성별 및 인구사
회학적 요인, 건강 요인, 신체 정신 요인을 보정하였다.
통계분석은 IBM SPSS Statistics ver. 21.0 (IBM Co., Armonk, NY, USA)을 사용하였으며 통계적 유의수준은 0.05 미만으로 하였다.
결 과
1. 연구 대상자의 일반적 특성
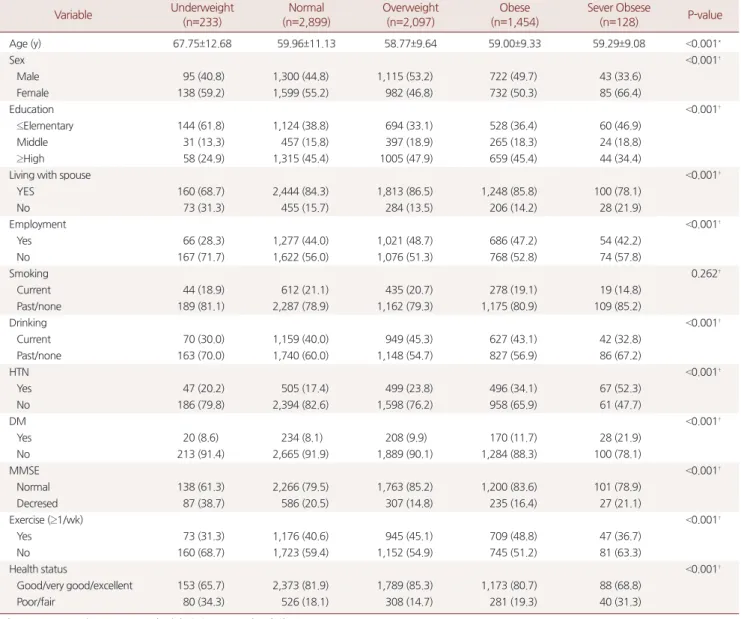
Table 1은 연구 대상자의 기본적 특성을 나타내었다. 총 6,811명이 연구에 포함되었고 저체중 그룹 233명, 정상 그룹 2,899명, 과체중 그 룹 2,097명, 비만 그룹 1,454명, 고도비만 그룹 128명으로 분류되었다.
평균 나이는 저체중 그룹이 67.75세, 정상 그룹 59.96세, 과체중 그룹
Table 1. General characteristics of study subjects (n=6,811)
Variable Underweight
(n=233)
Normal (n=2,899)
Overweight (n=2,097)
Obese (n=1,454)
Sever Obsese
(n=128) P-value
Age (y) 67.75±12.68 59.96±11.13 58.77±9.64 59.00±9.33 59.29±9.08 <0.001*
Sex <0.001†
Male 95 (40.8) 1,300 (44.8) 1,115 (53.2) 722 (49.7) 43 (33.6)
Female 138 (59.2) 1,599 (55.2) 982 (46.8) 732 (50.3) 85 (66.4)
Education <0.001†
≤Elementary 144 (61.8) 1,124 (38.8) 694 (33.1) 528 (36.4) 60 (46.9)
Middle 31 (13.3) 457 (15.8) 397 (18.9) 265 (18.3) 24 (18.8)
≥High 58 (24.9) 1,315 (45.4) 1005 (47.9) 659 (45.4) 44 (34.4)
Living with spouse <0.001†
YES 160 (68.7) 2,444 (84.3) 1,813 (86.5) 1,248 (85.8) 100 (78.1)
No 73 (31.3) 455 (15.7) 284 (13.5) 206 (14.2) 28 (21.9)
Employment <0.001†
Yes 66 (28.3) 1,277 (44.0) 1,021 (48.7) 686 (47.2) 54 (42.2)
No 167 (71.7) 1,622 (56.0) 1,076 (51.3) 768 (52.8) 74 (57.8)
Smoking 0.262†
Current 44 (18.9) 612 (21.1) 435 (20.7) 278 (19.1) 19 (14.8)
Past/none 189 (81.1) 2,287 (78.9) 1,162 (79.3) 1,175 (80.9) 109 (85.2)
Drinking <0.001†
Current 70 (30.0) 1,159 (40.0) 949 (45.3) 627 (43.1) 42 (32.8)
Past/none 163 (70.0) 1,740 (60.0) 1,148 (54.7) 827 (56.9) 86 (67.2)
HTN <0.001†
Yes 47 (20.2) 505 (17.4) 499 (23.8) 496 (34.1) 67 (52.3)
No 186 (79.8) 2,394 (82.6) 1,598 (76.2) 958 (65.9) 61 (47.7)
DM <0.001†
Yes 20 (8.6) 234 (8.1) 208 (9.9) 170 (11.7) 28 (21.9)
No 213 (91.4) 2,665 (91.9) 1,889 (90.1) 1,284 (88.3) 100 (78.1)
MMSE <0.001†
Normal 138 (61.3) 2,266 (79.5) 1,763 (85.2) 1,200 (83.6) 101 (78.9)
Decresed 87 (38.7) 586 (20.5) 307 (14.8) 235 (16.4) 27 (21.1)
Exercise (≥1/wk) <0.001†
Yes 73 (31.3) 1,176 (40.6) 945 (45.1) 709 (48.8) 47 (36.7)
No 160 (68.7) 1,723 (59.4) 1,152 (54.9) 745 (51.2) 81 (63.3)
Health status <0.001†
Good/very good/excellent 153 (65.7) 2,373 (81.9) 1,789 (85.3) 1,173 (80.7) 88 (68.8)
Poor/fair 80 (34.3) 526 (18.1) 308 (14.7) 281 (19.3) 40 (31.3)
Values are presented as mean±standard deviation or number (%).
*P-value by ANOVA.†P-value by chi-squared test.
No Cheol Park, et al. The Association between the Body Mass Index and Depression
Korean Journal of Family Practice
KJFP
58.77세, 비만 그룹 59.00세, 고도비만 그룹 59.29세로 저체중 그룹에 서 가장 높았다(P<0.001). 저체중 그룹, 정상 그룹, 비만 그룹, 고도비 만 그룹에서 각각 59.2%, 55.2%, 50.3%, 66.4%로 여성의 비율이 높게 나 타났다. 초등학교 졸업 이하의 교육을 받은 사람, 배우자가 없는 사 람, 현재 고용되어 있지 않은 사람, 인지 기능 저하가 있다고 판단되 는 사람의 비율이 저체중 그룹에서 높게 나타났다(P<0.001). 고혈압 이 있는 사람과 당뇨가 있는 사람의 비율은 고도비만 그룹에서 높게 나타났다(P<0.001). 평소 운동하지 않는 사람과 주관적 건강 상태가 나쁘다고 인식한 사람의 비율은 저체중 그룹과 고도비만 그룹에서 높게 나타났다(P<0.001).
2. BMI에 따른 우울증 발생의 상관관계
Figure 1은 BMI에 따른 Kaplan-Meier 생존 곡선을 나타낸다. 8년 후, 저체중 그룹에서 우울증이 가장 많이 발생했다(저체중 그룹 74.3%, 정상 그룹 63.1%, 과체중 그룹 59.5%, 비만 그룹 63.0%, 고도비
만 그룹 59.9%, P<0.001). Bonferroni 방법을 이용한 사후 검정에서 저 체중 그룹에 대해 정상 그룹(P<0.001), 과체중 그룹(P<0.001), 비만 그 룹(P<0.001), 고도비만 그룹(P=0.001)의 우울증 발생율을 각각 비교 했을 때 유의한 것으로 나타났다.
Table 2는 Cox 비례 위험 모델을 보여준다. 보정하지 않은 모델에서 저체중 그룹과 비교했을 때, 다른 모든 그룹에서 우울증 발생 위험 이 유의하게 감소했다(정상 그룹: HR=0.725, 95% CI=0.649 –0.809; 과 체중 그룹: HR=0.632, 95% confidence interval [CI]=0.565 –0.708; 비만 그룹: HR=0.687, 95% CI=0.612–0.771; 고도비만 그룹: HR=0.718, 95%
CI=0.591–0.873). 성별, 연령, 교육, 배우자, 고용상태, 음주, 고혈압, 당 뇨병, 인지 기능, 주관적 건강 상태, 평소 운동 여부를 보정한 모델에 서는 저체중 그룹에 비해 과체중 그룹, 고도비만 그룹에서 우울증 발생 위험이 유의하게 감소했다(과체중 그룹: HR=0.872, 95%
CI=0.775–0.981; 고도비만 그룹: HR=0.791, 95% CI=0.648–0.966).
고 찰
본 연구는 시간 경과에 따라 BMI에 따른 우울증 발생 정도를 알 아보았고, 다른 그룹에 비해 저체중 그룹에서 높다는 것을 밝혔다.
우울증 발생 위험비는 과체중 그룹 및 고도비만 그룹과 비교하였을 때 저체중 그룹에서 높게 나타났다.
비만과 우울증에 관한 연구들은 있었지만 상충된 결과들이 있었 고, 저체중 그룹에서 비만이 우울증 발생에 끼치는 영향에 대해서는 연구가 부족하였다. 비만과 우울증의 상관관계를 분석한 연구들에 서 많은 연구들이 비만과 우울증 사이에 양의 상관관계가 있다고 하
였지만,21-25) 다른 연구들에서는 역의 상관관계 또는 유의하지 않은
관계라고 하였다.11,26) 한편으로는 선형관계가 아닌 저체중 그룹과 비 만 그룹에서 우울증 유병률이 높게 나타나고 정상과 과체중 그룹에 서 낮게 나타난다는 것을 보고하는 연구도 있었다.27)
또한 이전의 많은 연구들이 비만과 우울증 또는 우울 증상의 횡 단 연구였다. 하지만 본 연구는 2년 간격으로 5회의 패널 자료를 이용
Table 2. HRs and 95% CIs for the incidence of depression during the 10-years follow-up period, according to BMI ststus (n=6,811)
Degree of obese Number Number cases Model 1 Model 2 Model 3
Underweight 233 1,44 1* 1* 1*
Normal 2,899 1,610 0.725* (0.649–0.809) 0.878* (0.785–0.981) 0.926 (0.827–1.037)
Overweight 2,097 1,096 0.632* (0.565–0.708) 0.817* (0.728–0.917) 0.872* (0.775–0.981)
Obese 1,454 816 0.687* (0.612–0.771) 0.871* (0.774–0.980) 0.894 (0.792–1.009)
Severe Obese 128 65 0.718* (0.591–0.873) 0.871 (0.716–1.059) 0.791* (0.648–0.966)
HR, hazard ratio; CI, confidence interval; BMI, body mass index.
Model 1: unadjusted. Model 2: adjusted for age and gender. Model 3: adjusted for age, gender, education, marital stastus, employment, drinking, hypertension, diabe- tes, mini-mental state examination, execise, health status.
*Shows P-value <0.05.
Figure 1. Kaplan-Meier survival curve (Log rank, P-value<0.001) of de- pressive symptom by body mass index for adults in the Korean Longi- tudinal Study on Aging.
박노철 외. 한국 성인에서 체질량지수에 따른 우울증 발생과의 관계 Korean Journal of Family Practice
KJFP
한 종단 연구이다.
de Wit 등27)의 12년간 추적 관찰한 연구에서는 정상 체중과 비교 해 비만이 남성에서 주요 우울 증상 발생에 대해 음의 예측 인자이지 만 여성에서는 유의한 관련이 없다는 것을 발견했다. Forman-Hoff- man 등28)의 전향적 코호트 연구에서는 비만의 정도는 우울 증상의 증가와 관련이 없고 우울 증상은 남성에서는 체중 감소의 역할을 하 고 여성에서는 체중 감소 또는 증가의 역할을 한다고 하였다. 그렇지 만 이 연구는 체중에 대한 우울 증상의 영향을 평가한 것이지 우울 증상에 대한 체중의 영향을 평가한 것은 아니다. Konttinen 등29)의 추 적 관찰 연구에서는 우울 증상을 가진 남성이 더 높은 BMI를 나타냈 고, 높은 BMI인 여성이 우울 증상 발생이 더 있는 것으로 나타났다.
본 연구는 몇 가지 제한점이 있다. 첫째, 본 연구는 모든 연령대를 포함하지 않았고, 단지 BMI만 사용하여 비만을 측정하였다. BMI 데 이터는 참가자가 자가 보고했기 때문에 과소 또는 과대 보고 되었을 수 있다. 둘째, 항우울제와 같은 약물에 대한 정보가 없는 것은 추적 기간 동안 관찰된 체중과 우울의 관계에 영향을 줄 수 있다. 셋째, 우 리는 임상 진단으로 우울증을 평가하지 않았다. 향후 이러한 점들 을 조절한 연구가 필요하다.
결론적으로, 본 연구에서는 우리나라 45세 이상 성인에서 저체중 그룹에서 우울증 발생의 위험이 높다는 것을 확인하였다. 이는 우울 증 발생 예측 인자로 BMI가 이용될 수 있음을 시사할 수 있으며, 특 히 저체중 그룹을 진료할 때 환자 본인이 호소하지 않더라도 우울증 이 발생할 위험도가 높다는 것을 유념하여야 할 것이다.
CONFLICT OF INTEREST
No potential conflict of interest relevant to this article was reported.
요 약
연구배경:
체질량지수(body mass index, BMI)와 우울 증상의 관계에 대하여 여러 상반된 연구들이 있는 상태로, 고령화 연구 패널 조사 (Korean Longitudinal Study of Aging study, KLoSA)를 이용하여 45세 이상의 한국 성인에서 8년간 우울 발생 빈도에 대해 BMI에 따른 차 이를 확인하고자 하였다.방법:
노동부의 고령화 연구 패널 조사(KLoSA) 1차, 2차, 3차, 4차, 5 차 자료를 이용하였다. 1차년도에 포함된 성인 중 우울증이 없는 자 를 대상으로 Kaplan-Meier 생존분석 및 Cox 회귀모형을 이용하여 분석하였다.결과:
1차 조사에서 우울증이 없다고 판단된 성인은 6,811명(저체중 그룹 233명, 정상 그룹 2,899명, 과체 그룹 2,097명, 비만 그룹 1,454명, 고도비만 그룹 128명)이었으며, BMI에 따른 저체중 그룹, 정상 그룹, 과체중 그룹, 비만 그룹, 고도비만 그룹에서 연령, 성별, 교육수준, 배 우자 유무, 노동 여부, 음주 여부, 고혈압 유무, 당뇨병 유무, 인지 기 능, 운동여부, 주관적 건강 상태에서 유의한 차이가 있었다. 우울증 발생 정도는 저체중 그룹에서 가장 높게 나타났다(저체중 그룹 74.3%, 정상 그룹 63.1%, 과체중 그룹 59.5%, 비만 그룹 63.0%, 고도비 만 그룹 59.9%, P<0.001). 성별, 나이 인구사회학적 요인, 생활건강 요 인, 신체 정신 요인을 보정한 후 저체중 그룹과 비교하였을 때 과체 중 그룹과 고도비만 그룹에서 우울증 발생 위험이 유의하게 감소했 다(과체중 그룹: hazard ratio [HR]=0.872, 95% confidence interval [CI]=0.775–0.981; 고도비만 그룹: HR=0.791, 95% CI=0.648–0.966).결론:
우울증 발생 정도는 저체중 그룹에서 가장 높았으며, 우울증 발생 위험 또한 과체중 그룹과 고도비만 그룹에 비해 저체중 그룹에 서 높게 나타났다.중심단어:
우울증; 체질량지수; 노화 ORCID홍승완, http://orcid.org/0000-0003-0043-3191 서영성, http://orcid.org/0000-0001-7677-2881 김대현, http://orcid.org/0000-0002-7313-2384
REFERENCES
1. Greenberg PE, Kessler RC, Birnbaum HG, Leong SA, Lowe SW, Berglund PA, et al. The economic burden of depression in the United States: how did it change between 1990 and 2000? J Clin Psychiatry 2003; 64: 1465-75.
2. World Health Organization. Diet, nutrition and the prevention of chronic diseases. Geneva: WHO; 2003. Report No.: WHO Technical Report Series, No. 916 (TRS 916).
3. Hong JJ. Epidemiologic studies on depression and suicide. J Korean Med Assoc 2012; 55: 322-8.
4. Marcus M, Yasamy T, van Ommeren M, Chisholm D, Saxena S. Depression:
a global public health concern. Geneva: WHO Department of Mental Health and Substance Abuse; 2012. [cited 2018 Jan 22]. Available from:
http://www.who.int/mental_health/management/depression/who_paper_
depression_wfmh_2012.pdf.
5. McCrea RL, Berger YG, King MB. Body mass index and common mental disorders: exploring the shape of the association and its moderation by age, gender and education. Int J Obes (Lond) 2012; 36: 414-21.
6. Ohayon MM. Epidemiology of depression and its treatment in the general
No Cheol Park, et al. The Association between the Body Mass Index and Depression
Korean Journal of Family Practice
KJFP
population. J Psychiatr Res 2007; 41: 207-13.
7. Sachs-Ericsson N, Burns AB, Gordon KH, Eckel LA, Wonderlich SA, Crosby RD, et al. Body mass index and depressive symptoms in older adults: the moderating roles of race, sex, and socioeconomic status. Am J Geriatr Psy- chiatry 2007; 15: 815-25.
8. Zhong W, Cruickshanks KJ, Schubert CR, Nieto FJ, Huang GH, Klein BE, et al. Obesity and depression symptoms in the Beaver Dam Offspring Study population. Depress Anxiety 2010; 27: 846-51.
9. Li ZB, Ho SY, Chan WM, Ho KS, Li MP, Leung GM, et al. Obesity and de- pressive symptoms in Chinese elderly. Int J Geriatr Psychiatry 2004; 19: 68- 74.
10. Chang HH, Yen ST. Association between obesity and depression: evidence from a longitudinal sample of the elderly in Taiwan. Aging Ment Health 2012; 16: 173-80.
11. Crisp AH, McGuiness B. Jolly fat: relation between obesity and psychoneu- rosis in general population. Br Med J 1976; 1: 7-9.
12. Kuo SY, Lin KM, Chen CY, Chuang YL, Chen WJ. Depression trajectories and obesity among the elderly in Taiwan. Psychol Med 2011; 41: 1665-76.
13. Palinkas LA, Wingard DL, Barrett-Connor E. Depressive symptoms in overweight and obese older adults: a test of the "jolly fat" hypothesis. J Psy- chosom Res 1996; 40: 59-66.
14. Yu NW, Chen CY, Liu CY, Chau YL, Chang CM. Association of body mass index and depressive symptoms in a Chinese community population: re- sults from the Health Promotion Knowledge, Attitudes, and Performance Survey in Taiwan. Chang Gung Med J 2011; 34: 620-7.
15. Eaton WW, Shao H, Nestadt G, Lee HB, Bienvenu OJ, Zandi P. Population- based study of first onset and chronicity in major depressive disorder. Arch Gen Psychiatry 2008; 65: 513-20.
16. Andresen EM, Malmgren JA, Carter WB, Patrick DL. Screening for depres- sion in well older adults: evaluation of a short form of the CES-D (Center for Epidemiologic Studies Depression Scale). Am J Prev Med 1994; 10: 77- 84.
17. González P, Nuñez A, Merz E, Brintz C, Weitzman O, Navas EL, et al. Mea- surement properties of the Center for Epidemiologic Studies Depression Scale (CES-D 10): findings from HCHS/SOL. Psychol Assess 2017; 29: 372- 81.
18. Irwin M, Artin KH, Oxman MN. Screening for depression in the older adult: criterion validity of the 10-item Center for Epidemiological Studies Depression Scale (CES-D). Arch Intern Med 1999; 159: 1701-4.
19. WHO Expert Consultation. Appropriate body-mass index for Asian popu- lations and its implications for policy and intervention strategies. Lancet 2004; 363: 157-63.
20. Kim JM, Shin IS, Yoon JS, Lee HY. Comparison of diagnostic validities be- tween MMSE-K and K-MMSE for screening of dementia. J Korean Neuro- psyciatr Assoc 2003; 42: 124-30.
21. de Wit L, Luppino F, van Straten A, Penninx B, Zitman F, Cuijpers P. Depres- sion and obesity: a meta-analysis of community-based studies. Psychiatry Res 2010; 178: 230-5.
22. Dixon JB, Dixon ME, O'Brien PE. Depression in association with severe obesity: changes with weight loss. Arch Intern Med 2003; 163: 2058-65.
23. Dong C, Sanchez LE, Price RA. Relationship of obesity to depression: a fam- ily-based study. Int J Obes Relat Metab Disord 2004; 28: 790-5.
24. Luppino FS, de Wit LM, Bouvy PF, Stijnen T, Cuijpers P, Penninx BW, et al.
Overweight, obesity, and depression: a systematic review and meta-analysis of longitudinal studies. Arch Gen Psychiatry 2010; 67: 220-9.
25. Simon GE, Ludman EJ, Linde JA, Operskalski BH, Ichikawa L, Rohde P, et al.
Association between obesity and depression in middle-aged women. Gen Hosp Psychiatry 2008; 30: 32-9.
26. Carpenter KM, Hasin DS, Allison DB, Faith MS. Relationships between obesity and DSM-IV major depressive disorder, suicide ideation, and sui- cide attempts: results from a general population study. Am J Public Health 2000; 90: 251-7.
27. de Wit LM, van Straten A, van Herten M, Penninx BW, Cuijpers P. Depres- sion and body mass index, a u-shaped association. BMC Public Health 2009; 9: 14.
28. Forman-Hoffman VL, Yankey JW, Hillis SL, Wallace RB, Wolinsky FD.
Weight and depressive symptoms in older adults: direction of influence? J Gerontol B Psychol Sci Soc Sci 2007; 62: S43-51.
29. Konttinen H, Kiviruusu O, Huurre T, Haukkala A, Aro H, Marttunen M.
Longitudinal associations between depressive symptoms and body mass index in a 20-year follow-up. Int J Obes (Lond) 2014; 38: 668-74.