D I A B E T E S & M E T A B O L I S M J O U R N A L D I A B E T E S & M E T A B O L I S M J O U R N A L
This is an Open Access article distributed under the terms of the Creative Commons Attribution Non-Commercial License (http://creativecommons.org/licenses/by-nc/4.0/) which permits unrestricted non-commercial use, distribution, and reproduction in any medium, provided the original work is properly cited.
Low-Normal Free Thyroxine Levels in Euthyroid Male Are Associated with Prediabetes
Sung Woo Kim1, Jae-Han Jeon2, Jun Sung Moon3, Eon Ju Jeon1, Mi-Kyung Kim4, In-Kyu Lee2, Jung Beom Seo2, Keun-Gyu Park2
1Department of Internal Medicine, Catholic University of Daegu School of Medicine, Daegu,
2Department of Internal Medicine, School of Medicine, Kyungpook National University, Daegu,
3Department of Internal Medicine, Yeungnam University College of Medicine, Daegu,
4Department of Internal Medicine, Keimyung University School of Medicine, Daegu, Korea
Abnormal thyroid function is associated with impaired glucose homeostasis. This study aimed to determine whether free thyrox- ine (FT4) influences the prevalence of prediabetes in euthyroid subjects using a cross-sectional survey derived from the Korea National Health and Nutrition Examination Survey, conducted between 2013 and 2015. We studied 2,399 male participants of
>20 years of age who were euthyroid and non-diabetic. Prediabetic participants had lower FT4 concentrations than those without prediabetes, but their thyrotropin concentrations were similar. We stratified the population into tertiles according to FT4 concen- tration. After adjusting for multiple confounding factors, glycosylated hemoglobin (HbA1c) levels significantly decreased with increasing FT4 tertile, whereas fasting plasma glucose (FPG) levels were not associated with FT4 tertiles (HbA1c, P<0.01 in T3 vs. T1; FPG, P=0.489 in T3 vs. T1). The prevalence of prediabetes was significantly higher in T1 (odds ratio, 1.426; 95% confi- dence interval, 1.126 to 1.806; P<0.01) than in T3. In conclusion, subjects with low-normal serum FT4 had high HbA1c and were more likely to have prediabetes. These results suggest that low FT4 concentration is a risk factor for prediabetes in male, even when thyroid function is within the normal range.
Keywords: Blood glucose; Glycated hemoglobin A; Prediabetic state; Thyroxine
Corresponding authors: Keun-Gyu Park https://orcid.org/0000-0002-8403-1298 Division of Endocrinology and Metabolism, Department of Internal Medicine, School of Medicine, Kyungpook National University, 130 Dongdeok-ro, Jung-gu, Daegu 41944, Korea E-mail: [email protected]
Jung Beom Seo https://orcid.org/0000-0003-2568-478X
Division of Endocrinology and Metabolism, Department of Internal Medicine, School of Medicine, Kyungpook National University, 130 Dongdeok-ro, Jung-gu, Daegu 41944, Korea
INTRODUCTION
It is well known that thyroid hormone regulates metabolic pro- cesses, including thermogenesis, lipid metabolism, and carbo- hydrate metabolism [1]. Thyroid hormone is known to in- crease serum glucose by enhancing hepatic glucose production and insulin degradation [2,3]. However, the contribution of thyroid hormone to glucose homeostasis is more complicated since it has a role in promoting pancreatic proliferation, in- creasing energy expenditure, and inducing weight loss [4-7].
Although thyroid hormone has well documented effects on
carbohydrate metabolism, it is not clear whether thyroid hor- mone concentrations within the physiological range affect se- rum glucose concentrations. A few studies have shown that high fasting glucose levels are associated with low-normal thy- roid hormone [8], while others have shown that thyroid hor- mone concentrations within the physiological range do not correlate with blood glucose levels, even though there is an as- sociation between thyroid hormone and insulin resistance [9,10]. Thus, there is no consensus regarding whether thyroid hormone concentrations within the physiological range influ- ence glucose metabolism and the risk of diabetes.
https://doi.org/10.4093/dmj.2018.0222 pISSN 2233-6079 · eISSN 2233-6087
Therefore, we designed a study to evaluate the relationships between thyroid hormone concentrations and fasting plasma glucose (FPG), glycosylated hemoglobin (HbA1c), and the prevalence of prediabetes in euthyroid subjects.
METHODS
Data source and participants
This study utilized data from the Korea National Health and Nutrition Examination Survey (KNHANES), collected in 2013 to 2015 (IRB no.: 2013-07CON-03-4C and 2013-12EXP-03- 5C). In male participants over 20 years of age, subjects with free thyroxine (FT4) or thyrotropin (TSH) concentrations out- side the reference range, diabetic values of FPG or HbA1c, or a past history of thyroid disease or diabetes were excluded. Sub- jects with no or incomplete data for thyroid hormone, fasting glucose, or HbA1c concentrations were also excluded. Follow- ing this, 2,399 euthyroid non-diabetic male were enrolled. All the survey participants gave their written informed consent.
Measurements of biochemical and clinical parameters Serum TSH, FT4, and thyroperoxidase (TPO) antibody con- centrations were measured using electrochemiluminescence immunoassays (Roche Diagnostics, Mannheim, Germany).
TSH was measured using an E-TSH kit (Roche Diagnostics), for which the reference range was 0.35 to 5.50 mIU/L. FT4 was measured using an E-Free T4 kit (Roche Diagnostics), with a reference range of 0.89 to 1.76 ng/mL. HbA1c concentration was measured using high-performance liquid chromatography (HLC-723G7; Tosoh, Tokyo, Japan), and serum FPG using a Hitachi Automatic Analyzer 7600 (Hitachi, Tokyo, Japan). Im- paired fasting glucose (IFG) was defined by a FPG of >100 to 125 mg/dL, and a high-risk HbA1c concentration was defined as a HbA1c of 5.7% to 6.4% [11]. Prediabetes was defined by the presence of IFG or a high-risk HbA1c concentration.
Waist circumference (WC) was measured standing with a soft tape-measure placed midway between the lowest rib and the iliac crest. Blood pressure (BP) was measured using a cuff on the right arm attached to a mercury sphygmomanometer (Baumanometer; W. A. Baum, Copiague, NY, USA). Serum to- tal cholesterol, high density lipoprotein cholesterol (HDL-C), and triglyceride (TG) were measured using a Hitachi Auto- matic Analyzer 7600 (Hitachi). Metabolic syndrome was de- fined according to the criteria of the American Heart Associa- tion [12]. Urine iodine concentrations were measured in ran-
dom spot urine samples using inductively coupled plasma mass spectrometry (Perkin Elmer, Waltham, MA, USA). De- mographic and personal medical data were collected using standardized health questionnaires. These data included any past history of hypertension (HTN) or hyperlipidemia, family history of diabetes or thyroid disease, history of alcohol con- sumption, and smoking history.
Statistical analyses
All continuous data are presented as mean±standard devia- tion, and all categorical data as numbers and percentages. The tertiles were compared with regard to baseline characteristics using analysis of variance or chi-square tests. Analysis of cova- riance was used to estimate the mean FPG and HbA1c values for each tertile, after adjustment for multiple variables. Multi- variable logistic regression models were used to estimate the prevalence of prediabetes in each tertile. For all statistical tests, P<0.05 was considered to be statistically significant. Statistical analysis was performed using SPSS version 18.0 software (SPSS Inc., Chicago, IL, USA).
RESULTS
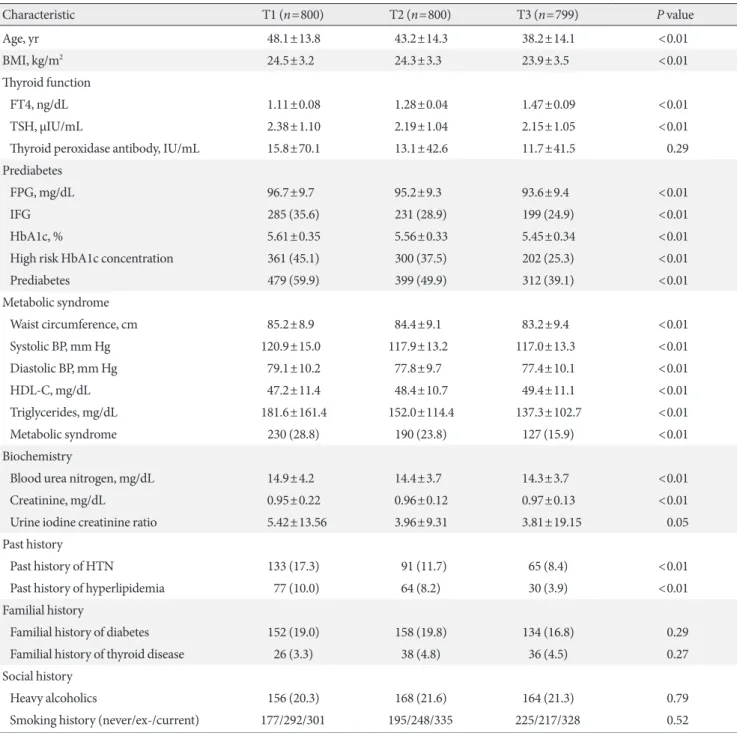
General characteristics of participants stratified tertiles The general characteristics of the participants are presented in Supplementary Table 1. Of the 2,399 euthyroid male, 1,190 had prediabetes and 1,209 did not. The participants were divided into tertiles on the basis of their serum FT4 concentrations (Table 1). In the tertile with the highest FT4 levels, the partici- pants were significantly younger and had lower body mass in- dex (BMI). The FT4 concentration increased with increasing tertile. TSH concentration also decreased with tertile, but anti- TPO antibody concentration did not show differences. FPG and HbA1c concentrations were significantly lower in tertile 3 than in tertile 1, and the prevalences of IFG and high-risk HbA1c concentration were also lower in tertile 3. WC, systolic and diastolic BP, and TG showed downward trends with in- creasing tertile, while HDL-C increased with tertile. Consistent with this, the prevalence of metabolic syndrome was signifi- cantly lower in tertile 3. I/Cr ratio tended to decrease with ter- tile. A past history of HTN or hyperlipidemia was significantly less likely in tertile 3 than in tertile 1. However, family histories of diabetes and thyroid disease, and social histories of alcohol consumption and smoking were similar among the tertiles.
Fasting glucose and HbA1c concentrations and the prevalence of prediabetes in the FT4 tertiles
Table 2 shows the levels of FPG and HbA1c and the prevalence of prediabetes in each FT4 tertiles after adjusting for multiple confounding factors (age, BMI, blood urea nitrogen, creati-
nine, I/Cr ratio, past history of HTN or hyperlipidemia, family history of diabetes or thyroid disease, heavy alcohol consump- tion, smoking history, and markers of metabolic syndrome [WC, systolic and diastolic BP, HDL-C, and TG]). We also ob- served similar results in euthyroid female (Supplementary Ta- Table 1. Baseline clinical characteristics of study participants stratified into tertiles according to levels of free thyroxine
Characteristic T1 (n=800) T2 (n=800) T3 (n=799) P value
Age, yr 48.1±13.8 43.2±14.3 38.2±14.1 <0.01
BMI, kg/m2 24.5±3.2 24.3±3.3 23.9±3.5 <0.01
Thyroid function
FT4, ng/dL 1.11±0.08 1.28±0.04 1.47±0.09 <0.01
TSH, μIU/mL 2.38±1.10 2.19±1.04 2.15±1.05 <0.01
Thyroid peroxidase antibody, IU/mL 15.8±70.1 13.1±42.6 11.7±41.5 0.29
Prediabetes
FPG, mg/dL 96.7±9.7 95.2±9.3 93.6±9.4 <0.01
IFG 285 (35.6) 231 (28.9) 199 (24.9) <0.01
HbA1c, % 5.61±0.35 5.56±0.33 5.45±0.34 <0.01
High risk HbA1c concentration 361 (45.1) 300 (37.5) 202 (25.3) <0.01
Prediabetes 479 (59.9) 399 (49.9) 312 (39.1) <0.01
Metabolic syndrome
Waist circumference, cm 85.2±8.9 84.4±9.1 83.2±9.4 <0.01
Systolic BP, mm Hg 120.9±15.0 117.9±13.2 117.0±13.3 <0.01
Diastolic BP, mm Hg 79.1±10.2 77.8±9.7 77.4±10.1 <0.01
HDL-C, mg/dL 47.2±11.4 48.4±10.7 49.4±11.1 <0.01
Triglycerides, mg/dL 181.6±161.4 152.0±114.4 137.3±102.7 <0.01
Metabolic syndrome 230 (28.8) 190 (23.8) 127 (15.9) <0.01
Biochemistry
Blood urea nitrogen, mg/dL 14.9±4.2 14.4±3.7 14.3±3.7 <0.01
Creatinine, mg/dL 0.95±0.22 0.96±0.12 0.97±0.13 <0.01
Urine iodine creatinine ratio 5.42±13.56 3.96±9.31 3.81±19.15 0.05
Past history
Past history of HTN 133 (17.3) 91 (11.7) 65 (8.4) <0.01
Past history of hyperlipidemia 77 (10.0) 64 (8.2) 30 (3.9) <0.01
Familial history
Familial history of diabetes 152 (19.0) 158 (19.8) 134 (16.8) 0.29
Familial history of thyroid disease 26 (3.3) 38 (4.8) 36 (4.5) 0.27
Social history
Heavy alcoholics 156 (20.3) 168 (21.6) 164 (21.3) 0.79
Smoking history (never/ex-/current) 177/292/301 195/248/335 225/217/328 0.52
Values are presented as mean±standard deviation or number (%). All P values were obtained by using analysis of variance and chi-square test.
BMI, body mass index; FT4, free thyroxine; TSH, thyrotropin; FPG, fasting plasma glucose; IFG, impaired fasting glucose; HbA1c, glycosylated hemoglobin; BP, blood pressure; HDL-C, high density lipoprotein cholesterol; HTN, hypertension.
ble 2). After adjustment for confounding factors, the associa- tion of FPG with and the prevalence of IFG in the FT4 tertile disappeared (FPG, P=0.489 in T3 vs. T1; IFG, odds ratio [OR]
in tertile 1=1.075; 95% confidence interval [CI], 0.831 to 1.389). However, HbA1c concentration and the prevalence of high risk HbA1c remained significantly higher in tertile 1 than in tertile 3 (HbA1c, P<0.01 in T3 vs. T1; high risk HbA1c, OR in tertile 1=1.535; 95% CI, 1.207 to 1.954). The OR for predia- betes was also significantly associated with FT4 tertile (OR in tertile 1=1.426; 95% CI, 1.126 to 1.806). In addition, levels of FT4 were continuously associated with the prevalence of pre- diabetes (Supplementary Table 3). Since age is strong contrib- uting factor in the development of prediabetes, we further per- formed subgroup analysis after dividing at age 50. The associa- tion between FT4 and the prevalence of prediabetes was more prominent in the younger subjects. By contrast, there was no association of FT4 with FPG, HbA1c, and the prevalence of prediabetes in older subjects.
DISCUSSION
Studies of the relationship between type 2 diabetes mellitus and thyroid disorders have generated conflicting results [13,14]. Recently, several studies suggested that both hyperthy- roidism and hypothyroidism increase the risk of diabetes [15,16]. However, in the euthyroid state, it has not been clearly determined whether low or high levels of thyroid hormone in- crease the risk of diabetes. A recent study showed that low- normal thyroid function increases the risk of a prediabetic pa- tient developing diabetes [17]. Given that several studies have shown a relationship between low-normal thyroid function and metabolic syndrome, it may be that low-normal thyroid function increases insulin resistance and represents a potential risk factor for diabetes. In the present study, we found that low- normal FT4 was associated with high-risk HbA1c concentra- tions and prediabetes after adjusting for markers of the meta- bolic syndrome. These results suggest that low FT4 levels, even Table 2. FPG and HbA1c levels and the prevalence of prediabetes in euthyroid male in different free thyroixine tertiles
Variable T1 T2 T3 P for trend
All subjects
FPG, mg/dL 95.23±0.32 95.22±0.31 94.75±0.32 0.49
IFG 1.08 (0.83–1.39) 1.02 (0.79–1.32) Ref 0.57
HbA1c, % 5.55±0.01a 5.55±0.01a 5.51±0.01 <0.01
High risk HbA1c 1.54 (1.21–1.95)a 1.40 (1.10–1.77)a Ref <0.01
Prediabetes 1.43 (1.13–1.81)a 1.19 (0.95–1.50) Ref <0.01
Age <50 yr
FPG, mg/dL 93.84±0.38 92.78±0.37 92.84±0.38 0.09
IFG 1.23 (0.87–1.74) 0.89 (0.62–1.27) Ref 0.20
HbA1c, % 5.49±0.01a 5.47±0.01a 5.42±0.01 <0.01
High risk HbA1c 1.91 (1.38–2.65)a 1.67 (1.20–2.33)a Ref <0.01
Prediabetes 1.61 (1.19–2.16)a 1.19 (0.88–1.60) Ref <0.01
Age ≥50 yr
FPG, mg/dL 97.70±0.55 99.00±0.54 98.45±0.55 0.24
IFG 0.80 (0.55–1.15) 1.20 (0.83–1.73) Ref 0.23
HbA1c, % 5.65±0.02 5.70±0.021 5.67±0.02 0.22
High risk HbA1c 0.91 (0.64–1.29) 1.15 (0.81–1.63) Ref 0.60
Prediabetes 0.93 (0.64–1.35) 1.19 (0.81–1.74) Ref 0.71
Values are presented as mean±standard error (analyzed by analysis of covariance) or odds ratio (95% confidence interval) (analyzed by multi- variable logistic regression). The model was adjusted for age, body mass index, blood urea nitrogen, creatinine, urine iodine: creatinine ratio, past history of hypertension or hyperlipidemia, family history of diabetes or thyroid disease, heavy alcohol consumption, smoking history, and mark- ers of the metabolic syndrome (waist circumference, systolic and diastolic blood pressure, high density lipoprotein cholesterol, and triglycerides).
FPG, fasting plasma glucose; HbA1c, glycosylated hemoglobin; IFG, impaired fasting glucose.
aP<0.01.
in the euthyroid state, have adverse effects on carbohydrate metabolism, independent of the metabolic syndrome. Howev- er, in this study, FPG was not associated with low-normal FT4.
Because thyroid hormone influences various organs, including pancreatic islets, muscle, and adipose tissue, we cannot explain this apparent discrepancy in the relationships of low-normal FT4 with HbA1c and FPG. In subgroup analysis, the associa- tions of FT4 with HbA1c and the prevalence of prediabetes were observed only in young subjects. The reference value of normal thyroid function may differ between old subjects and young subjects due to the relationship between age and thyroid hormone level [18]. The present study had some limitations.
First, it was a cross-sectional study, and therefore we are unable to conclude that there is a causal relationship between low- normal thyroid function and the risk of prediabetes. Second, because some variables, including fasting insulin levels, were not measured in the KNHANES, we could not evaluate the re- lationships between levels of FT4 and insulin resistance. Third, although we observed that low FT4 levels in euthyroid female were associated with prediabetes, we could not analyze the re- lationship between low FT4 and prediabetes in both male and female because of the disproportion in the sex ratio in the ter- tiles and other hormonal variables such as menopause.
In summary, this study shows that relatively low FT4 levels in euthyroid male are significantly associated with high HbA1c and high-risk HbA1c concentrations. However, FPG and IFG were not associated with serum FT4 in euthyroid male. These results suggest that low FT4 is a potential risk factor for predia- betes even in euthyroid subjects.
SUPPLEMENTARY MATERIALS
Supplementary materials related to this article can be found online at https://doi.org/10.4093/dmj.2018.0222.
CONFLICTS OF INTEREST
No potential conflict of interest relevant to this article was re- ported.
AUTHOR CONTRIBUTIONS
Conception or design: S.W.K., J.H.J., J.S.M., E.J.J., M.K.K.
Acquisition, analysis, or interpretation of data: S.W.K.
Drafting the work or revising: I.K.L., J.B.S.
Final approval of the manuscript: K.G.P.
ORCID
Sung Woo Kim https://orcid.org/0000-0001-5354-8430 Jung Beom Seo https://orcid.org/0000-0003-2568-478X Keun-Gyu Park https://orcid.org/0000-0002-8403-1298
ACKNOWLEDGMENTS
This work was supported by a Biomedical Research Institute grant from Kyungpook National University Hospital (2018).
REFERENCES
1. Mullur R, Liu YY, Brent GA. Thyroid hormone regulation of metabolism. Physiol Rev 2014;94:355-82.
2. Brenta G, Danzi S, Klein I. Potential therapeutic applications of thyroid hormone analogs. Nat Clin Pract Endocrinol Metab 2007;3:632-40.
3. O’Meara NM, Blackman JD, Sturis J, Polonsky KS. Alterations in the kinetics of C-peptide and insulin secretion in hyperthy- roidism. J Clin Endocrinol Metab 1993;76:79-84.
4. Verga Falzacappa C, Mangialardo C, Raffa S, Mancuso A, Pier- grossi P, Moriggi G, Piro S, Stigliano A, Torrisi MR, Brunetti E, Toscano V, Misiti S. The thyroid hormone T3 improves func- tion and survival of rat pancreatic islets during in vitro culture.
Islets 2010;2:96-103.
5. Verga Falzacappa C, Panacchia L, Bucci B, Stigliano A, Cavallo MG, Brunetti E, Toscano V, Misiti S. 3,5,3’-Triiodothyronine (T3) is a survival factor for pancreatic beta-cells undergoing apoptosis. J Cell Physiol 2006;206:309-21.
6. Fox CS, Pencina MJ, D’Agostino RB, Murabito JM, Seely EW, Pearce EN, Vasan RS. Relations of thyroid function to body weight: cross-sectional and longitudinal observations in a community-based sample. Arch Intern Med 2008;168:587-92.
7. Knudsen N, Laurberg P, Rasmussen LB, Bulow I, Perrild H, Ovesen L, Jorgensen T. Small differences in thyroid function may be important for body mass index and the occurrence of obesity in the population. J Clin Endocrinol Metab 2005;90:
4019-24.
8. Garduno-Garcia Jde J, Alvirde-Garcia U, Lopez-Carrasco G, Padilla Mendoza ME, Mehta R, Arellano-Campos O, Choza R, Sauque L, Garay-Sevilla ME, Malacara JM, Gomez-Perez FJ, Aguilar-Salinas CA. TSH and free thyroxine concentrations
are associated with differing metabolic markers in euthyroid subjects. Eur J Endocrinol 2010;163:273-8.
9. Roos A, Bakker SJ, Links TP, Gans RO, Wolffenbuttel BH. Thy- roid function is associated with components of the metabolic syndrome in euthyroid subjects. J Clin Endocrinol Metab 2007;
92:491-6.
10. Mehran L, Amouzegar A, Tohidi M, Moayedi M, Azizi F. Se- rum free thyroxine concentration is associated with metabolic syndrome in euthyroid subjects. Thyroid 2014;24:1566-74.
11. Tabak AG, Herder C, Rathmann W, Brunner EJ, Kivimaki M.
Prediabetes: a high-risk state for diabetes development. Lancet 2012;379:2279-90.
12. Grundy SM, Cleeman JI, Daniels SR, Donato KA, Eckel RH, Franklin BA, Gordon DJ, Krauss RM, Savage PJ, Smith SC Jr, Spertus JA, Costa F; American Heart Association; National Heart, Lung, and Blood Institute. Diagnosis and management of the metabolic syndrome: an American Heart Association/
National Heart, Lung, and Blood Institute Scientific Statement.
Circulation 2005;112:2735-52.
13. Papazafiropoulou A, Sotiropoulos A, Kokolaki A, Kardara M, Stamataki P, Pappas S. Prevalence of thyroid dysfunction among greek type 2 diabetic patients attending an outpatient
clinic. J Clin Med Res 2010;2:75-8.
14. Fleiner HF, Bjoro T, Midthjell K, Grill V, Asvold BO. Preva- lence of thyroid dysfunction in autoimmune and type 2 diabe- tes: the population-based HUNT study in Norway. J Clin En- docrinol Metab 2016;101:669-77.
15. Brandt F, Thvilum M, Almind D, Christensen K, Green A, He- gedus L, Brix TH. Morbidity before and after the diagnosis of hyperthyroidism: a nationwide register-based study. PLoS One 2013;8:e66711.
16. Gronich N, Deftereos SN, Lavi I, Persidis AS, Abernethy DR, Rennert G. Hypothyroidism is a risk factor for new-onset dia- betes: a cohort study. Diabetes Care 2015;38:1657-64.
17. Chaker L, Ligthart S, Korevaar TI, Hofman A, Franco OH, Peeters RP, Dehghan A. Thyroid function and risk of type 2 di- abetes: a population-based prospective cohort study. BMC Med 2016;14:150.
18. Park SY, Kim HI, Oh HK, Kim TH, Jang HW, Chung JH, Shin MH, Kim SW. Age- and gender-specific reference intervals of TSH and free T4 in an iodine-replete area: data from Korean National Health and Nutrition Examination Survey IV (2013- 2015). PLoS One 2018;13:e0190738.
Supplementary Table 1. Baseline clinical characteristics of the study participants
Characteristic Euglycemic (n=1,209) Prediabetes (n=1,190) P value
Age, yr 38.2±14.0 48.2±13.5 <0.01
BMI, kg/m2 23.6±3.2 24.9±3.4 <0.01
Prediabetes
FPG, mg/dL 89.6±5.8 100.8±9.3 <0.01
HbA1c, % 5.32±0.23 5.76±0.30 <0.01
Thyroid function
FT4, ng/dL 1.31±0.16 1.26±0.16 <0.01
TSH, µIU/mL 2.23±1.07 2.25±1.07 0.58
Thyroid peroxidase antibody, IU/mL 10.3±26.4 16.8±70.4 <0.01
Metabolic syndrome
Waist circumference, cm 82.2±8.7 86.3±9.1 <0.01
Systolic BP, mm Hg 116.0±12.4 121.2±14.9 <0.01
Diastolic BP, mm Hg 76.6±9.6 79.6±10.2 <0.01
HDL-C, mg/dL 49.3±10.9 47.4±11.2 <0.01
Triglycerides, mg/dL 141.8±120.4 172.4±137.4 <0.01
Metabolic syndrome 77 (9.1) 280 (36.1) <0.01
Biochemistry
Blood urea nitrogen, mg/dL 14.1±3.8 14.9±3.9 <0.01
Creatinine, mg/dL 0.96±0.19 0.96±0.13 0.62
Urine iodine: creatinine ratio 4.28±16.86 4.51±11.81 0.70
Past history
Past history of HTN 62 (7.7) 136 (17.4) <0.01
Past history of hyperlipidemia 36 (4.5) 71 (10.3) <0.01
Family history
Family history of diabetes 124 (16.4) 162 (20.7) <0.01
Family history of thyroid disease 30 (4.4) 32 (4.0) 0.59
Social history
Heavy alcohol consumers 149 (18.8) 171 (23.3) 0.10
Smoking history (never/ex-/current) 238/235/307 164/274/322 <0.01
Values are presented as mean±standard deviation or number (%). All P values were obtained using analysis of variance or the chi-square test.
BMI, body mass index; FPG, fasting plasma glucose; HbA1c, glycosylated hemoglobin; FT4, free thyroxine; TSH, thyrotropin; BP, blood pres- sure; HDL-C, high density lipoprotein cholesterol; HTN, hypertension.
Supplementary Table 2. FPG and HbA1c levels and the prevalence of prediabetes in euthyroid female in different free thyroixine tertiles
Female T1 (n=790) T2 (n=789) T3 (n=789) P for trend
FPG, mg/dL
Unadjusted model 92.85±0.33a 91.99±0.31 91.24±0.30 <0.01
Adjusted model 92.28±0.30 91.95±0.30 92.13±0.31 0.74
IFG
Unadjusted model 1.58 (1.21–2.06)a 1.36 (1.03–1.78)b Ref <0.01
Adjusted model 1.16 (0.85–1.58) 1.10 (0.81–1.51) Ref 0.33
HbA1c, %
Unadjusted model 5.56±0.01a 5.50±0.01a 5.44±0.01 <0.01
Adjusted model 5.55±0.01a 5.50±0.01 5.49±0.01 <0.01
High risk HbA1c
Unadjusted model 1.95 (1.56–2.42)a 1.36 (1.07–1.68)b Ref <0.01
Adjusted model 1.40 (1.08–1.82)b 0.96 (0.73–1.26) Ref 0.01
Prediabetes
Unadjusted model 1.83 (1.49–2.25)a 1.39 (1.12–1.71)a Ref <0.01
Adjusted model 1.29 (1.00–1.69)b 1.00 (0.78–1.30) Ref 0.04
Values are presented as mean±standard error (analyzed by analysis of covariance) or odds ratio (95% confidence interval) (analyzed by multi- variable logistic regression). The model was adjusted for age, body mass index, blood urea nitrogen, creatinine, urine iodine: creatinine ratio, past history of hypertension or hyperlipidemia, family history of diabetes or thyroid disease, heavy alcohol consumption, smoking history, markers of the metabolic syndrome (waist circumference, systolic and diastolic blood pressure, high density lipoprotein cholesterol, and triglyc- erides), and menopause status.
FPG, fasting plasma glucose; HbA1c, glycosylated hemoglobin; IFG, impaired fasting glucose.
aP<0.01, bP<0.05.
Supplementary Table 3. The association of FPG and HbA1c levels with free thyroxine levels in euthyroid subjects
Variable Unadjusted model P value Adjusted model P value
FPG –0.146 <0.01 –0.028 0.21
IFG 0.25 (0.15–0.44) <0.01 0.90 (0.47–1.73) 0.75
HbA1c –0.192 <0.01 –0.057 0.01
High risk HbA1c 0.10 (0.06–0.18) <0.01 0.40 (0.22–0.75) <0.01
Prediabetes 0.11 (0.07–0.18) <0.01 0.45 (0.25–0.83) 0.01
Values are presented as β standardized regression coefficient (analyzed by multivariable regression analysis) or odds ratio (95% confidence in- terval) (analyzed by multivariable logistic regression). The model was adjusted for age, body mass index, blood urea nitrogen, creatinine, urine iodine: creatinine ratio, past history of hypertension or hyperlipidemia, family history of diabetes or thyroid disease, heavy alcohol consump- tion, smoking history, and markers of the metabolic syndrome (waist circumference, systolic and diastolic blood pressure, high density lipopro- tein cholesterol, and triglycerides).
FPG, fasting plasma glucose; HbA1c, glycosylated hemoglobin; IFG, impaired fasting glucose.