A Comparative Study of Oswestry Back Pain Disability Questionnaire Versus Computer Adaptive Testing for Measuring Back Pain
Bong-sam Choi, PhD, MPH, PT
Dept. of Physical Therapy, College of Health and Welfare, Woosong University
Abstract 1)
The aim of the present study was to compare measurement precisions of the Oswestry Back Pain Disability Questionnaire (ODQ) and a computer adaptive testing (CAT) method. The ODQ has been regarded as one of the most reliable condition-specific measure for back pain for decades. Cross-sectional study was carried out with two independent convenient samples from two out-patient rehabilitation clinics for back pain (n
1=42) and non-back pain group (n
2=42). Participants were asked to fill out the ODQ and CAT of International Classification of Functioning, Disability and Health-Activity Measure (ICF-AM). A series of Rasch analyses were performed to calculate person ability measures. The CAT measures had greater relative precision in discriminating the groups than did the ODQ measure in comparisons of the relative precision. The CAT measure appears to be more effective than did the ODQ measure in terms of measurement precision. By administering test items calibrated in a way, CAT measures using item response theory may promise a means with measurement precision as well as efficiency.
Key Words: Back pain; Computer adaptive testing; Item response theory; Measurement; Rasch model; Relative precision.
Introduction
Many self-report measures have been developed specifically for the back pain population due to their several advantages. These advantages include de- creasing administration costs, reducing respondent burden, and potentially accessing scattered sample.
Many studies suggest that self-report disability measures for back pain are as reliable as perform- ance measures and appear to be sensitive indicators of long-term outcome (Kopec, 2000). In general, these self-report disability measures are commonly classified into generic and condition specific measures (McHorney, 1997; McHorney, 1999). To date, nearly 82 condition specific disability measures for back pain have been developed and have been shown to have adequate psychometrics. Of these widely ac- cepted disability instruments, the Oswestry Back Pain Disability Questionnaire (ODQ) is regarded as
one of the most reliable back pain instruments.
However studies have shown that the ODQ may lack sensitivity to discriminate between individuals at the high extreme of ability range (Fairbank and Pynsent, 2000; White and Velozo, 2002), only occa- sionally being responsive to individuals with severe back pain (Baker et al, 1989; Taylor et al, 1999).
Several studies also indicate that the ODQ is more sensitive for patients who have improved but less sensitive for patients whose condition remained un- changed (Muller et al, 2006; Taylor et al, 1999).
Thus, despite its adequate psychometrics, the ODQ may not precisely measure the disability of back pain across the full range of ability.
Deficits in measurement precision may be the re- sult of using items that do not closely match the ability of the sample of interest (McHorney, 1999).
That is, when easy items are administered to in-
dividuals with high ability (i.e., low disability) and/or
Corresponding author: Bong-sam Choi [email protected]
difficult items are administered to individuals with low ability, there is a lack of measurement precision with a resulting inability to discriminate among in- dividuals (Fairbank and Pynsent, 2000; White and Velozo, 2002). Problems with measurement precision occur many times in conventional instruments with fixed number of item, because it is unrealistic for one instrument to include enough items to precisely measure individuals across a wide range of ability.
Even instruments with excellent breadth may still have inadequate depth of measurement (Liang et al, 2002). Additionally problematic issues are the fact that long assessments covering a wider range of ability level contain items that appear unnecessary and induce a concern over respondent burden and administration costs (Jette and Haley, 2005). Thus creating the “ideal” measure consisting of enough items to cover the full range of the trait with ad- equate precision is challenging when using short forms. Despite the popularity and widespread use of the existing instruments developed using classical test theory (CTT), the limitations of these instru- ments still remain in criticism (Hambleton, 2000).
In contrast to CTT, item response theory (IRT) focuses on the psychometric properties of the items making up the instrument instead of the instrument as a whole (Velozo et al, 2006; Velozo et al, 2008).
By estimating the probability that a respondent will select a particular rating for an item, item difficulty and person ability can be placed on the same linear continuum. Thus, IRT model allows “connecting” in- dividuals’ responses to items with their ability level (Velozo and Peterson, 2001; Velozo et al, 2006).
Estimates of person ability on an underlying con- struct obtained using IRT methods are invariant re- gardless of the items used, whereas under the CTT paradigm, person scores vary depending on the diffi- culty of the instrument (Velozo et al, 2006).
Furthermore, item difficulty estimates derived from the IRT analyses remain the same regardless of the ability of the sample, while test statistics in CTT are dependent on the sample taking the test. In ad-
dition, the IRT models linearly transform raw scores into equal interval measures (McHorney et al, 1997).
These advantages of IRT allow for the creation of invariantly calibrated large item banks that can more precisely discriminate individuals’ ability levels and thus, capture smaller increments of change.
While IRT methodologies provide the means for generating and linking person ability and item diffi- culty calibrations, Computer Adaptive Testing (CAT) methods promise a means for administrating items in a way that is both efficient and precise (Bjorner and Ware, 1998; Elhan et al, 2008; Jette and Haley, 2005;
Haley et al, 2004a; Haley et al, 2004b; McHorney, 1997; Velozo et al, 1999; Velozo et al, 2000). Studies have shown that CAT improves test efficiency maintaining adequate precision with fewer items than the full test (Elhan et al, 2008; Flynn et al, 2008;
Haley et al, 2008; Hart et al, 2006; Hol et al, 2007;
Jette et al, 2008; Velozo et al, 2006; Ware et al, 2003;
Weiss, 1982). CAT measures are highly correlated with other assessments intending to measure the same construct and require fewer items. The CAT is based on a testing algorithm which defines iterative processes with a set of rules specifying the test questions to be administered to respondents. This in- cludes procedures for item selection, ability estima- tion, and termination criteria. By selectively adminis- tering items that are matched to the ability level of the individuals, measurement efficiency can be ac- complished without the loss of precision provided by the full item bank. With this technology, a small number of items can be selected from the item bank which are most relevant for a person of a particular ability level (Velozo et al, 1999). The IRT in combi- nation with CAT method has recently become an al- ternative to conventional fixed-format disability measurement (Jette and Haley, 2005; Kopec, 2000).
The ICF Activity Measure (ICF-AM) has recently
been developed to create an efficient and precise
measurement system based on the activity dimension
of World Health Organization’s (WHO) International
Classification of Functioning, Disability and Health
(ICF). The ICF provided the conceptual framework and classification system for generating the items on the ICF-AM. Activities involving movement, moving around and daily life activities were the sub- categories of the ICF activity dimension consulted in the development of items. Items were developed with the intent to represent the entire range of ability on each construct, thus, creating an equiprecise meas- urement which means precise measurement across the entire range of the underlying construct. Using IRT and CAT methods, Velozo and colleagues (2008) created ICF-AM, a web based computer adaptive survey system. The administrative core of the in- strument allows adjusts to be made to various set- tings making it possible to change, the initial theta value (i.e., difficulty of question first given to re- spondent) and stopping rule (i.e., guidelines for ter- minating the test). Because questions are targeted to individuals at their ability level requiring 5∼10 ques- tions per construct are required to reach at a final measure of person ability with acceptable error. In addition, immediate feedback is provided to the re- spondents/clinicians in the form of a graph and summary statistics.
We hypothesized that the CAT measures will dis- criminate more precisely than do the ODQ measures.
The purpose of this study was to compare relative precision of the person measures generated from the CAT measures of the ICF-AM and the ODQ.
Methods
Participants
Forty-two individuals with back pain were re- cruited from rehabilitation clinics in Gainesville, Florida including the University of Florida and Shands Orthopaedics and Sports Medicine Institute and Shands Rehabilitation Hospital. Forty-two in- dividuals without back pain were recruited from multiple public sites in Gainesville, Florida, USA.
Criteria for participants with back pain included: 1)
currently experiencing back pain, 2) having pre- viously received treatment for back pain, 3) ability to read and understand English, and 4) 18 years of age or older. The criteria for non back pain participants included: 1) currently experiencing no back pain, 2) able to read and understand English, and 3) 18 years of age or older. All appropriate participants presenting to the recruiting sites between November 3, 2009 and June 30, 2010 were recruited for the back pain group.
This study was approved by the Institutional Review Board at the University of Florida (IRB #17-2009).
Instrumentation
The ODQ, a conventional back pain disability in- strument developed under CTT, was used in this study. The ODQ is among the most popular self-re- port condition specific instruments assessing how back pain affects patients’ ability to manage daily life tasks (Fairbank, 2000). The ODQ and its revised versions provide an index of the perceived disability experienced by individuals with back pain. It consists of ten items including pain intensity, personal care, lifting, walking, sitting, standing, sleeping, employ- ment/home making, and traveling. Participants re- spond on a 5 point ordinal scale (5; pain does not interfere with activities, 0; pain so severe that activ- ities cannot be performed). The summed total score is converted to a percentage score meaning no dis- ability (zero) to most severe disability (one hundred).
Thus, a higher score is indicative of a higher level of disability.
In an effort to achieve both psychometric effi-
ciency and precision, the ICF-AM was developed
using item response theory. The original ICF-AM
consists of 6 activity constructs: positioning/transfers,
lifting/carrying, fine hand, walking/climbing, wheel-
chair/scooters, and self care activities. Constructs for
use in this study were selected based on the follow-
ing two criteria: 1) tasks represented by items within
the construct frequently cited as problematic for in-
dividuals with back pain and 2) tasks within the
construct represent a potential activity limitation for
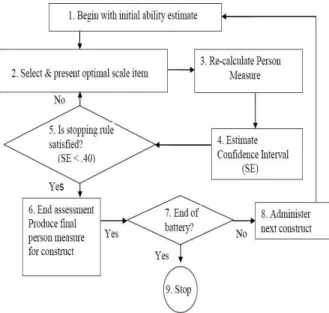
Figure 1. Computer adaptive testing algorithm.
Adapted from Wainer, Dorans, Eignor, Flaugher, Green, Mislevy, Steinberg, and Thissen (2000) (SE: standard error).
individuals with back pain. Based on these criteria, three relevant constructs were chosen for this study:
1) positioning/transfers, 2) lifting/carrying, and 3) walking/moving. For each of the questions on the CAT, respondents are asked to select one of four re- sponse categories with a lower score representing a lower level of ability; “3” (no difficulty), “2” (some difficulty), “1” (a lot of difficulty), and “0” (have not done).
CAT technology was used to administer items of the ICF-AM instrument for each construct. Figure 1 presents the CAT algorithm used for the ICF-AM instrument. First, the CAT begins with an initial person ability estimate (Bn) for a particular construct (i.e., positioning/transfer). The initial person ability measure is set at the mean person ability of the sample used in the preliminary paper and pencil field test (during ICF-AM development phase). The CAT presents an item with a difficulty measure (Di) that is identical or closes to this initial person ability measure. After the initial item is presented and re- sponded to, a new person ability estimate and stand- ard error (SE) is generated. The stopping rule for
the CAT is preset based on the standard error asso- ciated with a person ability estimate (i.e., SE <.40) and the maximum number of items administered (i.e.,<10 items). That is, the test finishes when an individual’s ability is estimated with a standard error less than .40 or 10 items have been administered to the individual. Since the stopping rule is unlikely to be reached with the presentation of a single item, a second item is presented to the respondent. Based on the response, the person ability estimate is recalculated. This procedure continues until the SE associated with the person ability estimate is less than the preset SE, which defines the stopping rule.
Once the stopping rule is satisfied, the respondent’s final ability measure for that construct is formulated.
After completed positioning/transfer construct, the next construct (i.e., lifting/carrying and walk- ing/moving construct) is presented until the CAT reaches the final ability measure.
Data analysis
A series of Rasch analyses were performed using Winsteps software program version 3.57.2 (Winsteps.com, Chicago, USA) to calculate person measures for back pain and non-back pain groups (Linacre, 2005). The Rasch model transforms total raw scores into estimate of person ability in logits.
To maximize the comparability of summative scores the ODQ instrument, the CAT measures were line- arly transformed from the original logit estimates to a 0∼100 metric scale.
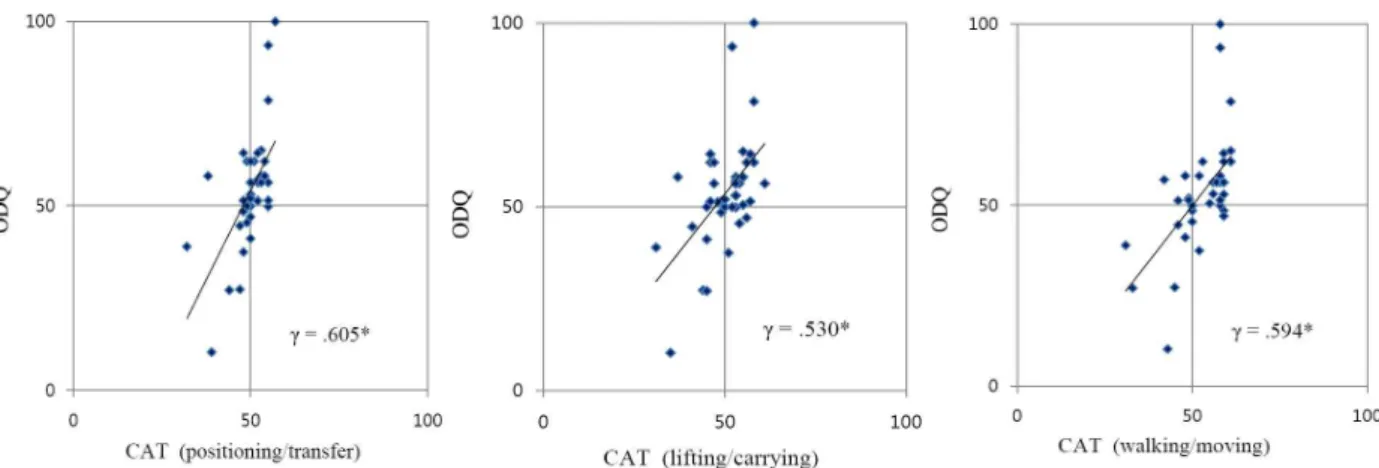
All descriptive statistical and correlation analysis were calculated using SPSS software ver. 21.0 (SPSS Inc., Chicago, IL, USA). Pearson product mo- ment correlations were obtained to compare the measurement properties of CAT (i.e., 10-item stop- ping rule and standard errorless than .40) and ODQ.
Scatter plots of ability estimates for the CAT versus the ODQ measure were used to further examine these relationships.
To examine potential differences in precision
across the three measures, the method of known
Characteristics Back pain group n
1=42 (%)
Non-back pain group n
2=42 (%) Age
< 20 1(.4) 3(7.0)
21∼30 3(.71) 6(14.4)
31∼40 10(23.8) 9(21.4)
41∼50 8(19.0) 6(14.4)
51∼65 8(19.0) 8(19.0)
> 65 12(28.6) 10(23.8)
Mean±SD 53.7±20.1 48.7±19.7
Gender
Female 29(69.0) 27(64.3)
Male 13(31.0) 15(35.7)
Education
Middle/Junior high 2(4.7) 0(0)
High school 19(45.3) 14(33.3)
College 12(28.5) 23(54.8)
Graduate 9(21.5) 5(11.9)
Race/Ethnic
African American 7(16.6) 5(11.9)
Hispanic American 1(2.3) 2(4.8)
American Indian 1(2.3) 0(0)
White, not Hispanic origin 32(76.2) 25(59.5)
Asian/Pacific Islander 2(4.6) 10(23.8)
Years that has had related problems
Less than a year 14(33.3) 0(0)
1 through < 4 years 5(12.0) 0(0)
More than 4 years 20(47.6) 2(4.7)
Missing 3(7.1) 40(95.3)
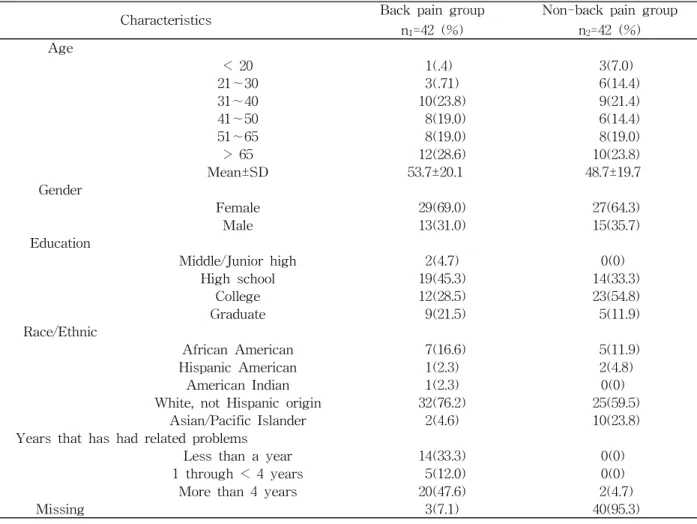
Table 1. Demographic characteristic of study participants (N=84) groups validity to test relative precision (RP) in dis-
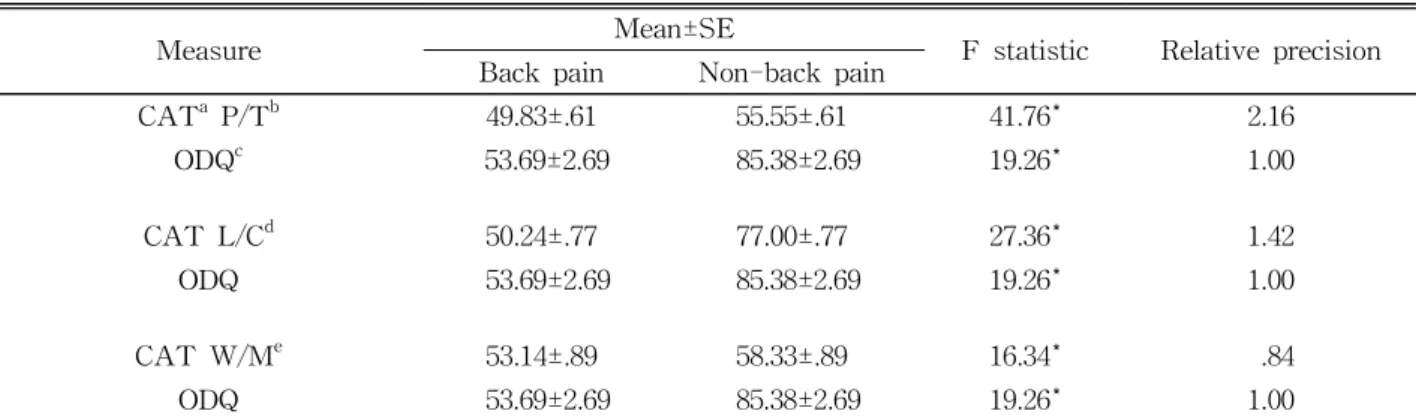
criminating back pain and non-back pain groups was used. Methods included under the general linear model were used to test for hypothesized differences in group mean estimates. The magnitude of the F value from the analysis of variance represents a measure of precision. F statistics associated with chance probabilities p<.05 were considered significant. If the RP ratio is equal to 1, both meth- ods of estimating function are equally discrimi.
natory. If the RP>1 the measurement method in the numerator is superior in differentiating function com- pared to method in denominatorThe greater the F value, the greater the amount of systematic variance a measurement method accounts for and, therefore, the greater its ability to discriminate groups of subjects.
Results
Participant characteristics
Sample demographic characteristics and clinical in- formation are presented in Table 1. The average age was 53.7 years for the back pain group and 48.7 years for the non-back pain group. Nearly 60% of participants reported having back pain more than a year indicating it was a chronic condition. Five per- cent of the non-back pain participants reported hav- ing another pain related condition.
Participants in the back pain group answered
slightly more questions than those in the non-back
pain group. For the back pain group, the average re-
spondent answered 5.6 questions in the position-
ing/transfer construct, 6.3 questions in the lift-
ing/carrying construct, and 6.2 questions in the
CAT
aP/T
bCAT L/C
cCAT W/M
dCAT L/C .837*
CAT W/M .614* .647*
ODQ
e.605* .530* .594*
a
computer adaptive testing measure,
bpositioning/transfer construct,
clifting/carrying construct,
dwalking/moving construct,
eOswestry Back Pain Disability Questionnaire measure. *Pearson’s correlation is significant at the .01 level (2-tailed).
Table 2. Correlation coefficients for CAT and ODQ measure for back pain group
Measure Mean±SE
F statistic Relative precision Back pain Non-back pain
CAT
aP/T
b49.83±.61 55.55±.61 41.76* 2.16
ODQ
c53.69±2.69 85.38±2.69 19.26* 1.00
CAT L/C
d50.24±.77 77.00±.77 27.36* 1.42
ODQ 53.69±2.69 85.38±2.69 19.26* 1.00
CAT W/M
e53.14±.89 58.33±.89 16.34* .84
ODQ 53.69±2.69 85.38±2.69 19.26* 1.00
a
computer adaptive testing,
bpositioning/transfer measure,
cOswestry Back Pain Disability Questionnaire measure,
d