Biomedical Science Letters 2015, 21(4): 208~217 http://dx.doi.org/10.15616/BSL.2015.21.4.208 eISSN : 2288-7415
The Characteristics of Electrocardiography Findings in Left Ventricular Remodeling Patterns of Hypertensive Patients
Sun Young Choi†
Clinical Trial Center, Dong-A University Hospital, Busan 49201, Korea
The exact diagnosis of left ventricular hypertrophy (LVH) is very important in the treatment of hypertension. The purpose of our study is to determine the relationship between left ventricular remodeling patterns and electrocardiography (ECG) findings in hypertensive patients. We divided 137 patients into four groups according to left ventricular mass index (LVMI) and the relative wall thickness: normal, concentric remodeling, concentric hypertrophy, eccentric hypertrophy.
LVH on the ECG was defined by three ECG criteria: Sokolow-Lyon voltage criteria, Cornell voltage criteria and Romhilt- Estes point score. LVH on the echocardiography was defined by LVMI. The prevalence of ECG LVH was increased in concentric hypertrophy and eccentric hypertrophy group. The QRS voltages by Sokolow-Lyon voltage criteria (r = 0.494, P = 0.002) and Cornell voltage criteria (r = 0.628, P < 0.001), and Romhilt-Estes point score (r = 0.689, P < 0.001) were positively correlated with LVMI. Also, the QRS voltages and point scores were significantly increased in the concentric hypertrophy and eccentric hypertrophy group with increased LVMI. The QRS voltage and Romhilt-Estes point scores were positively correlated with LVMI. The QRS voltages and Romhilt-Estes point scores were also increased in the left ventricular remodeling groups with increased LVMI.
Key Words: Electrocardiography, Echocardiography, Hypertension, Ventricular remodeling, Hypertrophy
INTRODUCTION
Left ventricular hypertrophy (LVH) is the cardiac adaptive form to pressure overload in the hypertensive patients.
Hypertrophy is defined as the increase in the volume and mass of the organ due to the enlargement of its component cells (Grossman et al., 1975). Hypertrophy of cardiac muscle results primarily in thickened wall and the chronic pressure overload progresses the structural remodeling which is characterized by chamber enlargement of the left ventricle
(LV) (Devereux et al., 1994). The structural remodeling of LV is divided into four geometric patterns, as based on left ventricular mass index (LVMI) and the relative wall thickness (RWT) (Ganau et al., 1992).
LVH is a strong and independent predictor of the cardio- vascular events, complications and survivals (Mathew et al., 2001; Prineas et al., 2001; Okin et al., 2004a). It is also known that the cardiovascular prevalence and prognosis depends on the LV remodeling patterns (Korea et al., 1991).
The increase of LV mass is an important risk factor for onset of the heart failure, and the regression of LV mass is a therapeutic target in hypertensive patients. So the exact diagnosis of LVH is very important in clinical trials.
The two major methods for the diagnosis of LVH are electrocardiography (ECG) and echocardiography (Echo) (Levy et al., 1988; Verdecchia et al., 1998). Standard 12-lead ECG is recommended as the routine test for the detection
Original Article
*Received: November 1, 2015 / Revised: November 17, 2015 Accepted: November 17, 2015
†Corresponding author: Sun Young Choi. Clinical Trial Center, Dong-A University Hospital, 26 Daesingongwon-ro, Seo-gu, Busan 49201, Korea.
Tel: +82-51-240-5620, Fax: +82-51-244-1713 e-mail: [email protected]
○CThe Korean Society for Biomedical Laboratory Sciences. All rights reserved.
of LVH because of low cost, clinical value and broad availability. However, one major limitation of ECG is the low sensitivity (Levy et al., 1990a; Casiglia et al., 2008; Ahn et al., 2013), and LV mass cannot be diagnosed by ECG.
Whereas Echo has high accuracy on the diagnosis of LVH by measurement of LV mass, and can evaluate LV remodeling patterns (Levy et al., 1990b; Radulescu et al., 2008). However, Echo is not routine test for LVH because of high cost. So it is necessary to make up for the weak points of ECG for the accurate diagnosis of LVH. The previous studies demon- strated the association between LV mass and ECG LVH (Budhwani et al., 2005; Okin et al., 2004b), and suggested the benefit Echo for diagnosis of LV remodeling patterns (Radulescu et al., 2008). So we compared electrocardiography voltage between four LV remodeling patterns of hypertensive patients to support the utility of cost-effective ECG for diagnosis of LVH.
MATERIALS AND METHODS Patient population
Using our database of the patients who underwent trans- thoracic Echo and standard 12-lead ECG between January 2009 and December 2011, of the 196 patients screened for the study, 18 were excluded for arrhythmia, 12 for hyper- trophic cardiomyopathy, 21 for myocardial infarction, and 8 for significant valve disease. The remaining 137 patients were eventually selected for the analysis. Body mass index (BMI) was obtained by the weight (kg) divided by two times height (m). Dyslipidemia was defined as total cholesterol
≥ 230 mg/dL, LDL cholesterol ≥ 150 mg/dL, HDL chol- esterol < 40 mg/dL and triglyceride ≥ 200 mg/dL (Son et al., 2012). Diabetes mellitus was defined as glycated hemoglobin (HbA1c) ≥ 6.5% from ADA 2015 guidelines (American Diabetes Association, 2015). The prior medica- tions consisted of diuretics, calcium channel blockers, beta- blockers, angiotensin converting enzyme inhibitors and angio- tensin receptor blocker. The study protocol was reviewed and Fig. 1. Four left ventricular remodeling patterns in hypertensive patients and M-mode echocardiography measurement. (Left) Normal (RWT < 0.43, LVMI < 116 in male and < 104 in female), concentric remodeling (RWT ≥ 0.43, LVMI < 116 in male and < 104 in female), concentric hypertrophy (RWT ≥ 0.43, LVMI ≥ 116 in male and ≥ 104 in female), eccentric hypertrophy (RWT < 0.43, LVMI ≥ 116 in male and ≥ 104 in female). (Right) LVIDd, IVSd and LVPWd were measured at the onset of QRS complex. LVMI, left ventricular mass index;
RWT, relative wall thickness; LVH, left ventricular hypertrophy; LVIDd, left ventricular internal diameter at end-diastole; IVSd, interventricular septal thickness at end-diastole; LVPWd, left ventricular posterior wall thickness at end-diastole.
approved (approval number: 15-216) by Dong-A University Hospital Institutional Review Board.
Patient groups
Based on LVMI and RWT, the patients were divided into four groups: normal with normal LVMI and RWT, con- centric remodeling group with normal LVMI and increased RWT, concentric hypertrophy group with increases in both LVMI and RWT and eccentric hypertrophy group with increased LVMI and normal RWT (Fig. 1, left).
Echocardiography measurement
Transthoracic Echo examinations were performed on IE33 (Philips Ultrasound, Andover, MA, USA) with 2.5 MHz transducer. LV internal diameter at end-diastole (LVIDd), interventricular septal thickness at end-diastole (IVSd) and
LV posterior wall thickness at end-diastole (LVPWd) were obtained on M-mode echocardiography, according to the recommendations of American Society of Echocardiography (Sahn et al., 1978) (Fig. 1, right). LV mass was measured using the corrected cube formula of the American Society of Echocardiography (Devereux et al., 1986), and was in- dexed by body surface area to obtain LVMI. RWT was obtained by the two times LVPWd divided by LVIDd, and increased RWT was defined as > 0.43 (Ganau et al., 1992).
Echo LVH was defined as increased LVMI (≥ 116 g/m2 in male, ≥ 104 g/m2 in female) (Okin et al., 2001).
LV mass (g) = 0.8 × 1.04 [(LVIDd + IVSd + LVPWd)3 - LVIDd3] + 0.6
LVMI (g/m2) = LV mass / BSA RWT = (2 × LVPWd) / LVIDd) Table 1. Baseline characteristics
Variable Normal
(n = 35)
Concentric remodeling (n=32)
Concentric hypertrophy
(n = 35)
Eccentric hypertrophy
(n = 35) P value
Age (year) 60 ± 9 63 ± 10 63 ± 11 55 ± 15 0.072
Male, n (%) 11 (31) 14 (44) 16 (46) 24 (69) 0.079
BMI (kg/m2) 25.3 ± 3.2 24.8 ± 2.6 24.5 ± 3.7 24.3 ± 4.3 0.763
Dyslipidemia, n (%) 4 (11) 4 (13) 5 (14) 3 (9) 0.887
Diabetes, n (%) 7 (20) 4 (13) 9 (26) 9 (26) 0.499
CVA, n (%) 0 (0) 1 (3) 2 (6) 2 (6) 0.531
Prior medication
Diuretics 0 (0) 3(9) 7 (20) 7 (20) < 0.001
CCB 0 (0) 6 (19) 10 (29) 7 (20) < 0.001
BB 0 (0) 11 (34) 11 (31) 20 (57) < 0.001
ARB 0 (0) 12 (38) 15 (43) 11 (31) < 0.001
ACE inhibitor 0 (0) 0 (0) 4 (11) 6 (17) < 0.001
Other hypertensive drug 0 (0) 2 (6) 1 (3) 0 (0) < 0.001
LVIDd (mm) 45.7 ± 3.1 40.5 ± 3.4*** 46.6 ± 2.7 56.1 ± 6.8*** < 0.001 IVSd (mm) 8.3 ± 1.2 9.7 ± 1.0** 12.3 ± 1.7*** 10.0 ± 1.7*** < 0.001 LVPWd (mm) 8.8 ± 1.0 9.9 ± 0.8* 11.7 ± 1.6*** 10.4 ± 1.5*** < 0.001 RWT 0.36 ± 0.06 0.47 ± 0.06*** 0.48 ± 0.09*** 0.36 ± 0.07 < 0.001 LVMI (g/m2) 91.9 ± 13.6 83.3 ± 15.7 147.1 ± 31.2***† 153.5 ± 36.4***† < 0.001 The data are presented as mean ± standard deviation or percent (%). Statistical analysis was performed by one-way ANOVA with Bonferroni' test for post hoc analysis. *P < 0.05 vs. normal, **P < 0.01 vs. normal, ***P < 0.001 vs. normal, †P < 0.001 vs. concentric remodeling. BMI, body mass index; CVA, cerebrovascular accident; CCB, calcium channel blocker; BB, beta-blocker; ARB, angiotensin receptor blocker; ACE inhibitor, angiotensin converting enzyme inhibitor; LVIDd, left ventricular internal diameter at end-diastole; IVSd, interventricular septal thickness at end-diastole; LVPWT, left ventricular posterior wall thickness at end-diastole; RWT, relative wall thickness; LVMI, left ventricular mass index.
Electrocardiography measurement
Standard 12-lead ECG was recorded by Page Writer TC30 (Philips Electronics, Andover, MA, USA) at 25 mm/s with a gain setting of 10 mm/mV, according to the recommen- dations of American Heart Association (Kligfield et al., 2007). The tracings were interpreted by two experienced investigator. We tested the following the ECG criteria for LVH: Sokolow-Lyon voltage criteria (SV1 + R V5/6 ≥ 35 mV) (Sokolow and Lyon, 1949), Cornell voltage criteria (SV3 + RaVL ≥ 28 mV in male and 20 mV ≥ in female) (Molloy et al., 1992) and Romhilt-Estes point score (≥ 5 points) (Romhilt and Estes, 1968).
Statistical analysis
Continuous variables are expressed as means ± standard deviations and were analyzed using Student's t-test. Cat- egorical variables were summarized in terms of number and percentages and were compared by using chi-square test. Pearson's correlation was performed to evaluate the correlation between LVMI and QRS voltages/Romhilt-
Table 3. The prevalence of left ventricular hypertrophy by three different electrocardiography criteria in four left ventricular remodeling patterns
ECG criteria Normal
(n = 35)
Concentric remodeling (n = 32)
Concentric hypertrophy
(n = 35)
Eccentric hypertrophy
(n = 35) P value
Sokolow-Lyon voltage, n (%) 5 (17%) 7 (22%) 18 (51%) 22 (63%) 0.001
Cornell voltage, n (%) 0 (0%) 4 (13%) 15 (43%) 21 (60%) < 0.001
Romhilt-Estes score, n (%) 0 (0%) 4 (13%) 15 (43%) 15 (43%) < 0.001
P value 0.862 0.790 0.666 0.269
Electrocardiography left ventricular hypertrophy is defined as Sokolow-Lyon voltage ≥ 35 mm, Cornell voltage ≥ 20 mm (female) and ≥ 28 mm (male), Romhilt-Estes points score ≥ 5 score. ECG, electrocardiography.
Table 2. The sensitivity and specificity of three different electrocardiography criteria for the diagnosis of left ventricular hyper- trophy in ROC curve analysis
Sokolow-Lyon voltage Cornell voltage Romhilt-Estes score
AUC 0.686 0.722 0.686
95% Confidence interval 0.584~0.777 0.622~0.808 0.581~0.774
Sensitivity (%) 57 52 43
Specificity (%) 80 94 94
P value < 0.001 < 0.001 < 0.001
Fig. 2. The comparison of left ventricular mass index between four left ventricular remodeling patterns. There were significant between-group differences in LVMI (P < 0.001). LVMI was in- creased in group 3 (147.1 ± 31.2 g/m2) and group 4 (153.5 ± 36.4 g/m2) compared with group 1 (91.9 ± 13.6 g/m2) and group 2 (83.3 ± 15.7 g/m2) (P < 0.001), however there were no signifi- cant differences between group 3 and group 4. Also, there was no significant difference between group 1 and group 2. Group 1: nor- mal, Group 2: concentric remodeling, Group 3: concentric hyper- trophy, Group 4: eccentric hypertrophy. LVMI, left ventricular mass index.
Estes score. One-way analysis of variance (ANOVA) with Bonferroni' test for post hoc analysis was performed for comparisons of continuous variables between four LV remodeling groups. The sensitivity and specificity of ECG for diagnosis of LVH were evaluated by ROC curve analysis using MedCalc Version 12.2.1 (MedCalc software, Mariakerke, Belgium). All statistical comparisons were two-sided and P-values of < 0.05 were regarded as statistically significant.
All statistical analyses were performed using Statistical Package for Social Science 18.0 software (SPSS Inc., Chicago, IL, USA).
RESULTS Baseline characteristics
The baseline characteristics of the patients in this study are presented in Table 1. There were no significant differences
of age, body mass index, dyslipidemia, diabetes, cerebro- vascular accident and duration of hypertension between four groups. The prior hypertensive medication was different between four groups. There were significant differences in LVIDd, IVSd and LVPWd between four groups (P < 0.001).
RWT was significantly increased in concentric remodeling and concentric hypertrophy group (P < 0.001) compared with normal group, and LVMI was significantly increased in concentric hypertrophy and eccentric hypertrophy group compared with normal and concentric remodeling group (P
< 0.001) (Table 1).
The sensitivity and specificity of three electrocardio- graphy criteria for left ventricular hypertrophy
We performed ROC curve analysis, which demonstrated the sensitivity and specificity of three ECG criteria for LVH.
Sokolow-Lyon voltage criteria (AUC: O.686, 95% CI: 0.584
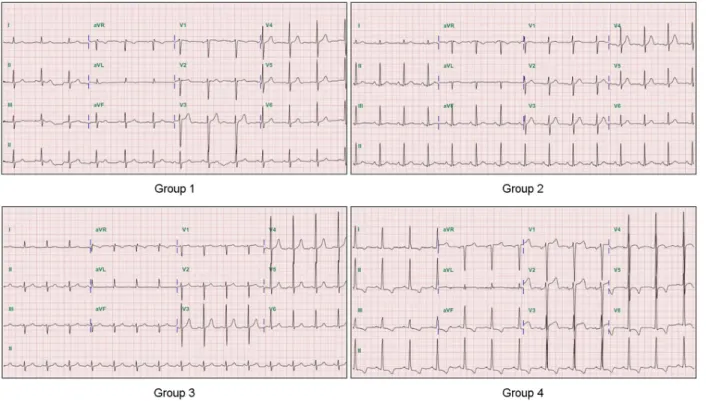
Fig. 3. The electrocardiography findings in four left ventricular remodeling patterns. Group 1 (normal): the QRS voltages 20 mV by Sokolow-Lyon criteria, the QRS voltages 20 mV (male) by Cornell criteria and 1 point by Romhilt-Estes scores. Group 2 (concentric remodeling): the QRS voltages 17.5 mV by Sokolow-Lyon criteria, the QRS voltages 7.5 mV (female) by Cornell criteria and 1 point by Romhilt-Estes scores. Group 3 (concentric hypertrophy): the QRS voltages 25 mV by Sokolow-Lyon criteria, the QRS voltages 20 mV (female) by Cornell criteria and 4 points by Romhilt-Estes scores. Group 4 (eccentric hypertrophy): the QRS voltages 60 mV by Sokolow- Lyon criteria, the QRS voltages 30 mV (female) by Cornell criteria and 5 points by Romhilt-Estes scores.
~0.777, P < 0.001), Cornell voltage criteria (AUC: 0.722, 95% CI: 0.622~0.808, P < 0.001) and Romhilt-Estes point score (AUC: 0.686, 95% CI: 0.581~0.774, P < 0.001) were associated with Echo LVH in spite of low sensitivity. Area under the ROC curve (AUC), sensitivity and specificity are presented in Table 2.
The prevalence of electrocardiography left ventricular hypertrophy in left ventricular remodeling patterns
The prevalence of ECG LVH in normal, concentric remodeling, concentric hypertrophy and eccentric hyper- trophy group using Sokolow-Lyon voltage criteria was 17%, 22%, 51%, 63% (P = 0.001), using Cornell voltage criteria
was 0%, 13%, 43%, 60% (P < 0.001), and using Romhilt- Estes point score was 0%, 13%, 43%, 43% (P < 0.001) (Table 3).
The comparison of left ventricular mass index between four left ventricular remodeling patterns
There were significant between-group differences in LVMI (normal: 91.9 ± 13.6 g/m2, concentric remodeling:
83.3 ± 15.7 g/m2, concentric hypertrophy: 147.1 ± 31.2 g/m2, eccentric remodeling: 153.5 ± 36.4 g/m2, P < 0.001).
LVMI was increased in concentric hypertrophy and eccen- tric remodeling group compared to normal and concentric remodeling group (P < 0.001), however there was no
Fig. 4. The correlation between left ventricular mass index and QRS voltages/Romhilt-Estes point score. (A) The QRS voltages by Sokolow-Lyon criteria (r = 0.494, P = 0.002), (B) the QRS voltages by Cornell criteria (r = 0.628, P < 0.001), and (C) Romhilt-Estes scores (r = 0.689, P < 0.001) were positively correlated with LVMI. LVMI, left ventricular mass index.
A B
C
significant difference between concentric hypertrophy and eccentric remodeling group. Also, there was no significant difference between normal and concentric remodeling (Table 1 and Fig. 2).
The correlation between left ventricular mass index and the QRS voltages/Romhilt-Estes point scores
The QRS voltages by Sokolow-Lyon voltage criteria (r = 0.494, P = 0.002) or by Cornell voltage criteria (r = 0.628, P < 0.001) were positively correlated with LVMI. Also,
Romhilt-Estes point scores (r = 0.689, P < 0.001) were positively correlated with LVMI (Fig. 4).
The differences of electrocardiography findings between four left ventricular remodeling patterns
The QRS voltages by Sokolow-Lyon voltage criteria were significantly different between four groups (normal: 27.1 ± 6.9 mV, concentric remodeling: 30.1 ± 13.7 mV, concentric hypertrophy: 33.7 ± 11.7 mV, eccentric hypertrophy: 40.6
± 15.9 mV, P = 0.002). The QRS voltages by Cornell
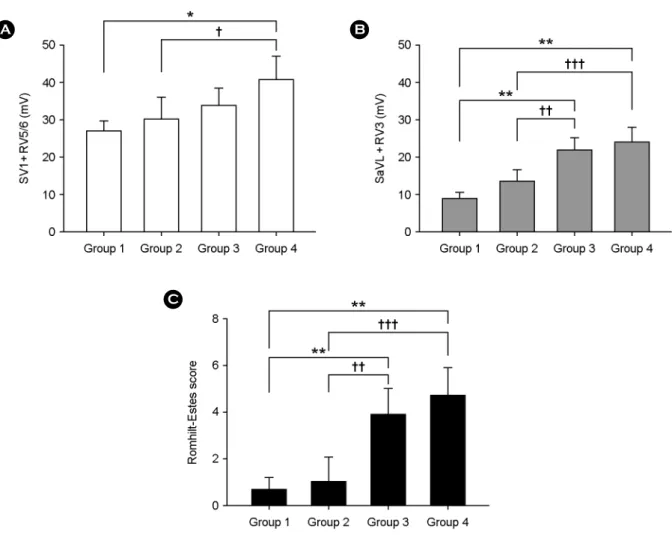
Fig. 5. The differences of electrocardiography findings between four left ventricular remodeling patterns. (A) The QRS voltages by Sokolow-Lyon criteria were significantly higher in group 4 (40.6 ± 15.9 mV) than group 1 (27.1 ± 6.9 mV) and group 2 (30.1 ± 13.7 mV). (B) The QRS voltages by Cornell criteria were significantly higher in group 3 (21.6 ± 8.6 mV) and group 4 (23.9 ± 9.9 mV) than group 1 (8.8 ± 3.8 mV) and group 2 (13.3 ± 7.4 mV). (C) Romhilt-Estes score was significantly higher in group 3 (3.8 ± 2.7) and group 4 (4.6 ± 3.0) than group 1 (0.6 ± 1.2) and group 2 (1.0 ± 2.5). The data are presented as mean ± standard deviation. Statistical analysis was performed by one-way ANOVA with Bonferroni' test for post hoc analysis. *P = 0.001 vs. group 1, **P < 0.001 vs. group 1, †P < 0.05 vs. group 2, ††P < 0.01 vs. group 2, †††P < 0.001 vs. group 2. Group 1: normal, Group 2: concentric remodeling, Group 3: concentric hypertrophy, Group 4: eccentric hypertrophy.
A B
C
voltage criteria were also significantly different between four groups (normal: 8.8 ± 3.8 mV, concentric remodeling: 13.3
± 7.4 mV, concentric hypertrophy: 21.6 ± 8.6 mV, eccen- tric hypertrophy: 23.9 ± 9.9 mV, P < 0.001). Romhilt- Estes point score were significantly different between four groups (normal: 0.6 ± 1.2, concentric remodeling: 1.0 ± 2.5, concentric hypertrophy: 3.8 ± 2.7, eccentric hyper- trophy: 4.6 ± 3.0, P < 0.001). In Sokolow-Lyon voltage criteria, the QRS voltages of eccentric hypertrophy group were higher than the QRS voltages of normal group (P = 0.001) and concentric remodeling group (P = 0.028). In Cornell voltage criteria, the QRS voltages of concentric hypertrophy group were higher than normal group (P <
0.001) and concentric remodeling group (P = 0.003), and the QRS voltages of eccentric hypertrophy group were higher than normal group (P < 0.001) and concentric remodeling group (P < 0.001). Also, in Romhilt-Estes point score, the point score of concentric hypertrophy group were higher than normal group (P < 0.001) and concentric remodeling group (P = 0.001), and eccentric hypertrophy group were higher than normal group (P < 0.001) and concentric remodeling group (P < 0.001) (Fig. 5).
DISCUSSION
We compared ECG LVH and LVMI, and demonstrate that the QRS voltages and Romhilt-Estes point scores were increased in proportion to LVMI. Also, we suggest that the QRS voltages and Romhilt-Estes point score were increased in LV remodeling groups with increased LVMI. LVH is an adaptive response to pressure overload such as hypertension, and is defined as increase of LV mass (Grossman et al., 1975). Chronic pressure overload also increases LV volume with more severe increase of LV mass as one of prognostic implications (Devereux et al., 1994). So, adaptive foam of LV to chronic hypertension develops with four different geometric remodeling patterns including normal, concentric remodeling, concentric hypertrophy and eccentric hyper- trophy (Ganau et al., 1992). The remodeling pattern, LVH is well known as independent risk factor for cardiovascular morbidity and mortality in patients with essential hyper- tension (Mathew et al., 2001; Prineas et al., 2001; Okin et
al., 2004a), and is associated with arrhythmia (Siegel et al., 1990), sudden death (Chiang et al., 1970). Also, the increase in LV mass is an important risk factor for the incidence and prognosis of cardiovascular disease. Furthermore, LV mass is an important parameter for therapy of hypertension (Schillaci et al., 2000; Levy et al., 1989). So, the accurate diagnosis of LVH is very important for the treatment of hypertensive patients.
ECG is the most general method to detect LVH. However ECG cannot reflect LV mass, and has low sensitivity in detection of LVH compared with Echo. So, it is necessary to remedy the shortcomings of ECG for the accurate diagnosis of LVH. We conducted this clinical study to know the differences of ECG findings between four LV remodeling patterns. ECG LVH was diagnosed by three traditional criteria such as Sokolow-Lyon voltage criteria, Cornell voltage criteria and Romhilt-Estes point score. LVMI was measured by M-mode echocardiography, and Echo LVH was diagnosed by LVMI.
The mean prevalence of ECG LVH by three ECG criteria was less than 60% in the increased LVMI groups (concentric hypertrophy and eccentric hypertrophy group). This result means low sensitivity of ECG for the detection of LVH like as prior studies (Casiglia et al., 2008; Ahn et al., 2013).
Also the QRS voltages and point scores for LVH were positively correlated with the LVMI and this result was equal to prior studies (Budhwani et al., 2005; Okin et al., 2004b). However, compared with normal LVMI groups (normal and concentric remodeling group), the QRS voltages and point scores were significantly higher in the increased LVMI groups (concentric hypertrophy and eccentric hyper- trophy group). These results show that high QRS voltages and point scores may reflect increased wall thickness and LV diameter as well as increased LVMI, in contrast with prior study that increased wall thickness and ventricular diameter failed to correlate with the overall ECG score (Budhwani et al., 2005), Furthermore, high QRS voltages and point scores may reflect the adverse prognosis of cardio- vascular disease in the hypertensive patients. We suggest that these ECG findings can help the clinicians and technicians in exact diagnosis of LVH and choice of effective medication for the hypertensive patients. In spite of our suggestions, we
note several limitations. First, the major limitation of our study is that it was a case control study and the data was obtained retrospectively by a review of the patients' records and echo images, although echo images were reviewed without knowledge of the clinical data. Second, we divided four groups using small populations. So, small subjects may not represent the majority. Finally, the duration of hyper- tension and antihypertensive drugs was not certain for some patients. However, most of patients were taking more than two types of drugs, so the effect of any specific drug on the cardiac remodeling could be minimized.
In conclusion, the QRS voltages and Romhilt-Estes point scores were positively correlated with LVMI. The QRS voltages and Romhilt-Estes point scores were also increased in LV remodeling groups with increased LVMI. So, the high QRS voltages and Romhilt-Estes point scores may be one of risk factors for the adverse prognosis of cardiovascular disease in the hypertensive patients.
Conflict of interest
The authors declare no conflicts of interest.
REFERENCES
Ahn MS, Yoo BS, Lee JH, Lee JW, Youn YJ, Ahn SG, Kim JY, Lee SH, Yoon JH, Choe KH, Koh SB, Ahn SV, Park JK. The Accuracy of Electrocardiogram Criteria for Left Ventricular Hypertrophy in Korean Cohort (Atherosclerosis Risk of a Rural Area Korean General Population). J Korean Soc Hypertens.
2013. 19: 112-122.
American Diabetes Association. Classification and diagnosis of diabetes. Diabetes Care. 2015. 38 Suppl: S8-S16.
Budhwani N, Patel S, Dwyer EM Jr. Electrocardiographic diagnosis of left ventricular hypertrophy: The effect of left ventricular wall thickness, size, and mass on the specific criteria for left ventricular hypertrophy. Am Heart J. 2005. 149: 709-714.
Casiglia E, Schiavon L, Tikhonoff V, Bascelli A, Martini B, Mazza A, Caffi S, D'Este D, Bagato F, Bolzon M, Guidotti F, Haxhi Nasto H, Saugo M, Guglielmi F, Pessina AC. Electrocar- diographic criteria of left ventricular hypertrophy in general population. Eur J Epidemiol. 2008. 23: 261-271.
Chiang BN, Perlman LV, Fulton M, Ostrander LD Jr, Epstein FH.
Predisposing factors in sudden death in Tecumseh, Michigan.
A prospective study. Circulation. 1970. 41: 31-37.
Devereux RB, de Simone G, Ganau A, Roman MJ. Left ventric- ular hypertrophy and geometric remodeling in hypertension:
stimuli, functional consequences and prognostic implication.
J Hypertens Suppl. 1994. 12: S117-127.
Devereux RB, Anlonso DR, Lutas EM, Gottlieb GJ, Campo E, Sachos I, Reichek N. Echocardiographic assessment of left ventricular hypertrophy comparion to necropsy findings. Am J Cardiol. 1986. 57: 450-458.
Grossman W, Jones D, McLaurin LP. Wall stress and pattern of hypertrophy in the human left ventricle. J Clin Invest. 1975.
56: 56-64.
Ganau A, Devereux RB, Roman MJ, de Simone G, Pickering TG, Saba PS, Vargiu P, Simongini I, Laragh JH. Patterns of left ventricular hypertrophy and geometric remodeling in essential hypertension. J Am Coll Cardiol. 1992. 19: 1550-1558.
Korea MJ, Devereux RB, Casale PN, Savage DD, Laragh JH.
Relation of left ventricular mass and geometry to morbidity and mortality in uncomplicated essential hypertension. Ann Intern Med. 1991. 144: 345-352.
Kligfield P, Gettes LS, Bailey JJ, Childers R, Deal BJ, Hancock EW, van Herpen G, Kors JA, Macfarlane P, Mirvis DM, Pahlm O, Rautaharju P, Wagner GS; American Heart Association Electrocardiography and Arrhythmias Committee, Council on Clinical Cardiology; American College of Cardiology Foun- dation; Heart Rhythm Society, Josephson M, Mason JW, Okin P, Surawicz B, Wellens H. Recommendations for the stand- ardization and interpretation of the electrocardiogram: Part I:
The electrocardiogram and its technology: a scientific statement from the American Heart Association Electrocardiography and Arrhythmias Committee, Council on Clinical Cardiology;
the American College of Cardiology Foundation; and the Heart Rhythm Society: endorsed by the International Society for Computerized Electrocardiology. Circulation. 2007. 115:
1306-1324.
Levy D, Garrion RJ, Savage DD, Kannel WB, Castelli WP. Left ventricular mass and incidence of coronary heart disease in and elderly cohort: the Framingham Heart Study. Ann Intern Med. 1989. 110: 101-107.
Levy D, Anderson KM, Savage DD, Kannel WB, Christiansen JC, Castelli WP. Ehcocardiographically detected left ventricular hypertrophy: prevalence and risk factors. The Framingham Heart Study. Ann Intern Med. 1988. 108: 7-13.
Levy D, Labib SB, Anderson KM, Christiansen JC, Kannel WB, Castelli WP. Determinants of sensitivity and speificity of
electrocardiographic criteria for left ventricular hypertrophy.
Circulation. 1990a. 81: 815-820.
Levy D, Grrison RJ, Savage DD, Kannel WB, Castelli WP. Pro- gnostic implications of echocardiographically determined left ventricular mass in the Framingham heart study. N Engl J Med. 1990b. 322: 1561-1566.
Mathew J, Sleight P, Lonn E, Johnstone D, Pogue J, Yi Q, Bosch J, Sussex B, Probstfield J, Yusuf S. Reduction of cardiovascular risk by regression of electrocardiographic markers of left ventricular hypertrophy by the angiotensin-converting enzyme inhibitor ramipril. Circulation. 2001. 104: 1615-1621.
Molloy JM, Okin PM, Devereux RB, Kligfield P. Electrocar- diographic detection of left ventricular hypertrophy by the simple QRS voltage-duration product. J Am Coll Cardiol.
1992. 5: 1180-1186.
Okin PM, Devereux RB, Nieminen MS, Jern S, Oikarinen L, Viitasalo M, Toivonen L, Kjeldsen SE, Julius S, Dahlöf B.
Relationship of the electrocardiographic strain pattern to left ventricular structure and function in hypertensive patients:
the LIFE study. Losartan intervention For End point. J Am Coll Cardiol. 2001. 38: 514-520.
Okin PM, Devereux RB, Liu JE, Oikarinen L, Jern S, Kjeldsen SE, Julius S, Wachtell K, Nieminen MS, Dahlöf B. Regression of electrocardiographic left ventricular hypertrophy predicts regression of echocardiographic left ventricular mass: the LIFE Study. J Hum Hypertens. 2004b. 18: 403-409.
Okin PM, Devereux RB, Jern S, Kjeldsen SE, Julius S, Nieminen MS, Snapinn S, Harris KE, Aurup P, Edelman JM, Wedel H, Lindholm LH, Dahlöf B. LIFE Study Investigators. Regression of electrocardiographic left ventricular hypertrophy during antihypertensive treatment and the prediction of major cardio- vascular events. JAMA. 2004a. 292: 2343-2349.
Prineas RJ, Rautaharju PM, Grandits G, Crow R. MRFIT Research Group. Independent risk for cardiovascular disease predicted by modified continuous score electrocardiographic criteria for
6-year incidence and regression of left ventricular hypertrophy among clinically disease free men: 16-year follow-up for the Multiple Risk Factor Intervention Trial. J Electrocardiol. 2001.
34: 91-101.
Radulescu D, Pripon S, Parv A, Duncea C, Gulei I. Electrocardio- graphy and conventional radiology accuracy compared to echocardiography in evaluating left ventricular remodelling patterns in hypertensive patients. Panminerva Med. 2008. 50:
97-103.
Romhilt DW, Estes EH Jr. A point-score system for the ECG diagnosis of left ventricular hypertrophy. Am Heart J. 1968.
75: 752-758.
Sahn DJ, DeMaria A, Kisslo J, Weyman A. Recommendations regarding quantification in M-mode echocardiography results of a survey of echocariographic measurements. Circulation.
1978. 58: 1072-1083.
Schillaci G, Verdecchia P, Porcellati C, Cuccurullo O, Cosco C, Perticone F. Continuous relation between left ventricular mass and cardiovascular risk in essential hypertension. Hypertension.
2000. 35: 580-586.
Siegel D, Cheitlin MD, Black DM, Seeley D, Hearst N, Hulley SB.
Risk of ventricular arrhythmias in hypertensive men with left ventricular hypertrophy. Am J Cardiol. 1990. 65: 742-747.
Sokolow M, Lyon TP. The ventricular complex in left ventricular hypertrophy as obtained by unipolar precordial and limb leads.
Am Heart J. 1949. 37: 161-186.
Son JI, Chin SO, Woo JT, and The Committee for Developing Treatment Guidelines for Dyslipidemia, Korean Society of Lipidology and Atherosclerosis (KSLA). J Lipid Atheroscler.
2012. 1: 45-59.
Verdecchia P, Schillaci G, Borgioni C, Ciucci A, Gattobigio R, Zampi I, Porcellati C. Prognostic value of a new electrocardio- graphic method for diagnosis of left ventricular hypertrophy.
J Am Coll Cardiol. 1998. 31: 383-390.