10.3988/jcn.2011.7.2.77 J Clin Neurol 2011;7:77-84
Burden of Ischemic Stroke in Korea:
Analysis of Disability-Adjusted Life Years Lost
Keun-Sik Hong,a Jaiyong Kim,b Yong-Jin Cho,a So-Young Seo,a Seon-Il Hwang,a Sang-Chul Kim,a Ji Eun Kim,a Ahro Kim,a Joong-Yang Cho,a Hee Kyung Park,a Hee-Joon Bae,c Mi Hwa Yang,c Myung Suk Jang,c Moon-Ku Han,c Juneyoung Lee,d Dong-Wha Kang,e Jong-Moo Park,f Jaseong Koo,g Kyung-Ho Yu,h Mi-Sun Oh,h Byung-Chul Leeh
aDepartment of Neurology, Ilsan Paik Hospital, Inje University College of Medicine, Goyang, Korea
bSocial and Preventive Medicine, Hallym University College of Medicine, Chuncheon, Korea
cDepartment of Neurology, Seoul National University Bundang Hospital, Seongnam, Korea
dDepartment of Biostatistics, College of Medicine, Korea University, Seoul, Korea
eDepartment of Neurology, Asan Medical Center, University of Ulsan College of Medicine, Seoul, Korea
fDepartment of Neurology, Eulji General Hospital, Eulji University School of Medicine, Seoul, Korea
gDepartment of Neurology, The Catholic University of Korea, Seoul St. Mary’s Hospital, Seoul, Korea
hDepartment of Neurology, Hallym University Sacred Heart Hospital, Anyang, Korea
Received November 7, 2010 Revised February 21, 2011 Accepted February 21, 2011 Correspondence Keun-Sik Hong, MD, PhD Department of Neurology, Ilsan Paik Hospital, Inje University College of Medicine,
2240 Daehwa-dong, Ilsanseo-gu, Goyang 411-706, Korea Tel +82-31-910-7680 Fax +82-31-910-7368 E-mail [email protected]
Background and PurposezzDisability-adjusted life years (DALY), incorporating both dis- ability and mortality, has been widely employed to measure regional and global burdens of stroke.
Thus far, the DALY lost to stroke in a population has been estimated using only the crude popu- lation-level data; no previous study has incorporated refined data from stroke registries. The aim of this study was to integrate the stroke registry data and the population-level incidence data to project the nationwide DALY lost to ischemic stroke.
MethodszzFrom the data of two large ischemic stroke registries, we derived an average DALY lost due to ischemic stroke for each of the following age groups: <45, 45-54, 55-64, 65-74, 75-84, and ≥85 years. The nationwide ischemic stroke incidence for each age group was extracted from a cardiovascular and cerebrovascular surveillance study that analyzed the 2004 Korean Health In- surance database.
ResultszzThe average DALY lost due to ischemic stroke for the age groups <45, 45-54, 55-64, 65-74, 75-84, and ≥85 years was 5.07, 4.63, 4.35, 3.88, 2.88, and 1.73, respectively. By multiply- ing the incidence and the average DALY lost, the nationwide DALY lost was determined to be 9,952 for those <45 years, 24,608 for 45-54 years, 50,682 for 55-64 years, 88,875 for 65-74 years, 52,089 for 75-84 years, and 8,192 for ≥85 years, respectively. The projected nationwide DALY lost due to 64,688 ischemic strokes in 2004 was 234,399 (121,482 for men and 113,244 for women), and the DALY lost per 100,000 person-years was 483 (500 for men and 469 for women).
ConclusionszzIncidence data from a population study and DALY values derived from stroke registries can be integrated to provide a more refined projection of the nationwide burden of isch- emic stroke. In Korea, more than 230,000 years of healthy life are being lost annually due to isch- emic stroke, and hence prompt action is imperative. J Clin Neurol 2011;7:77-84 Key Wordszz DALY, incidence, burden, ischemic stroke, Korea.
Introduction
Stroke cripples as well as kills people. Accordingly, disability in addition to mortality should be reflected in measuring stroke
burden. The World Health Organization Global Burden of Dis- ease Project (WHO-GBDP) developed the disability-adjusted life years (DALY) to measure regional and global burdens of hundreds of diseases with a common metric.1 The DALY in-
corporates disability and mortality into a single metric of healthy life years lost, whereby one DALY lost is a loss of one healthy life year. In 2002, the WHO-GBDP estimated the glob- al burden of stroke to be 49.2 million DALY lost.2 South Korea belonged to a group that had a nationwide DALY lost of 641- 880 per 100,000 person-years.3 However, the WHO-GBDP did not estimate the burden of ischemic and hemorrhagic stroke separately.
Ischemic and hemorrhagic stroke differ with regard to risk factors, their population-attributable risks, prevention strate- gies, fatality rates, and residual disability among stroke survi- vors.4 Furthermore, the relative proportion of each stroke sub- type varies markedly across populations. In Korea, since the proportion of ischemic stroke is increasing as a result of a sub- stantial change in risk factor profiles, the burden of ischemic stroke needs to be assessed separately in order to establish efficient public health policies.
The variables required to calculate DALY lost in a given population are the incidence, disability weight, disability dura- tion, age of onset, and death. To date, these variables have been estimated exclusively from the population-level data of inci- dence, prevalence, fatality, and mortality.5 However, the re- quired population data specific for ischemic stroke were not available for many countries. In addition, the WHO-GBDP did not provide a specific disability weight for ischemic stroke, but rather a unitary disability weight for overall stroke.6 Therefore, it has not been possible to generate the DALY lost specifically to ischemic stroke.
Recent studies have provided a novel technique for deriving the DALY lost of individual ischemic stroke patients directly from their age, gender, and disability level [as measured by the modified Rankin scale (mRS)] instead of using population-lev- el data and the unitary disability weight for overall stroke.7-9 Consequently, an average DALY lost for each age group and gender can be generated from stroke registry data, and then can be used to derive the nationwide DALY lost by combining population-level incidence data.
The aim of this study was to estimate the burden of ischemic stroke in Korea with a DALY metric by integrating the data from ischemic stroke registries and an incidence study.
Methods
Incidence of ischemic stroke for each gender and age group
We extracted ischemic stroke incidence data for each gender and age group from the 2006 report of the Construction of Na- tional Surveillance System for Cardiovascular and Cerebrovas- cular Diseases (CNSSCCD). That study analyzed the 2004 in- surance claim database of the Korean Health Insurance Review
Agency and national death certificate data to estimate the na- tionwide stroke incidence of South Korea.10 Age was stratified into the following groups: <45, 45-54, 55-64, 65-74, 75-84, and ≥85 years.
Average DALY lost due to ischemic stroke for each gender and age group
To derive the average DALY lost due to ischemic stroke for each age group and gender, we used the data from two large ischemic stroke registries: the Complication in Acute Stroke Study (COMPASS) registry and the Seoul National Universi- ty Bundang Hospital (SNUBH) stroke registry. The COM- PASS was a multicenter, prospective, observational study that was designed to evaluate the impact of poststroke complica- tions on stroke outcome, and it recruited 1,254 consecutive pa- tients with acute ischemic stroke admitted to 4 university hos- pitals in South Korea between September 1, 2004 and August 31, 2005.11 The SNUBH registry enrolled 1,614 consecutive ischemic stroke patients from a single center in South Korea between June 2006 and July 2009. The two registries prospec- tively captured 3-month mRS outcomes and baseline demo- graphics including the initial stroke severity measured by the National Institute of Health Stroke Scale for 1,233 patients in the COMPASS registry and 1,614 patients in the SNUBH reg- istry. The COMPASS obtained 3-month mRS outcomes by us- ing a structured format by direct interview for 831 patients (66.3%) and by telephone interview for 423 (32.0%) patients.
In the SNUBH registry, an experienced stroke nurse (M.-H. Y.) contacted patients at 3 months after stroke onset for a telephone interview as part of an institutional quality-of-care monitoring program, and assessed 3-month mRS. Stroke deaths were veri- fied by contacting family members and by obtaining informa- tion from a national death certificate system. For each patient, we calculated DALY lost due to a qualifying ischemic stroke.
From the individual DALY lost values, the average DALY lost for each gender and age group of the two registries were cal- culated and then averaged at the study level without applying weights for the sample size. Data collection for individual pa- tients was approved by the Institutional Review Boards of the participating institutions. Ethical approval for the nationwide ischemic stroke incidence data was not required because all of the data were publicly available.
DALY derivation for each patient
The DALY lost due to a qualifying stroke for each patient was calculated from each patient’s age, gender, and disability weight determined by their 3-month mRS level, using previously pub- lished methodologies.7,8 Briefly, DALY lost is the sum of years of life lost due to premature death (YLL) and years of healthy life lost due to disability (YLD): DALY=YLL+YLD.1 Thus, if
a patient has a stroke at the age of 65 years, lives for 5 years with a disability weight of 0.4 [disability weight ranging from 0 (normal health without disability) to 1.0 (dead)], and the life expectancy of general population at age 70 years is 12 years, then YLL=12, YLD=2 (=0.4×5), and the DALY lost=14.
However, deriving the DALY lost usually incorporates the discount rate and age weighting, which are widely employed health-policy modeling assumptions. The discount rate is to assign a lower value to future healthy life years lost than to immediate present ones-usually 3% of the annual discount rate.
The age-weighting is to assign different values to different life years, higher in young adults than in infants or the elderly. Giv- en that discount rate and age-weighting are taken into account, YLL and YLD could be derived by the following formulas:1 YLL[r,K]=KCerA/(r+β)2{e-(r+β)(L+A)[-(r+β)(L+A)-1]-e-(r+β)A[- (r+β)A-1]}+[(1-K)/r](1-e-rL)
YLD[r,K]=DWKCerAs/(r+β)2{e-(r+β)(Ld+As)[-(r+β)(Ld+As)-1]-e-
(r+β)As[-(r+β)As-1]}+[(1-K)/r](1-e-rLd),
where K is the age-weighting modulation factor (K=1 or 0), β is the parameter for the age-weighting function (β=0.04 or 0), r is the discount rate (r=0.03 or 0), C is a constant (C=0.1658), A is the age at death, L is the life expectancy of the general population at age A, DW is the disability weight, As is the age at stroke, and Ld is the duration of disability in an mRS X state (=life expectancy of a stroke patient with a disability of mRS X at age As).
The values of K, β, and C were previously determined by the extensive modeling works of the WHO-GBDP.1 The pres- ent study employed the disability weights derived in a previous study for each mRS level: 0, 0.053, 0.228, 0.353, 0.691, 0.998, and 1.0 for mRS 0-6, respectively.7
The age- and gender-specific life expectancies of the general population were obtained from the 2005 Korean life tables.12 The duration of disability (Ld) is equal to the life expectancy of the stroke survivor. To derive the life expectancy of each stroke survivor, we generated the stroke survivors’ life tables for each gender and mRS level. Mortality rate increases mono- tonically as mRS level increases,13,14 and mortality hazard ra- tios specific to each mRS level were derived in a previous study.8 By applying the mRS-specific mortality hazard ratios to the gender- and age-specific mortality rates provided in the 2005 Korean life tables, we generated the stroke survivors’ life tables. Two examples of DALY lost calculation are provided below:
For a 68.5-year-old Korean woman with a fatal stroke (mRS 6)
Ld=0
L=17.34 (life expectancy at age 68.5 years from the 2005 life table for Korean women)
DALY[3,1]=YLL[3,1]=1×0.1658×e0.03×68.5/(0.03+0.04)2{e-
(0.03+0.04)(17.34+68.5)[-(0.03+0.04)(17.34+68.5)-1]-e-(0.03+0.04)×68.5[- (0.03+0.04)×68.5-1]}+[(1-1)/0.03](1-e-0.03×17.34)]=8.11.
For a 68.5-year-old Korean woman with a 3-month mRS of 2
Ld=12.33 (obtained from the stroke survivors’ life tables) L=8.72 (life expectancy at age 80.83 years from the 2005 life table for Korean women).
Therefore, the DALY of this patient is the sum of YLL for premature death at the age of 80.83 years (expected age of death: 80.83=68.5+12.33 years) and the YLD for 12.33 living years with disability. The disability weight of mRS 2 was de- termined as 0.228 in a previous study.7
YLD[3,1]=0.228×1×0.1658×e0.03×68.5/(0.03+0.04)2{e-
(0.03+0.04)(12.33+68.5)[-(0.03+0.04)(12.33+68.5)-1]-e-(0.03+0.04)×68.5[- (0.03+0.04)×68.5-1]}+[(1-1)/0.03](1-e-0.03×12.33)]=1.49.
YLL[3,1] at age 80.5=1×0.1658×e0.03×80.5/(0.03+0.04)2{e-
(0.03+0.04)(8.72+80.5)[-(0.03+0.04)(8.72+80.5)-1]-e-(0.03+0.04)×80.5[- (0.03+0.04)×80.5-1]}+[(1-1)/0.03](1-e-0.03×8.72)]=3.62.
Since death in this patient is the future event that will occur after 12.33 years, applying a future discount rate is required for YLL[3,1] at the age of 68.5 years, as shown below:15
YLL[3,1] at age of 68.5={YLL[3,1] at age of 80.83}×er×Ld
=3.62×e0.03×12.33=2.50.
Finally, DALY[3,1]=2.50+1.49=3.99.
Nationwide DALY lost due to ischemic stroke By multiplying the average DALY lost and incidence of isch- emic stroke, the nationwide burden of DALY lost for each gen- der and age group was calculated and then summed to deter- mine the total DALY lost due to ischemic stroke in 2004.
Results
Demographics and 3-month functional outcomes of the two registries
The data of 1,233 patients from the COMPASS registry and 1,614 patients from the SNUBH registry were included in this analysis. Patient characteristics were comparable between the COMPASS and the SNUBH populations: age, 66.5±12.1 vs.
67.2±12.6 years [mean±SD (standard deviation)]; male propor- tion, 56.1% vs. 60.0%; and National Institute of Health Stroke Scale score at admission [median (interquartile range)], 4 (2-8) vs. 4 (2-7). The 3-month mRS distributions did not differ be- tween the two registries (p=0.973, linear-by-linear association).
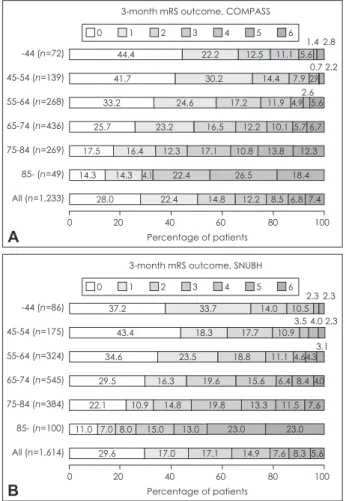
The age-stratified 3-month mRS outcome distributions were also comparable between the two populations upon visual inspection (Fig. 1). Increasing age shifted the mRS distribution, with a sub- stantial increase of patients in worse outcome categories.
The average DALY lost due to ischemic stroke The average DALY lost due to ischemic stroke was 3.79, as calculated by averaging the DALY lost of 3.82±0.07 (mean±
standard error) from the COMPASS population and 3.75±
0.06 from the SNUBH population (Table 1). Overall, YLD contributed about one-quarter to the total DALY lost. How- ever, this proportion increased in younger age groups, ap- proaching nearly 50% for those aged <45 years (Table 1).
The age-group-specific average DALY lost was 5.07, 4.63, 4.35, 3.88, 2.88, and 1.73 for those aged <45, 45-54, 55-64, 65- 74, 75-84, and ≥85 years, respectively. Between the two regis- tries, the corresponding values of the average DALY lost for each age group were highly correlated: Spearman correlation coefficients of 0.943 (p=0.005) for both men and women com- bined, 0.829 (p=0.042) for men, and 0.943 (p=0.005) for wom- en. The younger age groups had a lesser poststroke disability level than the older age groups, but a greater DALY lost (Fig. 1, Table 1).
Ischemic stroke incidence
In the 2006 CNSSCCD report, the total occurrence of ischemic stroke in 2004 was estimated to be 64,688 (32,111 for men and 32,577 for women), and the incidence per 100,000 person- years was 133 (132 for men and 135 for women) (Table 2).10 Projection of the nationwide DALY lost due to ischemic stroke
The projected nationwide DALY lost due to 64,688 ischemic strokes in 2004 was 234,399 (113,244 for women and 121,482 for men), and the DALY lost per 100,000 person-years was 483 (469 for women and 500 for men)(Table 2).
Table 2 gives the ischemic stroke burden of each age group and their relative contributions to the total ischemic stroke bur- den. The age group of 65-74 years had a highest annual DALY lost of 88,875 due to 22,906 ischemic strokes. Its contribution to the total ischemic burden was 37.9% with the DALY mea- sure and 35.4% with the incidence measure. The second- and third-ranked age groups were 75-84 and 55-64 years, respec- tively. The annual burden of 52,675 ischemic strokes among those aged 55-84 years was projected to be 191,646 DALY lost.
For both genders, the ischemic stroke burden was greatest in the age group of 65-74 years. However, the second-ranked age group was 75-84 years for women but 55-64 years for men (Table 2).
Sensitivity analysis
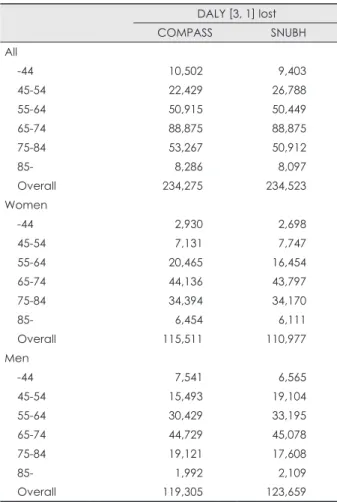
Table 3 gives the estimated nationwide DALY lost from the COMPASS population data and the SNUBH population data alone (rather than the averaged data). The projected DALY val- ues remained stable irrespective of whether it was derived from the COMPASS population data and SNUBH population data alone or from averaged data.
Discussion
The findings of this study show that integrating the DALY value derived from individual-patient-level data and incidence data from a population-level study can generate a more refined nationwide burden of ischemic stroke. In Korea, ischemic stroke deprives the population of more than 230,000 years of healthy life annually, corresponding to 483 healthy life years being lost per 100,000 person-years. The burden of ischemic stroke is greatest among those aged 65-74 years, resulting in more than 88,000 DALY lost, which accounts for 38% of the total DALY lost. In the age group 55-84 years, the healthy life years lost due to ischemic stroke exceeds 190,000, and this number is expected to rise exponentially in the near future.
Previously, estimating DALY lost due to a disease in a giv- en population was derived exclusively from population-level Fig. 1. 3-month mRS outcome distributions for each age group. A:
mRS outcome of the COMPASS registry. B: mRS outcome of the SNUBH registry. The age stratified 3-month mRS outcome distribu- tions were comparable between the two populations. Increasing age shifted the mRS distribution with a substantial increase of patients in worse outcome categories. COMPASS: complication in acute stroke study, mRS: modified Rankin scale, SNUBH: Seoul National University Bundang Hospital.
A
44.4 41.7 33.2 25.7
17.5 16.4 12.3
14.3 14.3 4.1 28.0
22.2
30.2 14.4 7.9 2.9 24.6
23.2 17.1 22.4 22.4
12.5
17.2 16.5
10.8 26.5 14.8
11.1
11.9 12.2
13.8 18.4 12.2 8.5 6.8 7.4
5.6
4.9 5.6 10.1 5.7 6.7 12.3 -44 (n=72)
Percentage of patients 3-month mRS outcome, COMPASS
0 1 2 3 4 5 6
1.4 0.7 2.6
2.8 2.2
0 20 40 60 80 100
45-54 (n=139) 55-64 (n=268) 65-74 (n=436) 75-84 (n=269) 85- (n=49) All (n=1,233)
0 1 2 3 4 5 6
B
37.2 43.4 34.6 29.5
22.1 10.9 14.8 11.0 7.0 8.0 15.0
29.6
33.7
18.3 17.7 10.9
23.5 16.3
19.8 13.0 17.0
14.0 10.5
18.8 19.6
13.3 23.0 17.1
11.1 15.6
11.5 23.0 14.9 7.6 8.3 5.6
4.64.3 6.4 8.4 4.0
7.6 -44 (n=86)
Percentage of patients 3-month mRS outcome, SNUBH
2.3 4.0 3.5
3.1 2.3
2.3
0 20 40 60 80 100
45-54 (n=175) 55-64 (n=324) 65-74 (n=545) 75-84 (n=384) 85- (n=100) All (n=1,614)
data. Data regarding age-specific mortality, fatality, incidence, and prevalence were used to calculate YLL and YLD. When these data were unavailable, YLL and YLD were estimated us- ing DisMod II from the best available data.5 Disease duration (or the life expectancy of stroke survivors) was projected by di- viding prevalence by incidence.5 Therefore, a DALY lost pro- jection estimated from population-level data has the limita- tions of inaccuracy and numerous assumptions.
Previous studies have applied to all stroke survivors a uni- tary disability weight that the WHO-GBDP determined to ap- ply universally to diverse populations on global perspectives.6 Poststroke disability levels critically determine the magnitude of DALY lost by its disability weight and impact on stroke sur- vivors’ life expectancies, which substantially decrease with in- creasing disability level.13,14 Disability among stroke survivors spans a broad spectrum and an averaged poststroke disability level in a population would vary depending on the characteris- tics of the stroke patients and the stroke care system. In addi- tion, the unitary disability weight is for stroke, not for ischemic stroke. Therefore, a globally determined, unitary disability
weight would be valid when applying it to a global population to estimate overall stroke burden, but invalid when applying it to a specific population to estimate the burden of ischemic stroke.
In contrast, our DALY projection overcame many caveats of the previously applied methodologies. Korea has a nation- wide unified health insurance system that covers the entire population and ensures a highly accessible medical care. Ac- cordingly, the incidence data employed in our study are likely to be more accurate than those estimated from other data sources. In the present study, the age-group-specific DALY lost values were derived from DALY lost values for individu- al patients. The DALY lost for each patient was generated di- rectly from the patient’s age, gender, and fine-grained disabil- ity level, which determines reductions in life expectancy and optimum health during their residual life. The disability weight for each mRS determined in a previous study was generated by a standard person trade-off method of the WHO-GBDP and adjusted to make its value fully consistent with the WHO’s unitary disability weight.7 Therefore, our projection is likely to Table 1. Average YLL, YLD, and DALY lost due to an ischemic stroke
COMPASS SNUBH Combined
YLL [3, 1] YLD [3, 1] DALY [3, 1] YLL [3, 1] YLD [3, 1] DALY [3, 1] YLL [3, 1] YLD [3, 1] DALY [3, 1]
All
-44 2.72±0.40 2.62±0.45 5.35±0.64 2.48±0.33 2.31±0.35 4.79±0.49 2.60 2.47 5.07 45-54 2.78±0.19 1.44±0.19 4.22±0.29 3.01±0.18 2.03±0.23 5.04±0.32 2.90 1.74 4.63 55-64 3.14±0.13 1.23±0.10 4.37±0.17 3.05±0.09 1.28±0.09 4.33±0.15 3.10 1.26 4.35 65-74 3.00±0.06 0.88±0.05 3.88±0.09 2.94±0.05 0.94±0.04 3.88±0.08 2.97 0.91 3.88 75-84 2.46±0.04 0.48±0.03 2.94±0.06 2.35±0.03 0.46±0.02 2.81±0.05 2.41 0.47 2.88 85- 1.59±0.05 0.16±0.02 1.75±0.07 1.57±0.03 0.14±0.02 1.71±0.04 1.58 0.15 1.73 Overall 2.81±0.05 1.00±0.05 3.82±0.07 2.72±0.04 1.03±0.04 3.75±0.06 2.77 1.02 3.79 Women
-44 2.26±1.00 2.42±0.75 4.68±1.19 1.39±0.13 2.93±0.82 4.31±0.94 1.83 2.68 4.50 45-54 2.84±0.71 2.14±0.63 4.98±0.96 2.36±0.37 3.05±0.59 5.41±0.75 2.60 2.60 5.20 55-64 2.97±0.25 1.52±0.18 4.49±0.31 2.42±0.17 1.20±0.17 3.61±0.27 2.70 1.36 4.05 65-74 2.88±0.11 1.03±0.08 3.91±0.15 2.70±0.07 1.18±0.08 3.88±0.13 2.79 1.11 3.90 75-84 2.48±0.06 0.59±0.04 3.06±0.09 2.46±0.05 0.58±0.04 3.04±0.07 2.47 0.59 3.05 85- 1.67±0.06 0.20±0.03 1.88±0.08 1.62±0.05 0.16±0.02 1.78±0.06 1.65 0.18 1.83 Overall 2.69±0.09 1.08±0.07 3.77±0.11 2.42±0.05 1.07±0.07 3.49±0.09 2.56 1.08 3.63 Men
-44 2.93±0.40 2.71±0.56 5.64±0.76 2.77±0.40 2.14±0.39 4.91±0.57 2.85 2.43 5.28 45-54 2.77±0.12 1.23±0.16 3.99±0.24 3.21±0.20 1.71±0.23 4.92±0.35 2.99 1.47 4.46 55-64 3.26±0.12 1.03±0.11 4.29±0.19 3.36±0.10 1.32±0.10 4.68±0.17 3.31 1.18 4.49 65-74 3.11±0.07 0.75±0.05 3.85±0.11 3.10±0.06 0.77±0.05 3.88±0.09 3.11 0.76 3.87 75-84 2.44±0.06 0.33±0.03 2.78±0.08 2.24±0.04 0.32±0.02 2.56±0.05 2.34 0.33 2.67 85- 1.44±0.09 0.08±0.03 1.53±0.10 1.49±0.04 0.13±0.02 1.62±0.05 1.47 0.11 1.58 Overall 2.92±0.05 0.94±0.06 3.86±0.09 2.92±0.05 1.01±0.05 3.93±0.09 2.92 0.98 3.90 Mean±standard error. Some DALY values are not equal to the sum of YLL and YLD because of rounding of figures below decimal point.
COMPASS: Complication in Acute Stroke Study, DALY: disability-adjusted life years, SNUBH: Seoul National University Bundang Hospital, YLD: years of healthy life lost due to disability, YLL: years of life lost due to premature death.
be the best estimate of the DALY lost to ischemic stroke in the Korean population, while maintaining comparability to the WHO’s framework.
The internal validity of our findings is supported by the re- sults being consistent irrespective of whether they were de- rived from the combined data of the two registry populations or from the data of each registry population alone. The exter- nal validity is supported by the results being comparable to those of the WHO-GBDP report, in which South Korea is cat- egorized into a group wherein the DALY lost to stroke is be- tween 641 and 880 per 100,000 person-years. More specifical- ly, the sex- and age-adjusted DALY lost per 100,000-years was 703, and the unadjusted DALY lost was 855 (obtained from a personal communication with S. Claiborne Johnston, who is the first author of a related article).3 In a 2006 CNSSCCD re- port, the proportion of stroke subtypes was 61.6% for ischemic stroke, 26.8% for hemorrhagic stroke, and 11.5% for unclassi- fied stroke.10 Hemorrhagic stroke has a higher case-fatality rate and more severe poststroke disability. Taking into account all
of these factors, our projection of the DALY lost due to isch- emic stroke is likely to be consistent with the WHO-GBDP data.
Our findings contrast with a recent study of Korean stroke DALY lost estimation. Using 2001 morbidity and mortality data in Korea, the estimated DALY lost due to stroke per 100,000 person-years was reported to be 3394.9 for men and 2532.2 for women.16 That article did not provide specific infor- mation regarding how the DALY values were derived. How- ever, at a national level, according to the 2002 report of the WHO-GBDP, even in Mongolia (which has the highest stroke burden in the world), the DALY lost due to stroke was 2192 per 100,000 person-years.3 Therefore, that previous study seems to have overestimated the DALY lost due to stroke in Korea.
Our findings regarding the contribution of each age group to a nationwide DALY lost can guide public health policy-mak- ing. As expected, the 65-74 years age group contributed the greatest burden to the total DALY lost of ischemic stroke, ap- proaching almost 40%. Of note is the gender difference in the Table 2. Nationwide incidence and DALY lost due to ischemic stroke
Average DALY
[3, 1] Population
Nationwide incidence
of ischemic stroke10 Annual DALY [3, 1] lost Overall number (%) /100,000
person-year Overall DALY lost (%) /100,000 person-year All
-44 5.07 33,880,047 01,963 (3.0) 6 9,952 (4.2) 29
45-54 4.63 6,421,019 05,315 (8.2) 83 24,608 (10.5) 383
55-64 4.35 4,169,284 11,651 (18.0) 279 50,682 (21.6) 1,216
65-74 3.88 2,706,201 22,906 (35.4) 846 88,875 (37.9) 3,284
75-84 2.88 1,080,605 18,118 (28.0) 1,677 52,089 (22.2) 4,820
85- 1.73 228,160 04,735 (7.3) 2,075 8,192 (3.5) 3,590
Overall 3.79 48,485,316 64,688 (100.0) 133 234,399 (100.0) 483
Women
-44 4.50 16,381,725 000626 (1.9) 4 2,814 (2.5) 17
45-54 5.20 3,173,782 01,432 (4.4) 45 7,439 (6.6) 234
55-64 4.05 2,156,077 04,558 (14.0) 211 18,460 (16.3) 856
65-74 3.90 1,566,184 11,288 (34.7) 721 43,967 (38.8) 2,807
75-84 3.05 718,950 11,240 (34.5) 1,563 34,282 (30.3) 4,768
85- 1.83 171,984 03,433 (10.5) 1,996 6,282 (5.5) 3,653
Overall 3.63 24,168,702 32,577 (100.0) 135 113,244 (100.0) 469
Men
-44 5.28 17,498,322 01,337 (4.2) 8 7,053 (5.8) 40
45-54 4.46 3,247,237 03,883 (12.1) 120 17,299 (14.2) 533
55-64 4.49 2,013,207 07,093 (22.1) 352 31,812 (26.2) 1,580
65-74 3.87 1,140,017 11,618 (36.2) 1,019 44,904 (37.0) 3,939
75-84 2.67 361,655 06,878 (21.4) 1,902 18,364 (15.1) 5,078
85- 1.58 56,176 01,302 (4.1) 2,318 2,051 (1.7) 3,650
Overall 3.90 24,316,614 32,111 (100.0) 132 121,482 (100.0) 500
Population: 2004 mid-year population. Percentage in the parenthesis indicates the contribution of each age group to overall inci- dence or DALY lost.
DALY: disability-adjusted life years.
second-ranked age group, which was 55-64 years for men (ac- counting for 26.2%) and 75-84 years for women (accounting for 30.3%). These findings suggest that the major target popu-
lation for reducing societal stroke burden would be men aged 55-74 years and women aged 64-85 years.
As compared to the elderly, younger stroke survivors had a lower poststroke disability level but a higher DALY lost. This paradox is attributable to younger stroke survivors living lon- ger with disability and losing more years of life expectancy due to premature death compared to the elderly. The greater bur- den of living with disability in younger stroke survivors is well demonstrated in the analysis of relative contribution of YLD to DALY lost, which was substantially increased in the young- er age groups (Fig. 2). As a consequence, ischemic stroke bur- den in younger patients was magnified with a DALY metric as compared to an incidence metric. The contribution of those aged ≤64 years increased from 29.2% with an incidence mea- sure to 36.3% with a DALY measure (Table 2). These findings are in agreement with the general public’s perception of young- er stroke survivors being a greater burden to patients, their family, and society. Therefore, with regard to societal perspec- tives, stroke in younger age groups should be more aggressive- ly prevented and managed to reduce residual disability, despite its lower incidence.
This study has limitations. Ideally, the time periods of inci- dence, two stroke registries, and Korean life table for project- ing stroke survivors’ life expectancies should have been iden- tical, but there were small gaps across the databases. However, the small differences in each time period would not significant- ly jeopardize the validity of our findings. In projecting a na- tionwide ischemic stroke DALY burden in Korea, we used data from hospital-based registries, the extrapolation of which to the general Korean stroke population should be made with caution.
However, in Korea, more than 70% of acute stroke patients are admitted to secondary or tertiary hospitals,10 and the character- istics of our populations are similar to those in the Korean Stroke Registry, a prospective nationwide hospital-based stroke registry.17,18 Therefore, applying DALY values derived from our population to the Korean population seems reasonable and would be the best estimate when more representative data are unavailable.
In calculating DALY lost, the mRS disability level at 3 months was assumed to remain unchanged. Although more than 90% of stroke recovery occurs in the first 3 months,19 im- provement in disability that leads to a reduction in mRS level can occur thereafter. Furthermore, younger patients might have a greater potential to improve after the first 3-month period than the elderly. Thus, our DALY estimation may be an overes- timation, particularly in younger stroke survivors. Diagnostic coding errors or intentional miscodings for financial reimburse- ment are well-recognized limitations of the insurance database.
However, we did not fully explore their impact on our findings.
In conclusion, by integrating individual-patient data from Table 3. Estimation of Nationwide DALY lost from the data of
COMPASS and SNUBH alone rather than combined DALY [3, 1] lost
COMPASS SNUBH
All
-44 10,502 9,403
45-54 22,429 26,788
55-64 50,915 50,449
65-74 88,875 88,875
75-84 53,267 50,912
85- 8,286 8,097
Overall 234,275 234,523
Women
-44 2,930 2,698
45-54 7,131 7,747
55-64 20,465 16,454
65-74 44,136 43,797
75-84 34,394 34,170
85- 6,454 6,111
Overall 115,511 110,977
Men
-44 7,541 6,565
45-54 15,493 19,104
55-64 30,429 33,195
65-74 44,729 45,078
75-84 19,121 17,608
85- 1,992 2,109
Overall 119,305 123,659
COMPASS: Complication in Acute Stroke Study, DALY: disability- adjusted life years, SNUBH: Seoul National University Bundang Hospital.
Fig. 2. Relative contribution of YLL and YLD to DALY for each age group. The contribution of YLD to total DALY lost substantial- ly increased with decreasing ages. YLD: years of healthy life lost due to disability, YLL: years of life lost due to premature death, DALY: disability-adjusted life years.
5,104 15,413
7,482 710 36,118
43,588 68,031 9,195
14,564
8,501
20,844 4,848
Life years lost due to ischemic stroke for each age group YLL
YLD
0 20,000 40,000 60,000 80,000 100,000
-44 45-54 55-64 65-74 75-84 85-
well-qualified stroke registries and nationwide incidence data, we were able to generate the best estimate of ischemic stroke burden in Korea with a metric of healthy life years lost. Our finding of more than 230,000 healthy life years lost annually to ischemic stroke calls for prompt nationwide action. The age- and gender-specific features of ischemic burden could also be used to guide public health policy-making.
Conflicts of Interest
The authors have no financial conflicts of interest.
Acknowledgements
This work was supported by a grant from Inje University 2010 (K.-S.H.) and a grant (A060171) of the Korea Health 21 R&D project, Ministry of Health, Welfare and Family Affairs, Republic of Korea (K.-S.H.; H.-J.B.;
K.-H.Y.; B.-C.L).
REFERENCES
1. Murray CJ. Rethinking DALYs. In: CJL Murray and AD Lopez. The Global Burden of Disease and Injury Series. Vol 1. Cambridge, MA:
Harvard University Press. 1996;1-98.
2. WHO. Estimate of DALYs by sex, cause, and WHO region (http://
www.who.int/healthinfo/statistics/gbdwhoregiondaly2002.xls). Ac- cessed 10/26/2010.
3. Johnston SC, Mendis S, Mathers CD. Global variation in stroke burden and mortality: estimates from monitoring, surveillance, and modelling.
Lancet Neurol 2009;8:345-354.
4. O’Donnell MJ, Xavier D, Liu L, Zhang H, Chin SL, Rao-Melacini P, et al. Risk factors for ischaemic and intracerebral haemorrhagic stroke in 22 countries (the INTERSTROKE study): a case-control study. Lancet 2010;376:112-123.
5. Truelsen T, Begg S, Mathers C. The global burden of cerebrovascular disease (http://www.who.int/healthinfo/statistics/bod_cerebrovascu- lardiseasestroke.pdf). Accessed Oct/25/2010.
6. WHO. Global Burden of Disease 2004 Update: Disability Weights for diseases and conditions (www.who.int/healthinfo/global_burden_dis- ease/GBD2004_DisabilityWeights.pdf). Accessed Apr/2/2009.
7. Hong KS, Saver JL. Quantifying the value of stroke disability out-
comes: WHO global burden of disease project disability weights for each level of the modified Rankin Scale. Stroke 2009;40:3828-3833.
8. Hong KS, Saver JL. Years of disability-adjusted life gained as a result of thrombolytic therapy for acute ischemic stroke. Stroke 2010;41:471- 9. Hong KS, Saver JL, Kang DW, Bae HJ, Yu KH, Koo J, et al. Years of 477.
optimum health lost due to complications after acute ischemic stroke:
disability-adjusted life-years analysis. Stroke 2010;41:1758-1765.
10. Korean Center for Disease Control. Construction of National Surveil- lance System for Cardiovascular & Cerebrovascular Diseases. 2006.
11. Hong KS, Kang DW, Koo JS, Yu KH, Han MK, Cho YJ, et al. Impact of neurological and medical complications on 3-month outcomes in acute ischaemic stroke. Eur J Neurol 2008;15:1324-1331.
12. KOSIS. Life Tables for Korea, 2005 (http://www.kosis.kr/OLAP/
Analysis/stat_OLAP.jsp?tbl_id=DT_1B42&org_id=101&vwcd=MT_
ZTITLE&path=). Accessed Oct/11/2009.
13. Eriksson M, Norrving B, Terént A, Stegmayr B. Functional outcome 3 months after stroke predicts long-term survival. Cerebrovasc Dis 2008;25:423-429.
14. Slot KB, Berge E, Dorman P, Lewis S, Dennis M, Sandercock P; Ox- fordshire Community Stroke Project, the International Stroke Trial (UK); Lothian Stroke Register. Impact of functional status at six months on long term survival in patients with ischaemic stroke: prospective co- hort studies. BMJ 2008;336:376-379.
15. Fox-Rushby JA, Hanson K. Calculating and presenting disability ad- justed life years (DALYs) in cost-effectiveness analysis. Health Policy Plan 2001;16:326-331.
16. Lee H, Yoon SJ, Ahn HS, Moon OR. Estimation of potential health gains from reducing multiple risk factors of stroke in Korea. Public Health 2007;121:774-780.
17. Lee BC, Roh JK; Korean Stroke Registry. International experience in stroke registries: Korean Stroke Registry. Am J Prev Med 2006;31:
S243-S245.
18. Yu KH, Bae HJ, Kwon SU, Kang DW, Hong KS, Lee YS, et al. Anal- ysis of 10,811 cases with acute ischemic stroke from Korean stroke registry: Hospital-based multicenter prospective registration study. J Korean Neurol Assoc 2006;24:535-543.
19. Duncan PW, Goldstein LB, Matchar D, Divine GW, Feussner J. Mea- surement of motor recovery after stroke. Outcome assessment and sam- ple size requirements. Stroke 1992;23:1084-1089.