Background and Purpose To identify a metabolic network reflecting neurodegeneration in patients with idiopathic rapid eye movement (REM) sleep behavior disorder (iRBD).
Methods We recruited a prospective cohort comprising patients with de novo Parkinson’s disease (PD) with probable REM sleep behavior disorder (PDRBD, n=21), polysomnography- confirmed iRBD patients (n=28), and age-matched healthy controls (HC) (n=24). PDRBD-re- lated spatial covariance pattern (PDRBD-RP) were determined from 18F-fluorodeoxyglucose PET images of the PDRBD group and validated by reproduction in a separate PD cohort with polysomnography-confirmed REM sleep behavior disorder (n=11). We also confirmed via
18F-N-3-fluoropropyl-2β-carboxymethoxy-3β-(4-iodophenyl)-nortropane PET that none of our iRBD patients had any loss of dopamine transporters (DATs) suggestive of PD. Differences in the PDRBD-RP across groups were compared, and the clinical significance of these metabol- ic patterns in iRBD patients was further evaluated based on relationships with olfactory and cognitive functions, and striatal DAT densities.
Results The PDRBD-RP reflected the previously reported PD-related covariance pattern and additionally showed relative metabolic increases in the hippocampus and premotor cortex.
The PDRBD-RP gradually increased from the HC to iRBD patients and to the de novo and vali- dation PDRBD groups. In iRBD patients, the PDRBD-RP was negatively correlated with olfac- tory and frontal executive functions (age-controlled p<0.01 for both), and tended to be negative- ly correlated with the striatal DAT density, although this was insignificant after age adjustment.
During the mean follow-up period of 3.5 years, 5 of 11 iRBD patients with PDRBD-RP elevation had developed Lewy body diseases, whereas those without PDRBD-RP elevation had not.
Conclusions Our results suggest that PDRBD-RP is an effective biomarker for monitoring the progression to neurodegenerative disease in iRBD patients.
Key Words Parkinson’s disease, rapid eye movement sleep behavior disorder, functional neuroimaging, smell, positron-emission tomography.
A New Metabolic Network Correlated with Olfactory and Executive Dysfunctions in Idiopathic Rapid Eye Movement Sleep Behavior Disorder
INTRODUCTION
There is accumulating evidence that idiopathic rapid eye movement (REM) sleep behav- ior disorder (iRBD) is a prodromal symptom for Lewy body diseases such as Parkinson’s disease (PD).1 However, biomarkers predictive of neurodegeneration in iRBD have yet to be developed. An abnormal metabolic brain network in PD, known as PD-related covari- ance pattern (PD-RP), has been used to distinguish PD patients from healthy controls (HC) and from patients with atypical parkinsonian syndromes.2,3 A small proportion of iRBD patients show an elevated PD-RP relative to the corresponding HC values.4,5 Patients with iRBD who subsequently develop PD or dementia with Lewy bodies (DLB) showed an ele- Eun Jin Yoona,b,c
Jee-Young Leed,e Hyunwoo Namd,e Han-Joon Kime,f Beomseok Jeone,f Jae Min Jeongb,c Yu Kyeong Kima,b
a Departments of Nuclear Medicine and
d Neurology, Seoul Metropolitan Government-Seoul National University Boramae Medical Center, Seoul, Korea
b Departments of Nuclear Medicine and
e Neurology, Seoul National University College of Medicine, Seoul, Korea
c Institute of Radiation Medicine, Seoul National University
Medical Research Center, Seoul, Korea
f Department of Neurology, Seoul National University Hospital, Seoul, Korea
pISSN 1738-6586 / eISSN 2005-5013 / J Clin Neurol 2019;15(2):175-183 / https://doi.org/10.3988/jcn.2019.15.2.175
Received August 1, 2018 Revised November 1, 2018 Accepted November 6, 2018 Correspondence Jee-Young Lee, MD, PhD Department of Neurology, Seoul Metropolitan Government- Seoul National University Boramae Medical Center, 20 Boramae-ro 5-gil, Dongjak-gu, Seoul 07061, Korea
Tel +82-2-870-2476 Fax +82-2-831-2826 E-mail [email protected] Yu Kyeong Kim, MD, PhD Department of Nuclear Medicine, Seoul Metropolitan Government- Seoul National University Boramae Medical Center, 20 Boramae-ro 5-gil, Dongjak-gu, Seoul 07061, Korea
Tel +82-2-870-2581 Fax +82-2-870-3863 E-mail [email protected]
cc This is an Open Access article distributed under the terms of the Creative Commons Attribution Non-Com- mercial License (https://creativecommons.org/licenses/by-nc/4.0) which permits unrestricted non-commercial use, distribution, and reproduction in any medium, provided the original work is properly cited.
JCN
Open Access ORIGINAL ARTICLEPDRBD-Related Metabolic Network in Idiopathic RBD
JCN
vated PD-RP relative to those who remained unchanged.6 However, direct correlations of the PD-RP in iRBD patients with other prodromal signs such as hyposmia, cognitive, and dopamine transporter (DAT) loss have not been clearly dem- onstrated in previous studies. Regardless of the PD-RP, iRBD patients exhibit a unique metabolic pattern, known as the RBD-RP.4,7 In addition, RBD symptoms do not always precede or simultaneously appear at the time of a PD diagnosis, and a few PD patients do not manifest RBD. PD patients with RBD have predominant motor features of postural-instability gait disturbance, and are more frequently associated with auto- nomic dysfunction and dementia,8 synuclein pathology,9 and functional and structural brain changes than PD patients with- out RBD.10,11 We therefore investigated the specific metabolic pattern related to PD patients with RBD, and also analyzed it in iRBD patients to determine whether the metabolic pattern was related to the presence of other prodromal clinical and neuro- imaging markers.
In this study we identified a metabolic network that pre- dicts neurodegeneration in iRBD patients from a prospective cohort consisting of patients with de novo PD with probable RBD (PDRBD), iRBD patients confirmed by polysomnog- raphy, and age and sex-matched HC. To this end, we first ex- tracted the PDRBD-RP and validated this metabolic pattern in a separate cohort of PD patients with polysomnography-con- firmed RBD. Second, we evaluated the relationship between the PDRBD-RP and other prodromal markers including ol- factory and cognitive functions, and the striatal DAT density in patients with iRBD.
METHODS
Participants
The cohort in this study was prospectively recruited from the neurology clinic at the Seoul National University Boramae Hospital between 2013 and 2015. The inclusion criteria for participants aged 50 to 80 years for each group were as fol- lows: The PDRBD group was defined as subjects who were drug-naïve and first diagnosed with PD according to the di- agnostic criteria of the UK PD Society Brain Bank, and who had a history of probable RBD preceding parkinsonian symp- toms. Probable RBD was screened based on the RBD screen- ing questionnaire (RBDSQ) with a cutoff score of >5.12 The iRBD group comprised subjects diagnosed according to the criteria of the second edition of the International Classifica- tion of Sleep Disorders13 and confirmed by video polysom- nography. HC who were age matched for the patient groups were also recruited during the study period. The exclusion criteria were the presence of white-matter changes or struc- tural lesions unrelated to PD, a history of psychiatric or cog-
nitive illness that affected RBD symptoms, and the presence of neurological diseases other than PD.
Totals of 21 patients with PDRBD, 28 patients with iRBD, and 24 HC were enrolled in the present study. To validate the PDRBD-RP, we included 11 PD patients with RBD as confirmed by polysomnography. The characteristics of the val- idated PDRBD group and the comparison with the de novo PDRBD group are presented in Supplementary Table 1 (in the online-only Data Supplement).
All participants underwent a general neurological evalu- ation for any neurological signs of brain diseases and were evaluated for parkinsonian symptoms using the Unified PD Rating Scale as revised by the Movement Disorders Society Task Force (MDS-UPDRS). The iRBD patients also under- went tests for olfactory and cognitive functions. The olfac- tory function was evaluated using the butanol threshold test (BTT) and the short smell identification test (SSIT).14,15 We categorized iRBD patients into anosmia and normosmia according to the BTT and SSIT scores (anosmia, concentra- tions of 0–5 in the SSIT and 0–4 in the BTT; normosmia, concentrations of 8–12 in the SSIT and 7–9 in the BTT).
Subjects exhibiting a deficit in only one test or exhibiting moderate scores in both tests were categorized as the inter- mediate group. Cognitive function was examined using a bat- tery of neuropsychological tests validated in the Korean pop- ulation, consisting of the Stroop Color and Word Test, trail- making test (TMT) A/B, digit-span test, Controlled Oral Word Association Test (semantic/phonemic), Korean version of the Boston Naming Test, Seoul Verbal Learning Test, and Rey Complex Figure Test (RCFT) copying.16
The performance on the neuropsychological tests was trans- formed into a z score based on the age- and education-adjust- ed normative performance data. This study was registered at clinicaltrials.gov (NCT02984137), and the study protocol was approved by the Institutional Review Board of our insti- tution (IRB No. 16-2013-101). All subjects provided written informed consent before enrolling in this study, in accordance with the Declaration of Helsinki.
Image acquisition and processing
Two PET scans were performed using a PET/CT scanner (Gemini TF64, Philips Healthcare, Best, the Netherlands). All participants underwent 18F-fluorodeoxyglucose (18F-FDG) PET to identify the disease-related spatial covariance patterns.
The 10-min emission scan started 40 min after the intrave- nous injection of 4.8 MBq/kg 18F-FDG. Images were recon- structed using a 3-dimensional row action maximum-like- lihood algorithm set to 90 2-mm-thick slices in a 128×128 matrix, with correction for attenuation and scatter. 18F-FDG PET images were processed using SPM8 software (Statistical
Yoon EJ et al.
JCN
Parametric Mapping 8; http://www.fil.ion.ucl.ac.uk/spm/) running on MATLAB 7.11 (MathWorks, Natick, MA, USA).
Individual 18F-FDG PET images were spatially normalized to the study-specific template and smoothed using an isotropic Gaussian kernel with a 12-mm full-width at half-maximum.
All of the patients plus 12 HC underwent 18F-N-3-fluoro- propyl- 2β-carboxymethoxy-3β-(4-iodophenyl)-nortropane (18F-FP-CIT) PET to image the DAT density. The 10-min emission scan started 150 min after the injection of 185 MBq
18F-FP-CIT, and the images were reconstructed in a manner similar to that used for the 18F-FDG PET images.
The anatomical regions of interest (ROIs) for 18F-FP-CIT PET were the caudate nucleus, putamen, and cerebellum.
These ROIs were obtained automatically using T1-weighted images with the segmentation tool FSL-FIRST (http://fsl.
fmrib.ox.ac.uk/fsl/fslwiki/first). The putamen was divided into anterior and posterior halves along its longitudinal axis in the transaxial plane. Left and right ROI values were aver- aged for each structure. The DAT binding of 18F-FP-CIT was determined as the (region-cerebellum)/cerebellum uptake count ratio.
Metabolic brain network analysis
To identify and characterize a significant spatial covariance pattern associated with the disease, 18F-FDG PET images were analyzed using scaled subprofile model/principal com- ponent analysis implemented in ScAnVP (Scan Analysis and Visualization Processor, version 7.0w; http://feinstein- neuroscience.org/).3 Each PDRBD-RP and RBD-RP was identified from the 18F-FDG PET data of each disease group in combination with those derived from HC. The disease- related pattern was determined among the principal com- ponents (PCs) that accounted for the top 50% of the vari- ance in the data. Subject scores for the selected PCs were entered both singularly and in all possible combinations into a series of linear regression models, with the group as the dependent variable. The model with the lowest Akaike infor- mation criterion value was selected to represent the disease- related pattern. The reliability of the resulting topography was evaluated using a bootstrap resampling procedure (p<0.05).17
The values of the PDRBD-RP and RBD-RP were quanti- fied in all participants using a voxel-based pattern quantifi- cation algorithm, and were Z-transformed using the values for HC for each network. The PDRBD-RP and RBD-RP were compared topographically using a voxel-by-voxel correla- tion method included in the ScAnVP software.
Statistical analysis
Group differences in demographic and clinical variables were evaluated using one-way ANOVA, the chi-square test, and
the independent-samples t-test as appropriate. Differences in the network and 18F-FP-CIT uptake in each ROI across subject groups were assessed using one-way ANOVA followed by post-hoc Tukey’s honestly significant difference tests.
Correlations between each disease-related pattern and clini- cal measures such as the MDS-UPDRS motor rating, striatal DAT density, scores on olfactory function tests, and z scores of neuropsychological tests were evaluated using Pearson’s correlation coefficients.
We found significant correlations between the PDRBD-RP expression and age in the iRBD group (r=0.553, p=0.002) and not in the PDRBD group (r=0.375, p=0.094). Therefore, a stepwise multiple regression analysis was used to evaluate the independent correlations between the PDRBD-RP expres- sion and clinical measures after controlling for age. Differences in each pattern expression between anosmic and normos- mic iRBD patients were evaluated using analysis of covariance, with age as the covariate. Statistical analyses were performed using SPSS 13.0 software (SPSS Inc., Chicago, IL, USA), with significance level set at 0.05, and with Bonferroni correction applied to multiple tests if appropriate.
RESULTS
Demographic and clinical characteristics
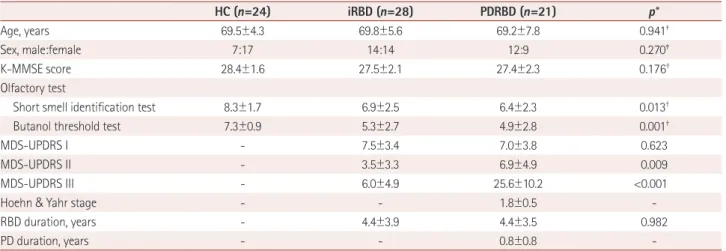
The demographic and clinical characteristics of the partici- pants finally included in the analyses are presented in Table 1.
Based on the results obtained from the olfactory function tests, 8 iRBD patients manifested anosmia (29%) and 10 iRBD pa- tients had normal olfactory function (36%). Regarding the neuropsychological function in iRBD patients, the average z scores for all tests were within 1 SD of the normative data ex- cept for TMT-B (-1.03 SD) and RCFT copying (-2.07 SD).
Scores for the iRBD patients on tests of olfactory and cog- nitive functions are presented in Supplementary Table 2 (in the online-only Data Supplement).
DAT density
The DAT density as measured by the 18F-FP-CIT uptake dif- fered significantly among the three groups in all striatal ROIs:
the posterior putamen [F(2,58)=48.68], anterior putamen [F(2,58)=34.53], and caudate [F(2,58)=13.78]. The post-hoc comparisons adjusted for multiple comparisons revealed no significant difference between the iRBD group and HC, while the DAT uptake level in the iRBD group was intermediate between those in the HC and PDRBD patients in all ROIs.
The DAT densities are presented in detail in Table 2.
Disease-related metabolic patterns
Among the top PCs accounting for 50% of the variance, we
PDRBD-Related Metabolic Network in Idiopathic RBD
JCN
identified the PDRBD-RP as the linear combination of PCs 1–4 that accounted for 10.1% of the subject × voxel variance.
The pattern was characterized by increased metabolism in the primary motor cortex, supplementary motor area (SMA), premotor cortex, thalamus, putamen/globus pallidus, rostral and orbital parts of the superior frontal cortex, cerebellum, pons, and parahippocampal gyrus, and decreases in the oc- cipital and posterior parietal cortices (Fig. 1A). The RBD-RP was identified as the third PC accounting for 8.9% of the subject × voxel variance. The RBD-RP showed considerable overlap with the PDRBD-RP in several brain areas, including the SMA, premotor cortex, putamen, parahippocampal gy- rus, and occipital and posterior parietal cortices (Fig. 1C). A significant voxelwise correlation was found in the two dis- ease-related metabolic patterns (r=0.67, p<0.001).
The PDRBD-RP and RBD-RP differed significantly among the groups [F(2,71)=22.09 and F(2,71)=11.36, respectively; p<
0.001]. The PDRBD-RP showed a gradual increase from HC to iRBD patients and to PDRBD patients. The PDRBD-RP in iRBD patients was significantly elevated relative to HC (p<
0.001), but lower than in patients with PDRBD (p=0.019) (Fig.
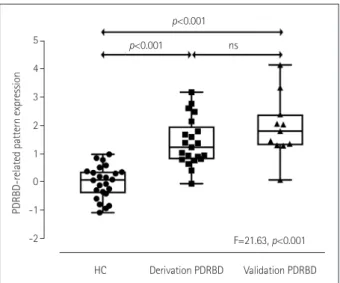
1B). The validation PDRBD group showed a significantly increased PDRBD-RP similar to that in the de novo PDRBD group [F(2,54)=21.63, p<0.001] (Fig. 2). The RBD-RP was elevated in both the iRBD (p=0.002) and PDRBD (p<0.001) groups relative to the HC group, with no significant difference between these two groups (Fig. 1D).
PDRBD-RP was correlated with olfactory impairment, executive function, and mild parkinsonian signs in iRBD
Both the BTT and SSIT scores were correlated negatively with the PDRBD-RP in patients with iRBD (r=-0.646 and p=
0.001, and r=-0.481 and p=0.017, respectively) (Fig. 3A and B). After controlling for age, the PDRBD-RP was significant- ly associated with the BTT score (p=0.007) but not with the SSIT score. The iRBD patients with anosmia showed an ele- vated PDRBD-RP compared with normosmic iRBD patients [F(1, 15)=9.572, p=0.007; Fig. 3C]. In neuropsychological tests, the reaction time in TMT-B was negatively correlated with the PDRBD-RP in iRBD patients (r=-0.581, p=0.002, age- controlled p=0.006) (Fig. 3D). The PDRBD-RP in iRBD pa- Table 1. Demographic and clinical characteristics of the participants included in the final analysis
HC (n=24) iRBD (n=28) PDRBD (n=21) p*
Age, years 69.5±4.3 69.8±5.6 69.2±7.8 0.941†
Sex, male:female 7:17 14:14 12:9 0.270‡
K-MMSE score 28.4±1.6 27.5±2.1 27.4±2.3 0.176†
Olfactory test
Short smell identification test 8.3±1.7 6.9±2.5 6.4±2.3 0.013†
Butanol threshold test 7.3±0.9 5.3±2.7 4.9±2.8 0.001†
MDS-UPDRS I - 7.5±3.4 7.0±3.8 0.623
MDS-UPDRS II - 3.5±3.3 6.9±4.9 0.009
MDS-UPDRS III - 6.0±4.9 25.6±10.2 <0.001
Hoehn & Yahr stage - - 1.8±0.5 -
RBD duration, years - 4.4±3.9 4.4±3.5 0.982
PD duration, years - - 0.8±0.8 -
Data are mean±SD or n values.
*Independent t-test except where indicated otherwise, †One-way ANOVA, ‡Chi-square test.
HC: healthy controls, iRBD: idiopathic rapid eye movement sleep behavior disorder, K-MMSE: Korean version of the Mini Mental State Examination, MDS-UPDRS: Unified Parkinson’s disease Ratings Scale as revised by the Movement Disorders Society Task Force, PD: Parkinson’s disease, PDRBD: de novo Parkinson’s disease with probable rapid eye movement sleep behavior disorder.
Table 2. Uptake of 18F-FP-CIT-nortropane in the three study groups
HC iRBD PDRBD p*
Overall HC vs. iRBD HC vs. PDRBD iRBD vs. PDRBD
Posterior putamen 5.00±0.91 4.26±1.39 1.67±0.55 <0.001 0.125 <0.001 <0.001
Anterior putamen 5.72±0.96 4.96±1.34 2.76±0.82 <0.001 0.122 <0.001 <0.001
Caudate 4.07±0.81 3.50±1.16 2.30±0.93 <0.001 0.246 <0.001 0.001
Data are mean±SD values.
*One-way ANOVA with post-hoc Tukey’s HSD tests.
18F-FP-CIT: 18F-N-3-fluoropropyl-2β-carboxymethoxy-3β-(4-iodophenyl)-nortropane, HC: healthy controls, HSD: honestly significant difference, iRBD:
idiopathic rapid eye movement sleep behavior disorder, PDRBD: de novo Parkinson’s disease with probable rapid eye movement sleep behavior disorder.
Yoon EJ et al.
JCN
tients showed a tendency for a positive correlation with MDS- UPDRS motor scores (r=0.369, p=0.053), and a trend of a negative correlation with DAT densities in the posterior pu- tamen (r=-0.468, p=0.012), anterior putamen (r=-0.437, p=
0.02), and caudate (r=-0.519, p=0.005) regions, but the sta- tistical significance did not remain after controlling for age (age-controlled p=0.183, 0.232, and 0.134, respectively).
The RBD-RP expression was correlated with olfactory impairment, executive function, and mild parkinsonian signs in iRBD
The RBD-RP in iRBD patients was negatively correlated with the BTT score (r=-0.592, p=0.002, age-controlled p=0.003) but not with the SSIT score. Patients with anosmia showed an elevated iRBD-RP compared to those with normosmia [F(1, 15)=8.378, p=0.011) (Fig. 3E), although there were signifi- cant overlaps between the two RBD subgroups. The reac- Fig. 1. Disease-related metabolic patterns in the various study groups. A: The de novo Parkinson’s disease with probable RBD-PDRBD-RP identi- fied by network analysis of 18F-FDG PET scans in 21 PDRBD patients and 24 age- and gender-matched HC. Voxels with warm colors represent pos- itive regions (metabolic increases) and those with cool colors are negative regions (metabolic decreases). B: The PDRBD-RP differed significantly among the groups, as determined by one-way ANOVA followed by post-hoc Tukey’s HSD tests. The PDRBD-RP increased gradually from HC to iRBD and then to PDRBD. C: The RBD-RP identified by the network analysis of 18F-FDG PET scans of 28 iRBD patients and 24 age- and gender-matched HC. Voxels with warm colors represent positive regions (metabolic increases) and those with cool colors denote negative regions (metabolic decreas- es). D: The RBD-RP differed significantly among the groups, as determined by one-way ANOVA followed by post-hoc Tukey’s HSD tests. The pattern was higher in both patient groups than in HC, with no difference between the two patient groups. 18F-FDG: 18F-fluorodeoxyglucose, GP: globus pallidus, HC: healthy controls, HSD: honestly significant difference, iRBD: idiopathic rapid eye movement sleep behavior disorder, PDRBD-RP: de novo Parkinson’s disease with probable rapid eye movement sleep behavior disorder-related spatial covariance pattern, RBD: rapid eye movement sleep be- havior disorder, RBD-RP: rapid eye movement sleep behavior disorder-related spatial covariance pattern, SMA: supplementary motor area.
Color
4
2
0
-2
-4 4 3 2 1 0 -1 -2
RBD-related pattern expression PDRBD-related pattern expression
HC iRBD PDRBD HC iRBD PDRBD
F=11.359, p<0.001 F=22.087, p<0.001
p<0.001 p<0.001
p=0.019 p=0.019
p<0.001 p<0.001
Premotor Primary motor
Premotor
Putamen Putamen/GP
Lingual
Lingual Thalamus
Posterior parietal
Posterior parietal Hippocampus
Hippocampus SMA
SMA
Occipital
Occipital
z=+54 z=+43
z=+43 z=+5
z=+5 z=+54
Pons
z=-25
z=-25 x=4
x=4
3
0.8 -3
-0.8 3
0.7 -3
-0.9 z-score
z-score RBD-related metabolic pattern
PDRBD-related metabolic pattern PDRBD-related metabolic pattern expression
RBD-related metabolic pattern expression
A
C
B
D
Cerebellum
PDRBD-Related Metabolic Network in Idiopathic RBD
JCN
tion time in TMT-B also showed a negative correlation with the RBD-RP (r=-0.426, p=0.034; age-controlled p=0.037).
The RBD-RP in iRBD patients was not correlated with MDS- UPDRS motor scores or the striatal DAT density.
DISCUSSION
This study found that the PDRBD-RP showed relative meta- bolic increases in major elements of the motor cortico-stria- to-pallido-thalamocortical circuits and relative metabolic de- creases in the occipital and parietal cortices. The PDRBD showed a positive correlation with the MDS-UPDRS motor ratings (r=0.719, age-adjusted p<0.001), suggesting that the PDRBD-RP resembles the PD-RP previously associated with parkinsonian motor symptoms in PD patients.2,3 In contrast to the PD-RP, the PDRBD-RP is characterized by relative hy- permetabolism in the hippocampus and premotor cortex.
Relative hypermetabolism in the hippocampus has been con- sistently identified in the current and previous RBD-RPs.4,7 The hippocampal hyperperfusion was associated with the risk of neurodegeneration in iRBD patients,18 and interac- tions between the dopaminergic system and the hippocam-
Fig. 3. Correlations of nonmotor Parkinson’s disease features in iRBD with the PDRBD-RP and RBD-RP. Correlations of the PDRBD-RP (A) and RBD- RP (D) with olfactory function (butanol threshold test). Comparisons of the PDRBD-RP (B) and RBD-RP (E) between the normosmic and anosmic iRBD patients. Correlations of the PDRBD-RP (C) and RBD-RP (F) with the reaction time z score in trail-making test B. The correlation analysis were performed using Pearson’s correlation coefficient, and the group comparisons were performed using analysis of covariance, with age as the covari- ate. iRBD: idiopathic rapid eye movement sleep behavior disorder, PDRBD-RP: de novo Parkinson’s disease with probable rapid eye movement sleep behavior disorder-related spatial covariance pattern, RBD-RP: rapid eye movement sleep behavior disorder-related spatial covariance pattern.
Fig. 2. Validation of the PDRBD-RP in a separate Parkinson’s disease cohort with rapid eye movement sleep behavior disorder confirmed by polysomnography. Compared with HC, the validation PDRBD group showed a significantly increased PDRBD-RP that was similar to that in the de novo PDRBD group. HC: healthy controls, PDRBD-RP: de novo Parkinson’s disease with probable rapid eye movement sleep be- havior disorder-related spatial covariance pattern, ns: not significant.
5 4
3 2
1 0 -1
-2
PDRBD-related pattern expression
HC Derivation PDRBD Validation PDRBD F=21.63, p<0.001 p<0.001
p<0.001 ns
-1 0 1 2 3 RBD-related pattern expression r=-0.592, p=0.002
12 10 8 6 4 2 0
Scores
Anosmia Normosmia 3
2
1
0
RBD-related pattern expression -1
p=0.001
-1 0 1 2 3 RBD-related pattern expression 2
0
-2
-4
-6
z scores
r=-0.426, p=0.034 12
10 8 6 4 2 0
3
2
1
0
-1
2
0
-2
-4
-6
Scores PDRBD-related pattern expression z scores
-1 0 1 2 3 PDRBD-related pattern expression
Butanol threshold test Anosmia vs. normosmia Trail making test B
r=-0.646, p=0.001
Anosmia Normosmia -1 0 1 2 3 PDRBD-related pattern expression p=0.002
r=-0.582, p=0.002
A B C
F E
D
Yoon EJ et al.
JCN
pus is an important function in the brain for synaptic plas- ticity, adaptation, and motivated behaviors and learning, which is also implicated in the pathophysiology of nonmo- tor symptoms in PD.19 The elevated metabolic activity in the premotor cortex of the PDRBD-RP contrasts with the PD- RP previously showing decreased metabolic activity in the same region.2,3 The discrepancy between the PDRBD-RP and PD-RP might be due to a distinctive feature of our study population. Our PD patients were very-early-stage de novo PD patients who concurrently manifested RBD symptoms. In a previous study of very-early-stage PD patients, the PD-RP was topographically similar to those at more advanced stag- es of PD, but the PD-RP in that study did not include the relative hypometabolism in the premotor cortex20 evident in our PDRBD-RP. Previous functional imaging studies have shown increased premotor cortical activity as an important compensatory mechanism in PD patients during sequential movements.21 On the other hand, brain regions within the RBD-RP were also found within regions of the PDRBD-RP. The PDRBD-RP gradually increased from the HC to the iRBD and PDRBD groups; however, the RBD-RP did not differ significantly between patients with PDRBD and iRBD. Our results suggest that the PDRBD-RP includes both pathophysi- ological aspects of iRBD and compensatory or adaptive mech- anisms of early PD in addition to motor features captured by the PD-RP.
We found that the PDRBD-RP expression showed a sig- nificant correlation with olfactory and executive dysfunctions in iRBD patients. Hyposmia is one of the premotor symp- toms of Lewy body diseases,22 and is also frequently observed in iRBD patients.23 Moreover, the presence of hyposmia is linked to a high probability of neurodegeneration in iRBD patients.24 Defective cognitive performance and mild cog- nitive impairment (MCI) are frequent features of iRBD pa- tients.25,26 Compared with iRBD patients without MCI, those with MCI showed abnormal brain changes such as waking EEG slowing in the posterior cortical regions,27 and hyper- perfusion in the putamen and paracentral regions,28 which is similar to brain changes observed in PD and DLB patients.
Actually these brain changes are consistent with our study results, since the PDRBD-RP showed relative occipital hy- pometabolism, as also seen in the RBD-RP. Another study found that cognitive changes in iRBD predicted neurode- generation.29 The PDRBD-RP was correlated with frontal ex- ecutive function scores but not memory or visuospatial task scores in our iRBD patients. Executive dysfunction is the most common cognitive deficit detected in early PD,30 and at- tention and frontal executive dysfunctions have been recently reported as significant indicators of neurodegeneration in iRBD patients, and also DLB-type neurodegeneration.29 Thus,
the correlation with olfactory and executive dysfunctions in iRBD patients supports the utility of the PDRBD-RP in detect- ing early neurodegeneration in iRBD.
Other interesting findings that should be highlighted are the correlations of the RBD-RP with the olfactory function and frontal executive function scores, although these correla- tions were weaker than those for the PDRBD-RP, and there was a large overlap in the RBD-RP expression between anos- mic and normosmic iRBD patients, unlike for the PDRBD- RP. Future studies should compare longitudinal changes be- tween the RBD-RP and the PDRBD-RP because the former might evolve into the latter as the disease progresses.
The iRBD patients in the present study showed a DAT den- sity intermediate between those of the PDRBD patients and HC, with a negative correlation between the PDRBD-RPs. A particularly interesting finding was that the PDRBD-RP was abnormally elevated in about 40% of the iRBD patients (11 of 28) based on the cutoff level of 1.2 (2 SDs from normal values). However, only about half of them (6 of 11; blue square dots in Supplementary Fig. 1 in the online-only Data Supplement) showed decreases in the striatal DAT density (average 18F-FP-CIT uptake in the caudate and putamen) of more than 2 SDs below the normal values, and the remain- ing 5 iRBD patients with an elevated PDRBD-RP showed normal DAT densities (red square dots in Supplementary Fig. 1 in the online-only Data Supplement). Among patients with an elevated PDRBD-RP, no age differences existed be- tween the subgroups with normal and low DAT densities (p=
0.096, Mann-Whitney U test), suggesting that the PDRBD- RP increases before the loss of DAT in iRBD patients, or that an elevated PDRBD-RP with or without DAT loss predicts the progression into the DLB and PD phenotypes of Lewy body diseases, which are two clinical correlates of cortical and brainstem Lewy body diseases in iRBD patients.31 After completing the baseline evaluation, our iRBD patients were prospectively monitored with a 4-year follow-up plan. Up to, 5 of the 11 iRBD patients with an elevated PDRBD-RP had developed Lewy body diseases, 2 were lost to follow-up, and the remaining 4 had an unchanged disease status.
One previous study found that the PD-RP was elevated both in iRBD patients with hyposmia and in patients with abnormal DAT binding.5 However, that study found no sig- nificant correlation between the PD-RP and olfactory scores or DAT binding in iRBD patients. The authors suggested that three markers (the PD-RP, olfaction, and DAT imaging) can provide complementary information. We showed direct correlations of the PDRBD-RP with olfactory and executive function scores, and an interesting relationship with DAT binding as described above. Thus, the PDRBD-RP probably reflects pathophysiological changes related to prodromal-
PDRBD-Related Metabolic Network in Idiopathic RBD
JCN
phase Lewy body diseases in iRBD patients better than the previous PD-RP, although direct comparisons are needed in future studies.
A few limitations of this study should be considered. First, the RBD in patients in the de novo PDRBD group was not confirmed by polysomnography. However, the RBDSQ showed adequate internal consistency in PD patients and appropriate validity for the screening of RBD in this popu- lation, with a recommended cutoff score of 6.32 In addition, we also reproduced the PDRBD-RP in a separate PD cohort manifesting RBD that was confirmed by polysomnography, suggesting that the PDRBD-RP is specific to PDRBD. Second, we did not examine the PDRBD-RP in patients with multiple- system atrophy (MSA). However, MSA from iRBD is rela- tively rare and MSA patients usually do not exhibit hypos- mia as a prodromal sign. Our hyposmic RBD patients were therefore less likely to have prodromal-stage MSA. Third, we did not consider DLB separately from PD because it shares the pathology of Lewy bodies with PD, and for the prodromal stages both conditions are considered to fall along a spectrum of Lewy body diseases consisting of constipation, RBD, and hyposmia. In addition, PD evolving from iRBD is primarily a postural-instability gait-disorder type of PD that is linked to certain nonmotor symptoms such as autonomic dys- function, dementia, and visual hallucination, which are also typical features of DLB. Separating PD and DLB would there- fore be meaningless in the present prodromal study and, for the same reason, the PDRBD-RP looks more valuable than the previous PD-RP if we incorporate both the types of PD and DLB as our primary research focus.
The findings of this study indicate that the PDRBD-RP represents an appropriate candidate marker of early neuro- degeneration in iRBD patients. A long-term follow-up of the PDRBD-RP in combination with olfactory, cognitive, and DAT changes in our iRBD cohort is essential to evaluate its role in both clinical and research settings.
Supplementary Materials
The online-only Data Supplement is available with this arti- cle at https://doi.org/10.3988/jcn.2019.15.2.175.
Conflicts of Interest
The authors have no potential conflicts of interest to disclose.
Acknowledgements
This work was supported by the National Research Foundation of Korea (NRF) grant funded by the Korea government (MEST) (No. NRF-2013 R1A2A1A05006227, 2014M3C7A1046042, 2016R1D1A1B03936159 and 2018R1A5A2025964).
REFERENCES
1. Boeve BF. Idiopathic REM sleep behaviour disorder in the develop-
ment of Parkinson’s disease. Lancet Neurol 2013;12:469-482.
2. Eckert T, Van Laere K, Tang C, Lewis DE, Edwards C, Santens P, et al. Quantification of Parkinson’s disease-related network expression with ECD SPECT. Eur J Nucl Med Mol Imaging 2007;34:496-501.
3. Ma Y, Tang C, Spetsieris PG, Dhawan V, Eidelberg D. Abnormal met- abolic network activity in Parkinson’s disease: test-retest reproducibil- ity. J Cereb Blood Flow Metab 2007;27:597-605.
4. Wu P, Yu H, Peng S, Dauvilliers Y, Wang J, Ge J, et al. Consistent ab- normalities in metabolic network activity in idiopathic rapid eye movement sleep behaviour disorder. Brain 2014;137:3122-3128.
5. Meles SK, Vadasz D, Renken RJ, Sittig-Wiegand E, Mayer G, Dep- boylu C, et al. FDG PET, dopamine transporter SPECT, and olfac- tion: combining biomarkers in REM sleep behavior disorder. Mov Disord 2017;32:1482-1486.
6. Holtbernd F, Gagnon JF, Postuma RB, Ma Y, Tang CC, Feigin A, et al. Abnormal metabolic network activity in REM sleep behavior dis- order. Neurology 2014;82:620-627.
7. Meles SK, Renken RJ, Janzen A, Vadasz D, Pagani M, Arnaldi D, et al. The metabolic pattern of idiopathic REM sleep behavior disorder reflects early-stage Parkinson’s disease. J Nucl Med 2018;59:1437- 1444.
8. Postuma RB, Gagnon JF, Vendette M, Charland K, Montplaisir J.
REM sleep behaviour disorder in Parkinson’s disease is associated with specific motor features. J Neurol Neurosurg Psychiatry 2008;79:
1117-1121.
9. Postuma RB, Adler CH, Dugger BN, Hentz JG, Shill HA, Driver- Dunckley E, et al. REM sleep behavior disorder and neuropathology in Parkinson’s disease. Mov Disord 2015;30:1413-1417.
10. Lim JS, Shin SA, Lee JY, Nam H, Lee JY, Kim YK. Neural substrates of rapid eye movement sleep behavior disorder in Parkinson’s disease.
Parkinsonism Relat Disord 2016;23:31-36.
11. Li D, Huang P, Zang Y, Lou Y, Cen Z, Gu Q, et al. Abnormal baseline brain activity in Parkinson’s disease with and without REM sleep be- havior disorder: a resting-state functional MRI study. J Magn Reson Imaging 2017;46:697-703.
12. Stiasny-Kolster K, Mayer G, Schäfer S, Möller JC, Heinzel-Gutenbrun- ner M, Oertel WH. The REM sleep behavior disorder screening ques- tionnaire--a new diagnostic instrument. Mov Disord 2007;22:2386- 2393.
13. American Academy of Sleep Medicine. The International Classifica- tion of Sleep Disorder: diagnostic and coding manual. 2nd ed. West- chester, IL: American Academy of Sleep Medicine, 2005.
14. Doty RL, Marcus A, Lee WW. Development of the 12-item Cross-Cul- tural Smell Identification Test (CC-SIT). Laryngoscope 1996;106:353- 15. Kim BG, Oh JH, Choi HN, Park SY. Simple assessment of olfaction in 356.
patients with chronic rhinosinusitis. Acta Otolaryngol 2015;135:258- 16. Kang Y, Na DL. Seoul Neuropsychological Screening Battery. Seoul: 263.
Human Brain Research & Consulting Co., 2003.
17. Habeck C, Foster NL, Perneczky R, Kurz A, Alexopoulos P, Koeppe RA, et al. Multivariate and univariate neuroimaging biomarkers of Alzheimer’s disease. Neuroimage 2008;40:1503-1515.
18. Dang-Vu TT, Gagnon JF, Vendette M, Soucy JP, Postuma RB, Mont- plaisir J. Hippocampal perfusion predicts impending neurodegenera- tion in REM sleep behavior disorder. Neurology 2012;79:2302-2306.
19. Calabresi P, Castrioto A, Di Filippo M, Picconi B. New experimental and clinical links between the hippocampus and the dopaminergic system in Parkinson’s disease. Lancet Neurol 2013;12:811-821.
20. Ma Y, Tang C, Moeller JR, Eidelberg D. Abnormal regional brain function in Parkinson’s disease: truth or fiction? Neuroimage 2009;45:
260-266.
21. Sabatini U, Boulanouar K, Fabre N, Martin F, Carel C, Colonnese C, et al. Cortical motor reorganization in akinetic patients with Parkin- son’s disease: a functional MRI study. Brain 2000;123:394-403.
Yoon EJ et al.
JCN
22. Doty RL. Olfactory dysfunction in Parkinson disease. Nat Rev Neu- rol 2012;8:329-339.
23. Fantini ML, Postuma RB, Montplaisir J, Ferini-Strambi L. Olfactory deficit in idiopathic rapid eye movements sleep behavior disorder.
Brain Res Bull 2006;70:386-390.
24. Mahlknecht P, Iranzo A, Högl B, Frauscher B, Müller C, Santamaría J, et al. Olfactory dysfunction predicts early transition to a Lewy body disease in idiopathic RBD. Neurology 2015;84:654-658.
25. Massicotte-Marquez J, Décary A, Gagnon JF, Vendette M, Mathieu A, Postuma RB, et al. Executive dysfunction and memory impairment in idiopathic REM sleep behavior disorder. Neurology 2008;70:1250- 1257.
26. Gagnon JF, Vendette M, Postuma RB, Desjardins C, Massicotte-Mar- quez J, Panisset M, et al. Mild cognitive impairment in rapid eye movement sleep behavior disorder and Parkinson’s disease. Ann Neu- rol 2009;66:39-47.
27. Rodrigues Brazète J, Montplaisir J, Petit D, Postuma RB, Bertrand JA, Génier Marchand D, et al. Electroencephalogram slowing in rapid eye movement sleep behavior disorder is associated with mild cogni-
tive impairment. Sleep Med 2013;14:1059-1063.
28. Vendette M, Montplaisir J, Gosselin N, Soucy JP, Postuma RB, Dang- Vu TT, et al. Brain perfusion anomalies in rapid eye movement sleep behavior disorder with mild cognitive impairment. Mov Disord 2012;
27:1255-1261.
29. Génier Marchand D, Montplaisir J, Postuma RB, Rahayel S, Gagnon JF. Detecting the cognitive prodrome of dementia with Lewy bodies: a prospective study of REM sleep behavior disorder. Sleep 2017;40:zsw014.
30. Tröster AI. Neuropsychological characteristics of dementia with Lewy bodies and Parkinson’s disease with dementia: differentiation, early detection, and implications for “mild cognitive impairment” and bio- markers. Neuropsychol Rev 2008;18:103-119.
31. Halliday GM, Holton JL, Revesz T, Dickson DW. Neuropathology underlying clinical variability in patients with synucleinopathies. Acta Neuropathol 2011;122:187-204.
32. Chahine LM, Daley J, Horn S, Colcher A, Hurtig H, Cantor C, et al.
Questionnaire-based diagnosis of REM sleep behavior disorder in Parkinson’s disease. Mov Disord 2013;28:1146-1149.