1. 서 론
대기로부터 침적과정은 대기 오염물질의 제거 과 정인 동시에 다른 환경매체로의 이동과정이다. 따라 서, 대기 침적과정은 인체 위해성, 토양 오염, 생태계
파괴 등과 같은 여러 문제를 일으킬 수 있다. 대기 침적과정은 크게 습식과 건식침적으로 나뉜다. 건식 침적은 기체와 입자상 오염물질들이 강우나 강설 현 상 없이 대기 오염물질이 지표면으로 이동하는 현상 을 뜻한다. 건식침적은 인위적 힘을 가하지 않고 자 연 상태를 모사해야하기 때문에 측정이 어렵다. 기존 에 적용한 건식침적 방법은 평평한 판(plate)에 그리 스, 알루미늄 호일과 같은 대체 물질 (surrogate mat-
서울시 대기 중 입자상 다환방향족 탄화수소의 계절별 건식침적 특성
이 지 이∙김 용 표*∙강 창 희
1)이화여자대학교 환경학과
1)제주대학교 화학과
Seasonal characteristics of dry deposition for particulate PAHs at Seoul
J.Y. Lee, Y.P. Kim* and C.-H. Kang1)
Department of Environmental Science and Engineering, Ewha Womans University
1)Department of Chemistry, Cheju National University
Abstract
Dry deposition for particulate PAHs was measured using a knife-edge dry deposition plate in June and December 2003 at Seoul to characterize their seasonal variation. Ambient particulate PAHs concentrations were also measured concurrently. The measured dry deposition flux of particulate PAHs (∑13-PAHs) was 13.4
±5.46
µg m-2 day-1. The measured flux were higher in winter than in summer. Overall dry deposition velocity of PAHs calculated based on the dry deposition fluxes and ambient concentrations was 0.70±0.50 cm s-1which is similar to that obtained in the previous studies. The overall dry deposition velocity for individual PAH compounds generally decreased with increasing molecular weight of PAHs. Comparing the previous results of particulate PAHs fluxes in Seoul, the range of dry deposition fluxes was from 5.3 to 17.3 mg m-2day-1and the results from Seoul were generally comparable to those other urban areas in the world.Key words : Dry deposition flux, PAHs, Seasonal characteristics, Dry deposition velocity PAAR Vol. 2, No. 3-4 (2006) pp. 141~151
(사)한국입자에어로졸학회
*Corresponding author.
Tel : +82-(0)2-3277-2832, E-mail : [email protected]
ter)을 입히거나 통 (bucket)에 물을 담아 측정하는
방법들이 있다. 전자는 기체와 입자상 오염물질의 건 식침적 과정 중 입자상 오염물질들의 건식침적양만 을 정량화할 수 있고, 후자는 대기에서 수체로 대기 오염물질의 총 건식침적량 (입자와 기체)을 측정할 수 있다.
다환방향족탄화수소(PAHs, polycyclic aromatic hy-
drocarbons)는 탄소와 수소로 구성된 방향족고리가두개 이상 융합한 화합물들을 총칭한다. 이들은 주로 석탄, 석유 등 화석연료의 불완전 연소에 의해 생성 된다. PAHs는 환경내에 총 35종이 존재하고, 이 가 운데 17종의 PAHs (표 2)가 주로 대기 중에 존재한 다. 이 중 BaP, BaA, BbF, Chry, DahA, Ind 등 대기 중에 주로 입자상으로 존재하는 PAHs 성분들은 동 물 실험에서 암을 유발시키는 발암 가능 물질로 분 류되었다 (ATSDR, 1995). 이러한 인체 위해성 문제 때문에 PAHs는 2001년 스톡홀롬 협약에서 중국과 우리나라를 포함 동북아시아 지역 (Region IV)의 관 리대상 잔류성 유해 물질 (PTSs, persistent toxic sub-
stances)로 선정되었다 (UNEP, 2002). PAHs 등 유해물질들의 침적은 인체 위해성에 문제를 일으킬 뿐만 아니라, 생태계 먹이사슬의 일부분으로 오염을 전이 시키는 문제가 있다. 따라서, 우리나라 대표적 도심지 역인 서울에서의 발암 가능성이 큰 입자상 PAHs의 건식침적정도와 특성을 이해하는 것은 인체 위해성 측면뿐만 아니라 수체나 토양 등 다른 환경매체에 미치는 영향을 평가하는데 필수적이다.
본 연구에서는 서울지역에서 건식침적판(dry depo-
sition plate)을 사용하여 대기 먼지와 먼지내 PAHs의 건식침적량을 계절별로 측정하였다. 또한, 본 연구 결과와 같은시기에 측정한 대기 중 입자상 PAHs 농 도를 바탕으로 각 PAH 성분별 대표 건식침적 속도
를 계산하였다. 마지막으로, 기존에 국내외에서 측정 한 PAHs의 건식침적 결과와 비교하여 서울지역의 입자상 PAHs의 건식첨적량의 수준을 평가하였다.
2. 연구 방법
2. 1
측정 장소
대기 중 입자상 PAHs의 건식침적량과 농도를
2003년 6월과 12월에 총 8차례에 걸쳐 동시에 측정하였다. 측정 장소는 서울시 서대문구 대현동에 위치 한 이화여대 아산공학관 옥상에 있는 3 m 높이의 단 위에서 측정을 수행하였다. 아산공학관은 약 15 m 높 이의 5층 건물로서, 서쪽으로는 6차선의 도로, 북쪽 으로 안산, 남쪽으로는 마포구를 바라보고 있다. 주변 환경은 주거 및 상업지역의 혼합 형태를 취한다.
2. 2
측정
2. 2. 1 건식침적량
건식침적판을 이용하여 2003년 6월과 12월에 대 기 분진의 건식침적량을 측정하였다. 측정은 비나 눈 이 내리지 않는 3일 동안 연속적으로 실시하였다. 총
8세트의 시료를 얻었고, 표 1에 각 측정기간동안의 기상자료들을 정리하였다.
본 연구에서 사용한 건식침적판은 기존에 국내외 에서 사용한 건식침적판 (Noll et al., 1988; Bae et al.,
2002; Lee et al., 2006a)을 보다 향상시킨 형태를 취한다. 투명한 아크릴을 이용하여 직경 40.2 cm 크기 의 원판에 12개의 필터 홀더로 구성하였다. 홀더의 직경은 4.7 cm이고, 원형의 침적판이 삽입될 수 있도 록 설계하였다 (그림 1). 건식침적판은 공기역학적으 로 설계되어 부드러운 표면과 날카로운 날(⁄10�)을
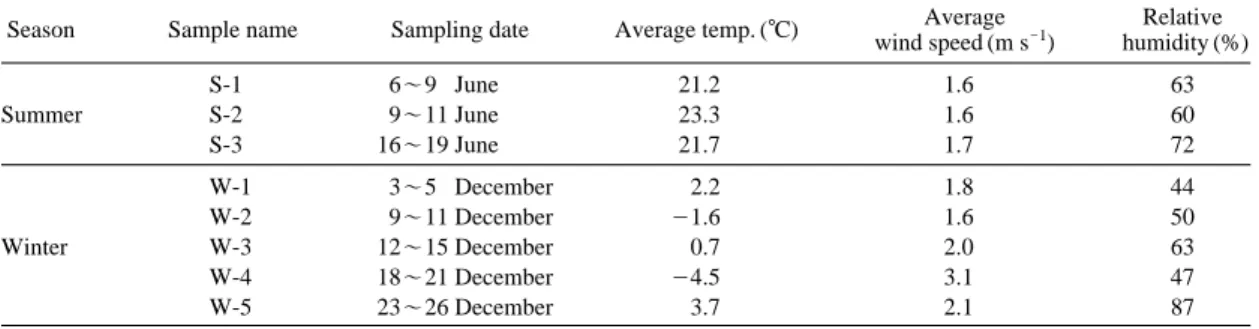
Table 1.Summary of sampling and meterological conditions in 2003.
Season Sample name Sampling date Average temp. (�C) Average Relative
wind speed (m s-1) humidity (%)
S-1 6~9 June 21.2 1.6 63
Summer S-2 9~11 June 23.3 1.6 60
S-3 16~19 June 21.7 1.7 72
W-1 3~5 December 2.2 1.8 44
W-2 9~11 December -1.6 1.6 50
Winter W-3 12~15 December 0.7 2.0 63
W-4 18~21 December -4.5 3.1 47
W-5 23~26 December 3.7 2.1 87
지니고 있으며, 모든 대기 상태 하에서 층류 대기를 형성하도록 되어있다. 기존 연구(Bae et al., 2002; Lee
et al., 2006a)
에서는 입자의 재비산을 막기 위해 건
식침적판 위에 그리스를 얇게 입힌 비닐을 대체표면 으로 사용하였다. 그러나 본 연구에서는 그리스가 기 체상 PAH 성분들을 흡착할 가능성이 있기 때문에 벨크로(Velcro, Velcro USA Inc.) 재질의 시료를 채취 표면으로 사용하였다. 시료 채취 표면은 4.7 cm의 직 경을 가진 원형의 침적판 위에 고정한 형태로 0.7
cm 높이의 필터홀더에 삽입해서 건식침적량을 측정하였다. 건식침적판에 적용한 주요한 가정들은 다음 과 같다. 즉, 부드러운 표면은 대기 상태하의 대체표 면 채취기에 최소한의 침적 속도를 형성한다. 풍동실 험에서 생성되는, 날카로운 날을 가진 부드럽고 평편 한 아크릴판에 형성되는 공기역학적 경계층이 대기 중에 노출된 같은 형태의 침적판에도 생긴다. 그러므 로 침적판은 공기역학적 경계층을 포함하는 침적환 경을 제공하는 것으로 본다. 또한, 만일 입자들이 관 성운동영역에 속해 있으면, 입자들과 대기의 와류운 동 사이에서의 상호작용 때문에 입자들은 대체 표면 에 침적되며, 벨크로로 이루어진 대체표면은 입자의 재비산을 막는다.
2. 2. 2 대기중 농도
대기중 입자상 PAHs 농도는 Ticsh사의 고유량 시 료 채취기 (TE-1000)를 이용하여 측정하였다. 측정의 전반적인 방법은 미국 EPA에서 제시한 TO-13 me-
thod (EPA, 1999)를 준수하였다. 모든시료는 석영섬유여과지 (Whatman, QM-A, 10.16 cm diameter)를 사 용하여 0.225 m
3min-1의 유속으로 24시간 연속 측 정하였다. 보다 자세한 측정방법은 Lee et al. (2006c) 에서 설명하고 있다.
2. 3
분석
본 연구에서는 미국 환경보호청(EPA) Method 610 의 16종의 PAH 성분에 BeP를 합하여 총 17종의
PAH 성분들을 분석하였다(종류와 약자는 표 2에 제시하였다). 분석 방법은 Lee et al. (2006b)의 방식을 활용하였다. 간단하게 정리하면, 시료를 유리관에 넣 고 dichloromethane (DCM) (Fisher, HPLC grade)를 가하여 초음파세척기에서 30분간 초음파추출 후 다 시 vortex mixer에서 30분간 진탕하였다. 이 과정을 2 회 반복하고 막여과지 (Whatman PVDF syringe filter,
0.45µm)로 여과한 후 여액을 풍건식 증발기(Zymark, Model Turbovap 500)를 사용하여 20�C를 유지한 상Impaction disk 40.2cm 30.2cm
4.7cm
23.2cm Top view Impaction disk(0.7cm)
DDP 10�¤
DDP holder 23.2cm
1.5cm
40.2cm
200cm
(a) Side (b) Top
Figure 1.(a) Side and (b) top view of dry deposition plate (DDP indicates dry deposition plate).
태에서 1 mL로 농축하였다. PAHs 분석을 위한 내부 표준물질로는 1 ppm phenanthrene-D
10을 이용하였고,
GC/MSD (GC: HP 5890 series II, MSD: HP 5972 MSD)를 통해 분석하였다. 17종의 PAH 성분들의 정 량분석은 16종 PAHs의 표준용액 (Supelco, EPA 610
Polynuclear Aromatic Hydrocarbon Mix)에 BeP의 표준용액(Aldrich, B1010-2)을 혼합하여 사용하였다.
분석과정의 회수율은 앞에서 PAHs를 추출하고 남 은 시료를 삭슬렛(Soxhelt) 추출기에 DCM을 가하여
24시간동안 전처리하여 시료에 남아있는 PAHs를 제거한 후 사용하였다. 전처리한 시료에 표준용액 일정 량을 주입하여 시료와 동일한 방법으로 추출하였다.
추출한 각 성분들을 GC/MSD로 분석하여 회수율을 측정하였다. 그 결과, PAHs 화합물들의 평균 회수율 은 80~94 %의 범위였고, 회수율은 실제 시료의 최 종 분석 결과에 적용하였다 (PAH 각 성분들에 대한 회수율은 표 2에 정리하였다). 모든시료에 대해 blank 보정이 이루어졌고, 모든 시료의 결과는 검출한계 이 상이었다.
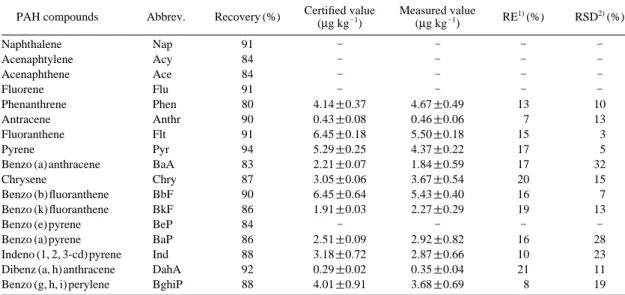
PAHs 분석의 정확성 평가를 위해 미국 표준연구
소(NIST)의 SRM 1649a (urban dust/organics)를 분석 하였다. 이 표준물질 일정량을 취하여 시료의 분석 과정과 동일한 방법으로 6회 반복하여 얻은 결과
NIST의 검증값과 함께 표 2에 수록하였다. 본 연구에서 SRM-1649의 추출 효율은 적합한 범위내에 존 재한다 (NOAA, 1993). 또한, 13종의 PAH 성분들의 상대표준편차 (%RSD)값도 BaA, BaP, Ind를 제외하 고는 3~19%의 범위로, 비교적 재현성 있는 결과를 나타내고 있다.
3. 결과 및 고찰
3. 1
입자상
PAHs의 건식침적량
2003년 6월과 12월에 측정한 총 8세트의 입자상 PAHs의 건식침적량 결과를 표 3에 정리하였다. 본
연구에서는 총 17종의 PAH 성분들을 분석하였다. 하 지만, Nap, Acy, Ace, Flu는 대기중에 평균적으로
90% 이상 기체상으로 존재했기 때문에 입자상 성분들의 특성을 살펴보는 본 결과 분석에서는 제외시켰 다 (Lee et al., 2006c). 입자상 PAHs의 건식침적량은 평균 13.4±5.46
µg m-2day-1로 농도분포와 유사하 게 저분자량의 PAH 성분들 (Phen, Flt, Pyr)의 건식침 적량이 높았다.
그림 2에 2003년 6월과 12월에 각각 측정한 대기 중 입자상 PAH 성분들의 총 (13종 성분들의 합) 건 식침적량을 같은 기간에 측정한 대기 중 입자상
PAHs의 농도와 비교하였다. 대기 중 입자상 PAHsTable 2.Particulate PAHs extraction recovery and analysis results of the NIST SRM-1649 urban dust samples.
PAH compounds Abbrev. Recovery (%) Certified value(µg kg-1) Measured value(µg kg-1) RE1)(%) RSD2)(%)
Naphthalene Nap 91 - - - -
Acenaphtylene Acy 84 - - - -
Acenaphthene Ace 84 - - - -
Fluorene Flu 91 - - - -
Phenanthrene Phen 80 4.14±0.37 4.67±0.49 13 10
Antracene Anthr 90 0.43±0.08 0.46±0.06 7 13
Fluoranthene Flt 91 6.45±0.18 5.50±0.18 15 3
Pyrene Pyr 94 5.29±0.25 4.37±0.22 17 5
Benzo (a) anthracene BaA 83 2.21±0.07 1.84±0.59 17 32
Chrysene Chry 87 3.05±0.06 3.67±0.54 20 15
Benzo (b) fluoranthene BbF 90 6.45±0.64 5.43±0.40 16 7
Benzo (k) fluoranthene BkF 86 1.91±0.03 2.27±0.29 19 13
Benzo (e) pyrene BeP 84 - - - -
Benzo (a) pyrene BaP 86 2.51±0.09 2.92±0.82 16 28
Indeno (1, 2, 3-cd) pyrene Ind 88 3.18±0.72 2.87±0.66 10 23
Dibenz (a, h) anthracene DahA 92 0.29±0.02 0.35±0.04 21 11
Benzo (g, h, i) perylene BghiP 88 4.01±0.91 3.68±0.69 8 19
1)RE: Relative error, 2)RSD: Relative standard deviation
농도와 건식침적량은 모두 여름에 비해 겨울이 높게 나타났다. 여름의 PAHs 농도와 건식침적량이 겨울에 비해 낮았는데, 이는 여름철 잦은 강수현상에 의한 것으로 사료된다. 겨울의 입자상 PAHs 농도가 증가 하는 이유는 기온 하강으로 인한 난방연의 사용 증 가, 즉 배출량의 증가와 기체상 PAH 성분들이 입자 상에 흡착되기 때문으로 알려져 있다 (Lee et al.,
2006b). 그림 3에서 보는바와 같이 입자상 PAHs의건식침적량은 대기 중 농도와는 상관성이 높은 반면 풍속과는 약한 상관성을 보였다. 따라서, 서울에서의 대기 중 입자상 PAHs의 건식침적량을 결정하는 주 요 요인은 대기 중 농도임을 알 수 있었다.
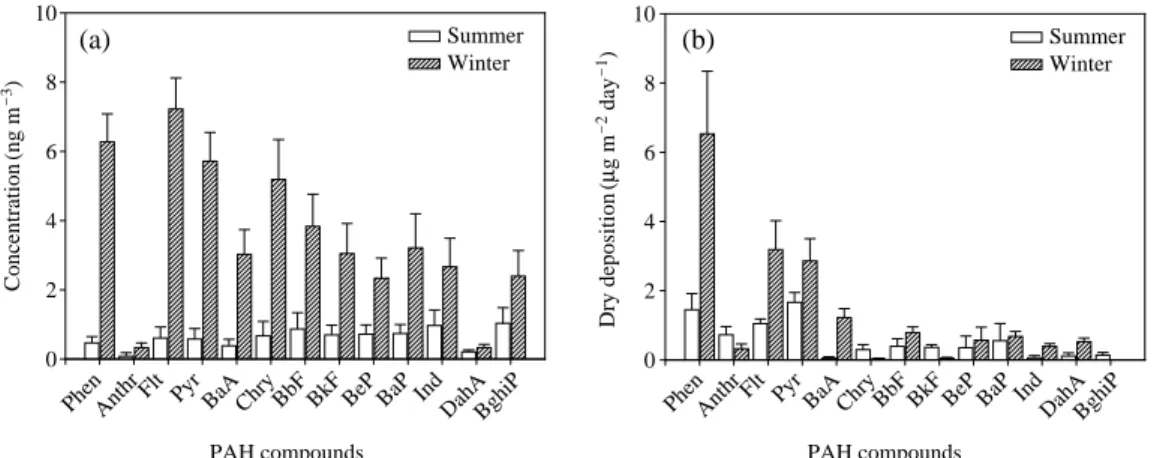
각 PAH 성분들의 대기 중 농도와 건식침적 분포
는 계절별로 다르게 나타났다(그림 4). 대기 중 농도 는 겨울철에는 저분자량의 PAH 성분들의 농도들이 대체로 높았지만, 여름철에는 모든 성분들의 농도 수 준이 비슷하거나, 고분자량 성분들의 농도가 약간 높 은 경향을 보였다. 이는 계절별로 PAHs들의 대기로 의 배출 및 상분배 특성이 달라지는 것을 의미한다.
건식침적량은 겨울과 여름철 모두 저분자량 PAH 성 분들의 침적량이 높았고, 고분자량 PAH 성분들의 침 적량은 매우 낮았다. 이는 건식침적량이 대기 중 농 도와 건식침적속도에 의해 결정되어지는 것을 감안 할때, 저분자량 PAH 성분들의 대기 중 농도가 높았 기 때문이라고 볼 수 있다. 그러나, 저분자량 성분들 과 고분자량 성분들의 농도차에 비해 건식침적량의 차이가 더 큰 것을 설명하기는 어렵다.
S-1 S-2 S-3 W-1 W-2 W-3 W-4 W-5 0
10 20 30 40 50 60 70
0 5 10 15 20 25 Particulate concentration 30
Dry deposition flux
Concentration(ng m-3) Dry deposition flux(µg m-2 day-1)
Figure 2.Particulate PAHs air concentrations and dry deposi- tion fluxes at Seoul (S: indicates the samples measured in June 2003, W: indicates the samples measured in December 2003, The number means sample number).
0 10 20 30 40 50 60 70
0 5 10 15 20 25
0 1 2 3 4
0 5 10 15 20 25
Dry deposition flux(µg m-2 day-1)
Concentration (ng m-3) Wind speed (m s-1)
Dry deposition flux(µg m-2 day-1)
r2 0.00 y 0.24x 13.0 r2 0.92
y 0.26x 4.79
(a) (b)
Figure 3.Relationship between the particle PAHs fluxes and (a) the ambient particulate PAHs concentrations and (b) wind speed.
Table 3.Average dry deposition fluxes of particulate PAHs at Seoul.
PAH compounds Dry deposition flux (µg m-2day-1)
Phen 4.62±2.54
Anthr 0.47±0.29
Flt 2.39±1.06
Pyr 2.41±0.72
BaA 0.78±0.65
Chry 0.13±0.17
BbF 0.64±0.28
BkF 0.17±0.18
BeP 0.49±0.37
BaP 0.63±0.32
Ind 0.27±0.19
DahA 0.37±0.24
BghiP 0.05±0.09
∑PAHs 13.4±5.46
3. 2 PAH
성분들의 건식침적속도
일반적으로 건식침적량은 건식침적속도와 질량농 도의 곱으로 나타낸다.
F=
=V
d×C
(1)여기서 F는 건식침적량(M L
-2T-1), Vd는 건식침적 속도 (LT
-1)이며, C는 대기 중 농도 (M L-3)이다. 본연구에서는 식 (1)에 측정한 입자상 PAHs의 건식침 적량과 대기 중 농도를 이용하여 PAH 성분들의 건 식침적 속도를 계산하였다. 이러한 계산에 의하면, 총
PAHs의 건식침적속도는 0.70±0.50 cm s-1였다. 이는 동일한 방법으로 계산한 기존 연구결과 (Shue et al.,
1996; Lee et al., 2006a) 뿐만 아니라, 물질수지모델로예측한 결과(McVeety and Hites, 1988)와도 비슷하였 다(표 4). 따라서, 입자상 PAHs의 대표 건식침적속도
는 10
-2~10
-1cm s-1범위에 있는 것으로 추정할 수 있다.
그림 5에서는 각 PAH 성분들의 계절별 건식침적 속도를 보였다. 대체로 여름철의 PAH 성분들의 건식 침적속도가 겨울철보다 크게 나타났다. 또한, 저분자 량 PAH 성분들 (Phen, Flt, Pyr)들의 건식침적속도가 고분자량 성분들 (Ind, BghiP)보다 약 10배 이상 컸 다. 이는 PAH 성분들간의 대기 중 입경 분포의 차이 와 관련이 있다. 기존 연구결과에 의하면, 입자상
PAHs의 건식침적속도는 입자의 직경의 제곱에 비례하여 증가한다 (Lee et al., 2006a). 저분자량 성분들은
PAH compounds PAH compounds
PhenAnthrFlt Pyr BaA Chry BbF BkF BeP BaP IndDahABghiP 0
2 4 6 8 10
Summer Winter
PhenAnthrFlt Pyr BaA Chry BbF BkF BeP BaP IndDahABghiP 0
2 4 6 8 10
Summer Winter
Concentration(ng m-3) Dry deposition(µg m-2 day-1) (a) (b)
Figure 4.Average particulate (a) concentrations and (b) dry deposition fluxes of individual PAH compounds at Seoul.
Table 4.Comparison of the estimated dry deposition veloc- ities for particulate PAHs.
Vp (cm s-1) Calculated method Reference
0.70±0.50 This study
By the measurement
0.35±0.48 data of dry deposition Lee et al. (2006a) and TSP concentration
0.67~1.8 Sheu et al. (1996)
0.20* By the model of Slinn Hoff et al. (1996) 0.99 By the mass balance Mcveety and
model Kites (1988)
*the dry deposition velocity for SVOC
PAH compounds
PhenAnthrFlt Pyr BaA Chry BbF BkF BeP BaP IndDahABghiPTotal 0
2 4 6 8 10
Summer Winter
Dry deposition velocity(cm s-1)
Figure 5.Overall dry deposition velocities of individual PAH compounds in summer and winter.
주로 입자 크기가 1 mm보다 큰 입자에 존재하는데 비해 고분자량 성분들은 1
µm이하의 입자에 분포하 는 것으로 보고하고 있다(Offenberg and Baker, 1999;
Lee et al., 2006a).
따라서, 고분자량 PAH 성분들과 저분자량 성분들의 건식침적속도 차이는 이들의 대 기 중 입경분포 차이에 비롯된 것으로 여겨진다.
3. 3
입자상
PAHs의 건식침적량의 국내외 결과 비교
본 연구에서는 일차적으로 서울지역에서 측정한 입자상 PAHs의 농도와 건식침적량의 계절별 특성을 살펴보고자 하였다. 그리고 이에 덧붙여 국내외 측정 된 PAHs의 건식침적에 대한 연구결과를 요약, 정리 하여 서울에서의 PAHs의 건식침적에 대한 특성을 이해하고자 했다. 기본적으로 입자상 PAHs 건식침적 량만을 측정한 결과를 정리하였고, 입자상과 기체상 의 건식침적량을 동시에 측정한 결과는 별도로 표시 하였다.
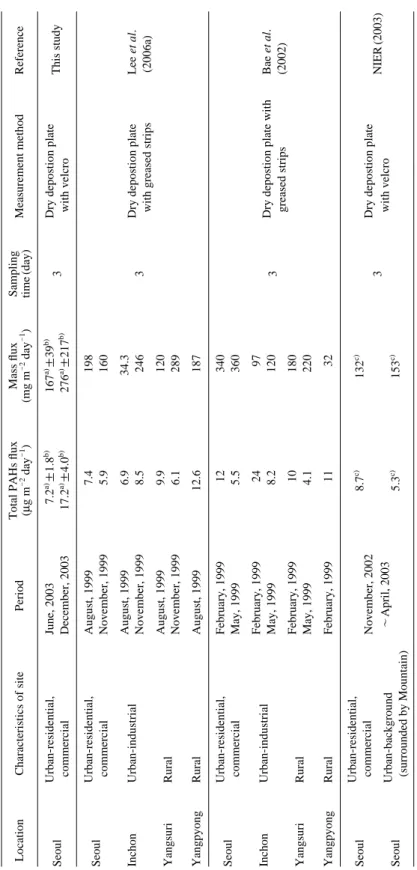
현재까지 국내에서 보고한 PAHs의 건식침적량 측 정결과는 (표 5) 본 연구결과를 포함하여, 총 5차례 존재한다. 이중에서 4차례는 건칙침적판으로 입자상
PAHs의 건식침적량을 측정하였다. 나머지 한번은 물이 공급되는 통을 이용하여 입자상 및 기체상 PAHs 의 건식침적량을 합하여 측정하였다. 측정지역은 서 울, 인천과 같은 도심 및 산업지역과 서울 근교에 위 치한 양수리, 양평과 같은 시골지역에서 이루어졌다.
4차례에 걸쳐 측정한 서울지역의 건식침적량은 계절
별로 다소 차이를 보인다. 그렇지만, 대개 5.3~17.2
µg m-2day-1로 전반적으로 비슷한 수준이었다. 산업 지역인 인천지역의 건식침적량은 서울에 비해 약간 높거나 비슷한 수준이다. 양수리와 양평에서의 건식 침적량은 서울의 결과와 비교시 약간 낮거나 비슷한 수준이었다. 기존 연구결과 (Bae et al., 2002: Lee et
al., 2006a)에서는 양수리와 양평에서의 건식침적량이 낮지 않은 이유를 이 지역에서의 PAHs의 대기 중 농도들도 높았기 때문으로 설명하고 있다. 또한, 서울에서 배출된 PAHs가 장거리 이동하여 높은 대 기 중 농도를 보였을 뿐만 아니라 건식침적량에도 영향을 미쳤다고 설명한다.
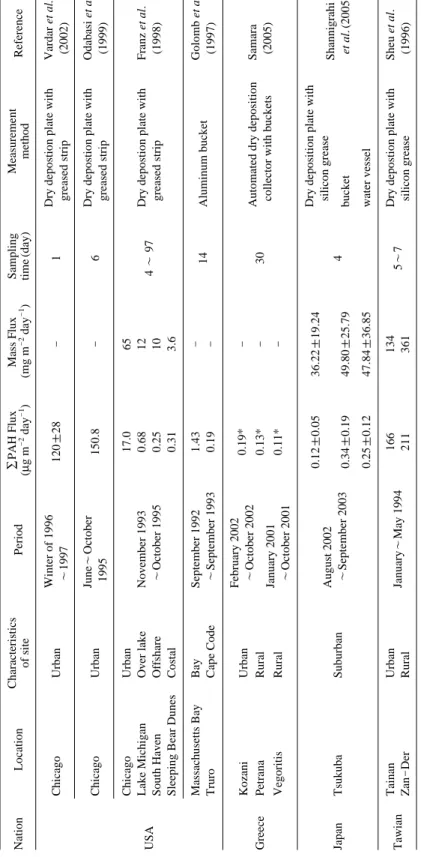
외국에서의 PAHs 건식침적량 측정에 대한 연구는
1980년대부터 미국을 중심으로 이루졌다. 최근에 들어서 우리나라와 일본 등 동아시아 지역과 유럽지역
에서 보고되고 있다. 미국의 도심지역인 시카고 지역 의 측정결과와 서울에서 측정한 본 연구결과를 비교 해보면 (표 6), 서울의 PAHs의 건식침적량은 Vardar
et al. (2002)과 Odabasi et al. (1999)의 결과보다는 1/10 정도 낮은 수준이지만, Franz et al. (1998)의 결과와는 비슷한 수준이었다. 그밖의 Michigan 호 주변과
Massachusetts 만에서 측정한 결과는 우리나라의 양수리와 양평에 비해 약 1/10 정도 낮은 수준이었다.
그리스의 도심지역에서의 측정결과 입자와 기체상
PAHs의 건식침적량임에도 불구하고 서울과 비교시약 1/100 정도 낮았고, 이는 앞의 울산지역의 결과에 서 언급한 바와 같이 30일 동안의 장시간의 측정시 간에 의한 영향으로 과소측정된 것으로 여겨진다. 그 리스의 시골지역들도 우리나라의 양평과 양수리에 비해 약 1/10에서 1/100까지 낮은 값을 보였다. 일본 의 부도심지역에서는 세가지 종류의 측정기기 (건식 침적판, 통, 물통 (water vassel))를 이용하여 건식침적 량을 측정한 결과, 모두 비슷한 값을 보였고, 서울지 역과 비교시 약 1/100 정도 낮았다. 이는 일본의 부 도심지역에서의 대기 중 입자상 PAHs 농도 수준은 알 수 없지만, 일본 도심지역의 대기 중 입자상
PAHs 농도 수준이 서울지역에 비해 약 1/10 정도 낮고(Lee et al., 2006c), 입자상 PAHs의 건식침적량을 측정한 일본 부도심지역의 대기 먼지의 건식침적량 이 서울에 비해 약 1/10 정도 낮다. 이를 감안할 때, 이 지역의 대기 중 입자상 PAHs 농도 수준이 서울 에 비해 매우 낮기 때문으로 여겨진다. 타이완의 도 심지역은 서울보다 높은 수준의 건식침적량을 보였 고, 이는 이지역에서의 높은 대기 중 PAHs 농도와 관련이 있는 것으로 보인다 (Lee et al., 2006c). 타이 완의 시골지역은 도심지역보다 10배 이상 큰 값의 입자상 PAHs의 건식침적량을 보였고, 이는 우리나라 서울 주변 시골지역보다 약 100배 이상 큰 값이다.
4. 요약 및 결론
본 연구에서는 유해물질로 알려진 PAHs의 서울
대기에서의 계절별 건식침적 특성을 파악하기 위해
2003년 6월과 12월에 입자상 PAHs의 농도와 건식침적량을 동시에 측정하였다. 서울 대기로부터 유입
되는 입자상 PAHs의 건식침적량은 평균 13.4±5.46
Table 5.Comparison of the measurement results for particulate PAHs dry deposition flux in Korea. LocationCharacteristics of sitePeriodTotal PAHs fluxMass fluxSampling Measurement methodReference (µg m-2day-1)(mg m-2day-1)time(day) SeoulUrban-residential, June, 20037.2a)±1.8b)167a)±39b) 3Dry depostion plate This study commercialDecember, 200317.2a)±4.0b)276a)±217b)with velcro SeoulUrban-residential, August, 19997.4198 commercialNovember, 19995.9160 InchonUrban-industrialAugust, 19996.934.3 Dry depostion plate Lee et al. November, 19998.52463 with greased strips(2006a) YangsuriRuralAugust, 19999.9120 November, 19996.1289 YangpyongRuralAugust, 199912.6187 SeoulUrban-residential, February, 199912340 commercialMay, 19995.5360 InchonUrban-industrialFebruary, 19992497 3Dry depostion plate withBae et al.May, 19998.2120 YangsuriRuralFebruary, 199910180greased strips(2002) May, 19994.1220 YangpyongRuralFebruary, 19991132 SeoulUrban-residential, 8.7c)132c) commercialNovember, 2002 3Dry depostion plate NIER(2003) SeoulUrban-background~April, 2003 5.3c)153c)with velcro (surrounded by Mountain) a)arithmetical mean, b)standard deviation, c)geometric mean
Table 6.Comparison of the measurement results for particulate PAHs dry deposition flux in the world. NationLocationCharacteristics Period∑PAH FluxMass FluxSamplingMeasurement Reference of site(µg m-2day-1)(mg m-2day-1)time(day)method ChicagoUrbanWinter of 1996 120±28 -1Dry depostion plate withVardar et al. ~1997greased strip(2002) ChicagoUrbanJune~October 150.8-6Dry depostion plate with Odabasi et al. 1995greased strip(1999) ChicagoUrban17.065 USALake MichiganOver lakeNovember 19930.6812 4 ~97Dry depostion plate withFranz et al. South HavenOffshare~October 19950.2510greased strip(1998) Sleeping Bear DunesCostal0.313.6 Massachusetts BayBaySeptember 19921.43- 14Aluminum bucketGolomb et al. TruroCape Code~September 19930.19-(1997) KozaniUrbanFebruary 2002 0.19*- GreecePetranaRural~October 2002 0.13*-30Automated dry depositionSamara VegoritisRuralJanuary 2001 0.11*-collector with buckets(2005) ~October 2001 0.12±0.0536.22±19.24Dry deposition plate with August 2002silicon grease Shannigrahi JapanTsukubaSuburban~September 20030.34±0.1949.80±25.794 bucketet al.(2005) 0.25±0.1247.84±36.85water vessel TawianTainanUrban January~May 1994166134 5~7Dry depostion plate with Sheu et al. Zan-DerRural211361silicon grease(1996) *Dry deposition of total(particulate++gaseous) PAHs
µg m-2day-1
로, 여름에 비해 겨울이 높았다. 측정한 입자상 PAHs의 건식침적량과 대기 중 농도를 이용 하여 PAH 성분들의 건식침적 속도를 계산한 결과,
PAHs의 대표 건식침적속도는 0.70±0.50 cm s-1였 다. 각 PAH 성분들의 건식침적속도는 저분자량 PAH 성분들의 건식침적속도가 고분자량 성분들보다 컸는 데, 이는 PAH 성분들간의 대기 중 입경분포의 차이 에 따른 영향으로 판단하였다. PAHs 건식첨적에 관 한 본 연구결과를 기존 국내외 연구 결과와 비교한 결과, 서울지역의 건식침적량은 계절별로 다소 차이 를 보이지만, 5.3~17.2
µg m-2day-1로 비슷한 범위 을 보였다. 따라서, 서울지역의 대기로부터 유입되는 입자상 PAHs의 건식침적량은 10
µg m-2day-1수준 으로 판단되어지고, 이는 향후 서울의 PAHs 건식침 적량을 예측하는 기초자료로 제공될 수 있을 것이다.
감사의 글
이 논문은 2006년도 정부(과학기술부)의 재원으로 한국과학재단의 국가지정연구실사업(No. M1060000-
0221-06J0000-22110)과 서울지역환경기술개발센터연구개발사업의 일환으로 수행되었으며, 지원에 감사 드립니다.
참 고 문 헌
ATSDR, Agency for Toxic Substances and Disease Registry (1995). Toxicological Profile for Polycyclic Aro- matic Hydrocarbons. Atlanta, GA, USA.
Bae, S.Y., Yi, S.M., and Kim, Y.P. (2002). Temporal and spatial variations of the particle size distribution of PAHs and their dry deposition fluxes in Korea, Atmospheric Environment, 36, 5491-5500.
EPA, Environmental Protection Agency (1999), Determina- tion of Polycyclic Aromatic Hydrocarbons (PAHs) in Ambient Air Using Gas Chromatography/mass Spectrometry (GC/MS), EPA publication No. EPA/
625/R-96/010b, Cincinnati, OH.
Franz, T.D., Eisenreich, S.J., and Holsen, T.M. (1998). Dry deposition of particulate polychlorinated biphenyls and polycyclic aromatic hydrocarbons to lake Michi- gan, Environmental Science & Technology, 32,
3681-3688.
Golomb, D., Barry, E., Fisher, G., Varanusupakul, P., Koleda, M., and Rooney, T. (1997). Atmospheric deposition of polycyclic aromatic hydrocarbons near New England coastal waters, Atmospheric Environment, 35, 6245-6258.
Hoff, R.M., Strachan, W.M.J., Sweet, C.W., Chan, C.H., Shackleton, M., Bidleman, T.F., Brice, K.A., Bur- niston, D.A., Cussion, S., Gatz, D.F., Harlin, K., and Schroeder W.H. (1996). Atmospheric deposi- tion of toxic chemicals to the great lakes: A review of data through 1994, Atmospheric Environment, 30, 3505-3527.
Hoseln, T.M., Noll, K.E., Fang, G.C., Lee, W.J., Lin, J.M., and Keeler, G.J. (1993). Dry deposition and particle size distributions measured during the lake Mi- chigan urban air toxic study, Environmental Science
& Technology, 27, 1327-1333.
Lee, B.K., and Lee, C.-B. (2004). Development of an im- proved dry and wet deposition collector and the atmospheric deposition of PAHs onto Ulsan Bay, Korea, Atmospheric Environment, 38, 863-871.
Lee, J.Y., Kim, Y.P., and Yi, S.M. (2006a). Size distributions and dry deposition fluxes of particulate polycyclic aromatic hydrocarbons (PAHs) at several sites in Korea in 1999, Environmental Engineering and Science, 23, 393-404.
Lee, J.Y., Kim, Y.P., and Kang, C.-H. (2006b). Temporal trend and long range transport of particulate PAHs at Gosan in Northeast Asia between 2001 and 2004, in press at Journal of Geophysical Research.
Lee, J.Y., Kim, Y.P., and Kang, C.-H. (2006c). Comparison of the temporal variations for particulate PAHs between urban and remote areas in Korea. in pre- paration.
McVeety, B.D., and Hites R.A. (1988). Atmospheric deposi- tion of polycyclic aromatic hydrocarbons to water surfaces: A mass balance approach, Atmospheric Environment, 22, 511-536.
NIER, National Institute of Envrionmental Research (2003).
The study for the behavior of endocrine disruptors (EDs) in the environment (II). Incheon, Korea.
NOAA, National Oceanic and Atmospheric Administration (1993). Sampling and Analytical Methods of the National Status and Trends Program-National Benthic Surveillance and Mussel Watch Projects, 1984-1992. NOAA Technical Memorandum NOS ORCA, 71, Vol. 41-42.
Noll, K.E., Fang, K.Y., and Watkins, L.A. (1988). Charac- terization of the deposition of particles from the atmosphere to a flat plate, Atmospheric Environ- ment, 22, 1461-1468.
Odabasi, M., Bardar, N., Sofuoglu, A., Tasdemir, Y., and Holsen, T.M. (1999). Polycyclic aromatic hydro- carbons (PAHs) in Chicago air, The Science of the Total Environment, 227, 57-67.
Offenberg, J.H., and Baker, J.E. (1999). Aerosol size dis- tributions of polycyclic aromatic hydrocarbons in urban and over-water atmospheres, Environmental Science & Technology, 33, 3324-3331.
Terzi, E., and Samara, C. (2005). Dry deposition of polycyclic aromatic hydrocarbons in urban and rural sites of Western Greece, Atmospheric Environment, 39, 6261-6270.
Shannigrahi, A.S., Fukushima, T., and Ozaki, N. (2005).
Comparison of different methods for measuring dry
deposition fluxes of particulate matter and poly- cyclic aromatic hydrocarbons (PAHs) in the ambi- ent air, Atmospheric Environment, 39, 653-662.
Shue, H.L., Lee, W-J, Su, C-C., Chao, H-R., and Fan, Y-C.
(1996). Dry deposition of polycyclic aromatic hydro- carbons in ambient air, Journal of Environmental Engineering, 122, 1101-1109.
UNEP, United Nations Environment Programme (2002). Re- gionally based assessment of persistent toxic sub- stances, Central and North East Asia regionally report, Global Environment Facility, URR (http://
www.chem.unep.ch/pts/regreports/C&NE%Asia%
20full%20report.pdf).
Vardar, N., Odabasi, M., and Holsen, T.M. (2002). Particulate dry deposition and overall deposition velocities of polycyclic aromatic hydrocarbons, Journal of En- vironmental Engineering, 128, 269-274.