저작자표시-비영리-변경금지 2.0 대한민국 이용자는 아래의 조건을 따르는 경우에 한하여 자유롭게 l 이 저작물을 복제, 배포, 전송, 전시, 공연 및 방송할 수 있습니다. 다음과 같은 조건을 따라야 합니다: l 귀하는, 이 저작물의 재이용이나 배포의 경우, 이 저작물에 적용된 이용허락조건 을 명확하게 나타내어야 합니다. l 저작권자로부터 별도의 허가를 받으면 이러한 조건들은 적용되지 않습니다. 저작권법에 따른 이용자의 권리는 위의 내용에 의하여 영향을 받지 않습니다. 이것은 이용허락규약(Legal Code)을 이해하기 쉽게 요약한 것입니다. Disclaimer 저작자표시. 귀하는 원저작자를 표시하여야 합니다. 비영리. 귀하는 이 저작물을 영리 목적으로 이용할 수 없습니다. 변경금지. 귀하는 이 저작물을 개작, 변형 또는 가공할 수 없습니다.
농학박사 학위논문
Risk assessment of polycyclic aromatic hydrocarbons
in edible oils and teas and their reduction during
grilling meats
식용유지 및 다류 중 다환방향족탄화수소의
위해성 평가 및 숯불구이 중 저감화
2020
년 2 월
서울대학교 대학원
농생명공학부
(식품생명공학전공)
이 준 구
Abstract
Risk assessment of polycyclic aromatic hydrocarbons
in edible oils and teas and their reduction during
grilling meats
Lee, Joon-Goo Department of Agricultural Biotechnology The Graduate School Seoul National University
Polycyclic aromatic hydrocarbons (PAHs) are carcinogenic and genotoxic chemicals naturally derived from food during heat processing. Edible oil is one of the most frequently contaminated foods. Many researches were recently conducted to determine the contents of PAHs and assess their risks, but there have been no studies characterising risks of PAHs by calculating Margin of Exposure (MOE) of total PAHs instead of toxic equivalency factors (TEFs) concept in Korea. And tea is one of the most frequently consumed drinks due to its favourite taste and the health benefit. Tea is produced by several processes and drying is important step to develop
the flavour and destroys the enzymes in tea. However, during drying tea, polycyclic aromatic hydrocarbons, some of which are carcinogen and genotoxin, are naturally produced. To analyze the 4 PAHs simultaneously, gas chromatography combined by mass spectrometry was optimized. 303 edible oils and 468 tea products were investigated and contaminated by 4 PAHs up to 12.91 ng g-1 and up to 4.63 ng g-1, respectively. The risks of PAHs by drinking tea and consuming edible oils were characterized by determining contents of 4 PAHs in tea and edible oils.
The MOEs were estimated by PAHs contents, daily consumption, and were over 10,000. The risks of PAHs of tea and edible oils in Korea were of low concern. Furthermore, the MOEs of the estimated equivalent BaP calculated by TEFs of other 3 PAHs were higher than those of mixed PAHs, which would be overestimated. The Margin of Exposures (MOEs) calculated by the concentration of BaA, CHR, BbF and BaP and consumption amount of tea and edible oils were higher than 10,000, and the risk of PAHs in tea and edible oils were low concern to public health.
Furthermore, polycyclic aromatic hydrocarbons (PAHs) are formed when muscle meat is cooked using high-temperature methods, such as grilling directly over an open flame. I investigated the effects of grilling procedures on the level of 4 PAHs; benzo[a]anthracene (B[a]A), chrysene (Chr),
benzo[b]fluoranthene (B[b]F), and benzo[a]pyrene (B[a]P). PAHs were extracted and determined by gas chromatography with mass detection (GC-MS). With regard to barbecuing successive meat samples with the same batch of burning charcoal, it was observed that stable combustion contribute to reduction of PAHs. Significant reductions in the sum of the four PAHs were observed through treatments which removed meat drippings and smoke with alternative grilling apparatus. The sums of 4 PAHs were reduced 48-89 % without dripping and 41-74 % without the smoke in grilled pork and beef meats comparing to conventional grilling. We investigated the components of meats drippings. The major constituent of meat dripping was fat. The most important factor contributing to the production of PAHs in grilling was smoke resulting from incomplete combustion of fat dripped onto the fire.
Keywords: food safety, food processing, processing contaminants, polycyclic aromatic hydrocarbons (PAHs), risk assessment, analytical method development, edible oils, teas, grilled meat, reduction of PAHs
Contents
Abstract...I
Contents...IV
List of Figures...IX
List of Tables...XI
Chapter I. General Introduction...1
Chapter II. Risk Characterization of Polycyclic Aromatic
Hydrocarbons in Edible Oils...10
II-1. Introduction...11
II-2. Materials and Methods...15
Chemicals and materials...15
Pretreatment of Sample...16
Determination of PAHs using GC-MS...17
Exposure estimation and risk characterization…...19
II-3. Results and Discussion...23
Quality control...23
Occurrence of 4 PAHs in edible oils………...25
Consumption of edible oils………...31
Exposure estimation..………...……...33
Risk characterization and Uncertainty...37
Statistical analysis...39
II-4. Conclusion...40
Chapter III. Risk Characterization of Polycyclic Aromatic
Hydrocarbons in Teas...41
III-1. Introduction...42
III-2. Materials and Methods...50
Chemicals and materials...50
Sampling...51
Sample preparation Leached tea and solid tea (powdered leached tea)...51
Solid tea (processed) and liquid tea (preserved by sugar)...53
Determination of PAHs using GC-MS...55
Quality control...58
Exposure estimation and risk characterization…...59
Statistical analysis...60
III-3. Results and Discussions...61
Quality control...61
Occurrence of 4 PAHs in teas………...65
Consumption of teas………...70
Exposure estimation………...……...71
Risk characterization and Uncertainty...80
Statistical analysis...80
III-4. Conclusion...82
Chapter IV. Reduction of Occurrence of Polycyclic Aromatic
Hydrocarbons in Grilled Meats………....83
IV-1. Introduction...84
IV-2. Materials and Methods...87
Chemicals and materials...87
Charcoal grilling method...89
Conditions of grilling temperature and time...91
Conditions of removing meat drippings...93
Conditions of removing smoke from flame of charcoals....95
Determination of PAHs using GC-MS...97
Quality contro...99
Analysis of meat droppings...100
Statistical analysis...100
IV-3. Results and Discussion...101
Quality control...101
The levels of the 4 PAHs according to different conditions of grilling temperature and time...104
Occurrence of PAHs in different fat contents...106
Analysis of meat dripping ...108
Reduct io n o f occurrence o f PAHs by remo ving meat dripping...110
Reduction of occurrence of PAHs by removing smoke from flame of charcolas...112
References...119
List of Figures
Fig. I I-1. Re lat ive co nt ribut io n o f 4 PAH s in 5 ed ible o il
categories...28
Fig. II -2. Correlations between 4 PAHs and BaP in 5 edible oil categories;
(a)Sesame oil, (b)perilla oil, (c)olive oil, (d)red pepper seasoning oil, and (e)red pepper seeds oil...30
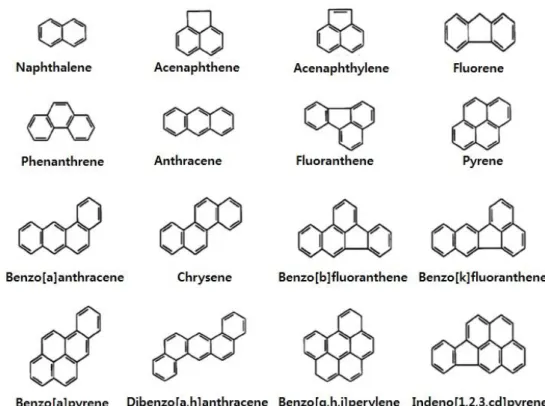
Fig. III-1. Structures of 16 priority PAHs classified by the US
EPA...45
Fig. III-2. The Chromatograms of GC-MS of 4 PAHs and deuterated 2 PAHs
with selected ion monitoring (SIM) mode at m/z of 228, 252, 240 and 264 (A) leached tea, (B) solid tea, (C) liquid tea...62
Fig. IV-1. The designs of outdoor barbecue griller (① meat, ② grill, ③
thermometer, ④ charcoal ...90
Fig. IV-2. The change of grilling temperature according to the temp...92 Fig. IV-3. The designs of outdoor barbecue griller for removing the meat
drippings (① meat, ② grill, ③ thermometer, ④ charcoal, ⑤ aluminum tube ...94
Fig. IV-4. The designs of outdoor barbecue griller for removing the meat
drippings (① meat, ② grill, ③ thermometer, ④ charcoal, ⑤ aluminum d u c t , ⑥ v a c u u m p u m p . . . 9 6
Fig. IV-5. The Chromatograms of GC-MS of 4 PAHs and deuterated 2 PAHs
with selected ion monitoring (SIM) mode at m/z of 228 (A) , m/z of 252 (B), m/z 240 (C) and m/z 264 (D)...103
Fig. IV-6. The amount of fat, moisture and others in dripping of meat during
grilling (n=3) ...109
Fig. IV-7. The reduction of occurrence of PAHs in grilled meat with different
grilling conditions: (A) control, (B) removing fat drippings. The bars are the s t a nd a r d d e v ia t io n s ( n = 6 ) . . . .. . .. . . .. . . . .. . . . .. . . 111
Fig. IV-8. The reduction of occurrence of PAHs in grilled meat with different
grilling conditions: (A) control, (B) removing smoke. The bars are the s t a nd a r d d e v ia t io n s ( n= 6 ) . . . .. . . . .. . .. . . .. . . .. . . . .. . . . .. . . 11 3
List of Tables
Table I-1. Polycyclic aromatic hydrocarbons selected as the priority targets
to manage the safety...3
Table II-1. Performance parameters of the method in optimum
condition...24
Table II-2. PAHs concentrations in edible oils...26 Table II-3. Consumption amounts of edible oils and estimated
concentrations of each 4 PAH according to the proportion of not-detected samples. ...32
Table II-4. Dietary exposures to each PAH and total 4 PAHs by consuming
edible oils...35
Table II-5. MOEs of total 4 PAHs by sum of each PAH and TEQBaPas BaP
concentratio n est imated by TEFs...38
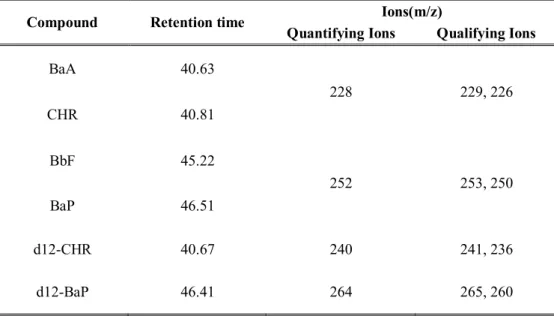
Table III-1. Retention time and m/z value of quantitative and qualitative
ions of 4 PAHs and 2 deuterated PAHs...57
Table III-2. The values of validation parameters (linearity and detection
limits)...63
repeatability)...64
Table III-4. Levels of 4 PAHs in different teas determined by several studies
in some countries...66
Table III-5. The amount of teas consumed by whole population and drinker
only...72
Table III-6. Estimated exposure to 4 PAHs by drinking teas for whole
population...73
Table III-7. Estimated exposure to 4 PAHs by drinking teas for drinker
only...75
Table III-8. Estimated exposure to 4 PAHs by drinkg teas for whole
population and drinker only...78
Table III-9. Margins of Exposures (MOE)of total 4 PAHs...79
Table IV-1. Retention time and m/z value of quantitative and qualitative ions
of 4 PAHs and 2 deuterated PAHs...98
Table IV-2. The values of validation parameters (linearity, detection limits,
and accuracy)...102
Table IV-3. The concentrations of the total and each of 4 PAHs in different
Chapter I.
Polycyclic aromatic hydrocarbons (PAHs) are a group of chemical substances comprised of two or more benzene rings (IARC, 2010). They are occurred from the incomplete combustion of fossil fuels, organism and geochemical process. Some PAHs have been confirmed to have carcinogenic and genotoxic property by binding to deoxyribonucleic acid (DNA) (IARC, 2010). Sixteen PAHs are recently selected as priority targets to manage by Environmental Protection Agency (EPA) on the basis of their occurrence rate and carcinogenic risk (Zelinkova et al., 2015) (Table I-1). The European Union chose benzo(a)pyrene (BaP) as a mark for total PAHs in foods and set maximum levels in different food groups. However, scientists in European Food Safety Authority (EFSA) recently figured out that BaP is improper as an indicator for total PAHs, and 4 PAHs such as Benz(a)anthracene (BaA), Chrysene (CHR), Benzo(b)fluoranthene (BbF), and Benzo(a)pyrene (BaP) would be more suitable as indicators (EFSA, 2008). The European Union has added new maximum levels for sum of 4 PAHs in different food groups (EC, 2011).
The contamination of PAHs in foods is originated from environmental pollutants, manufacturing foods and cooking processes, and PAHs sometimes show up from contaminated packaging material in the low amounts (Lee et al., 2016a, Simko et al., 1995, Speer et al., 1990).
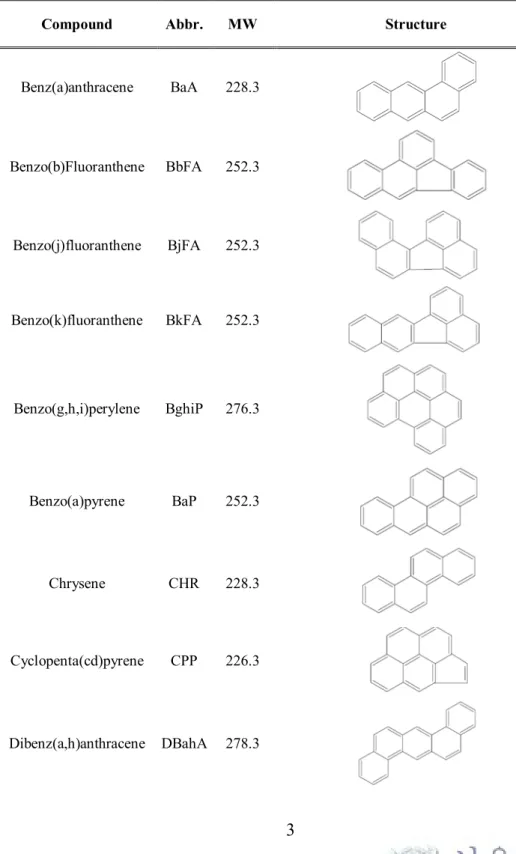
Table I-1. 16 Polycyclic aromatic hydrocarbons selected as the priority targets to manage the safety
Compound Abbr. MW Structure
Benz(a)anthracene BaA 228.3 Benzo(b)Fluoranthene BbFA 252.3 Benzo(j)fluoranthene BjFA 252.3 Benzo(k)fluoranthene BkFA 252.3 Benzo(g,h,i)perylene BghiP 276.3 Benzo(a)pyrene BaP 252.3 Chrysene CHR 228.3 Cyclopenta(cd)pyrene CPP 226.3 Dibenz(a,h)anthracene DBahA 278.3
Dibenzo(a,e)pyrene DBaeP 302.3 Debenzo(a,h)pyrene DBahP 302.3 Debenzo(a,i)pyrene DBaiP 302.3 Dibenzo(a,l)pyrene DBalP 302.3 Indeno(1,2,3-cd)pyrene IP 276.3 5-methylchrysene MCH 242.3 Benzo(c)fluorene BcFL 216.3
Some studies have been performed to determine PAHs in food samples, and determination of contaminations of PAHs in various food stuffs has been published (EFSA, 2008, Lee et al., 2018). Fats and oils are easily contaminated to PAHs because of their powerful lipophilic characteristics (Balenovic et al., 1995). There are some reasons of PAHs contamination in seed oils. Drying seeds by direct heating with fire or indirect heating with hot air can be a key cause of PAHs contamination in some seed oils. Another possible factor of contamination of PAHs in vegetable oils would be originated from contaminated environment such as soil, water, air or packaging materials (Moret et al., 2000). The direct consumption or production of food with fats and oils as ingredients is one of the most important concerns that PAHs in oils have to be managed (Moret et al., 2005, Teixeira et al., 2007). Furthermore, the absorption of PAHs through intestines is another important reason for managing and controlling the PAHs in fats and oils (Starvic et al., 1994). When crude edible oils are purified and dewaxed through refining processes, the amounts of PAHs can be drastically decreased according to the refining conditions (Moret et al., 2000). Therefore, the management of pressure-extracting oils without refinement is more significant rather than controlling refined oils.
Teas are also easily contaminated by PAHs. Teas are dried to decrease the amount of moisture and destroy the enzymes to develop the tea flavor and taste.
How to dry and how many times dry the tea are regarded to the most important steps. (Özcan et al., 2005, Venskutonis, 1997, Vieira et al., 2010). Tea is traditionally dried by frying tea several times, but recently using smoke, steam, sun-light or flames are easily used for rapidly drying tea. However, these drying processes develop not only quality of tea but also some hazard chemicals in tea. Polycyclic aromatic hydrocarbons (PAHs) are formed during drying tea with high temperature (Adisa et al., 2015, Pincemaille et al., 2014, Vieira et al., 2010). Especially, green tea and black tea imported from China were highly contaminated by PAHs and consumers concerned about drinking teas. Therefore, it is necessary to assess the risks of PAHs in teas.
Some research have assessed the risk of consuming edible oils and drinking teas according to exposure to PAHs to monitor the safety of edible oils and tea, and most of them have used the Toxic Equivalency Quotient (TEQ) to evaluate the risk of exposure to 4 PAHs, since this approach was accepted by the US EPA (Nisbet et al., 1992). TEQ approach is the concept that changes the levels of other PAHs to BAP contents with toxic relations between other PAHs and BaP. The levels of BaP which are converted from those of other PAHs are called BaP equivalent contents (TEQBaP) and TEQBaP were calculated by multiplying toxic
equivalency factors (TEFs) and each PAHs contents (Jiang et al., 2015, Zhao et al., 2014, Alomirah et al., 2010, Martí-Cid et al., 2008). The exposure to PAHs
was finally shown by the exposure to BaP.
However, Scientists recently figured out that the TEQ concept is not suitable for PAHs because each PAHs has different toxicological mechanism. Food Safety Authority (EFSA) studied toxicological values of mixture of PAHs and suggested BMDL10 values for 2 PAHs, 4 PAHs and 8 PAHs in food (EFSA,
2008). BMDL10is the benchmark dose of lower confidence limit to increase the
amount of animals bearing tumor by 10%, and it is used for genotoxic and carcinogenic chemicals which do not have shreshoulds in toxicological dose-response relationship and health guidance values such as PAHs.
A Margin of Exposure (MOE) has been used for risk characterization for PAHs with BMDL10 since the Joint FAO/WHO Expert committee on Food Additives (JECFA) recommended us to use it in 2005 (JECFA, 2005, Lee et al., 2016b). Genotoxic and carcinogenic substances do not have health guidance values and the exposure to those chemicals should be minimized as low as reasonably achievable (ALARA). However, risk managers get no information from ALARA to make policies for food safety. MOE can give information for risk managers to establish priority lists for hazardous substances. They compare the MOE values to appropriate reference points. When the MOE values of substances are higher than 10,000, they would be of low concern to public health and risk managers should focus on other substances (Benford et al., 2010a,
Benford et al., 2010b).
There are a few studies assessing the risks of PAHs in food with MOE. Especially edible oils and teas are highly consumed in Korea even though they are easily contaminated by PAHs due to heat processing to dry them. Therefore, I determined levels of 4 PAHs in edible oils and tea highly consumed in the Korean market with a validated analytical method and characterized their risks with MOE values. Furthermore, I compared the risks of PAHs in tea assessed by the traditional TEQ concept and the MOE.
The consumption of grilled, smoked and roasted meats has been recently increased not only at home but also in restaurants. And high intake of those foods has been elevating the public health risk comparing to other foods which is processed by other processing methods (Kao, Chen, Huang, Chen, & Chen, 2014; Sundararajan, Ndife, Basel, & Green, 1999).
The generation of PAHs in grilled and smoked foods is not precisely (Farhadian, Jinap, Fa understood but PAHs may be formed from pyrolysis of organic matter including fat and their recombination in high cooking temperature (ridah, & Zaidul, 2010). PAHs in smoke from incomplete combustion of charcoal or wood can attached to the surface of grilled and smoked foods (Rey-Salgueiro, Garcia-Falcon, Martinez-Carballo, & Simal-Gandara, 2008; Bartle, 1991; Knize, Salmon, Pais, & Felton, 1999). However, no research has
explained which grilling and smoking processes influence on the level of PAHs Therefore, this study determined what procedures in grilling meats affect the occurrence of PAHs. For this, the levels of PAHs generated during grilling meats with different kinds of meat, cooking temperatures, cooking time and cooking apparatus were compared. This study eventually showed the best cooking practices for reducing the risk of exposure to PAHs by consuming the grilled meats.
Chapter II.
Risk Characterization of Polycyclic Aromatic
Hydrocarbons in Edible Oils
1
1 This chapter has been published : Joon-Goo Lee, Jung-Hyuk Suh and
Hae-Jung Yoon, 2019, Occurrence and risk characterization of polycyclic aromatic hydrocarbons of edible oils by the Margin of Exposure (MOE) approach. Appl Biol Chem, 62:51
II-1. Introduction
Polycyclic aromatic hydrocarbons (PAHs) are a group of chemical substances comprised of two or more benzene rings (IARC, 2010). They are occurred from the incomplete combustion of fossil fuels, organism and geochemical process. Some PAHs have been confirmed to have carcinogenic and genotoxic property by binding to deoxyribonucleic acid (DNA) (IARC, 2010). Sixteen PAHs are recently selected as priority targets to manage by Environmental Protection Agency (EPA) on the basis of their occurrence rate and carcinogenic risk (Zelinkova et al., 2015). The European Union chose benzo(a)pyrene (BaP) as a mark for total PAHs in foods and set maximum levels in different food groups. However, scientists in European Food Safety Authority (EFSA) recently figured out that BaP is improper as an indicator for total PAHs, and 4 PAHs such as Benz(a)anthracene (BaA), Chrysene (CHR), Benzo(b)fluoranthene (BbF), and Benzo(a)pyrene (BaP) would be more suitable as indicators (EFSA, 2008). The European Union has added new maximum levels for sum of 4 PAHs in different food groups (EC, 2011).
The contamination of PAHs in foods is originated from environmental pollutants, manufacturing foods and cooking processes, and PAHs sometimes show up from contaminated packaging material in the low amounts (Lee et al., 2016a, Simko et al., 1995, Speer et al., 1990). Some studies have been performed to determine
PAHs in food samples, and determination of contaminations of PAHs in various food stuffs has been published (EFSA, 2008, Lee et al., 2018). Fats and oils are easily contaminated to PAHs because of their powerful lipophilic characteristics (Balenovic et al., 1995). There are some reasons of PAHs contamination in seed oils. Drying seeds by direct heating with fire or indirect heating with hot air can be a key cause of PAHs contamination in some seed oils. Another possible factor of contamination of PAHs in vegetable oils would be originated from contaminated environment such as soil, water, air or packaging materials (Moret et al., 2000). The direct consumption or production of food with fats and oils as ingredients is one of the most important concerns that PAHs in oils have to be managed (Moret et al., 2005, Teixeira et al., 2007). Furthermore, the absorption of PAHs through intestines is another important reason for managing and controlling the PAHs in fats and oils (Starvic et al., 1994). When crude edible oils are purified and dewaxed through refining processes, the amounts of PAHs can be drastically decreased according to the refining conditions (Moret et al., 2000). Therefore, the management of pressure-extracting oils without refinement is more significant rather than controlling refined oils. Several research measured degree of exposure to PAHs by dietary intakes of edible oils, since US EPA adopted the toxic equivalency Quotient (TEQ) concept to estimate exposure of PAHs (Nisbet et al., 1992). BaP equivalent concentrations (TEQBaP)
were calculated by multiplying each PAH concentration with its toxic equivalency factor (TEFs) (Nisbet et al., 1992, Jiang et al., 2015, Zhao et al., 2014). However, scientists in panel of EFSA recently published that the TEQ approach should be used only for the chemicals which showed the similar toxic mechanism including polychlorinated dibenzo-p-dioxins and –dibenzofurans (Dioxins). Although some PAHs are inducing carcinogenicity by binding to DNA and leading to mutated DNA, each PAHs cause cancers in different mechanisms (EFSA, 2008). Therefore, health guidance values of toxicity should be induced from mixture of PAHs and be used to characterize the risks of PAHs. Unfortunately, not many research has been published to determine the risks of PAHs by using new toxicological values induced from the mixture of PAHs, not a TEQ approached-value. To assess risks of exposure to PAHs to the public health by dietary intake of edible oils, Margin of Exposures (MOEs) were calculated by the benchmark dose lower confidence limit for a 10% increase in the number of tumour-bearing animals in contrast with control animals((BMDL10) (Benford et al., 2010, JECFA, 2005). Hazardous chemicals
which are not only genotoxic but also carcinogenic may have limitation of detecting a dose-response correlationship in a bioassay, and health-based guidance values cannot be derived without a possible threshold (Benford et al., 2010). Therefore, it is necessary to decrease their risks to As Low As
Reasonably Achievable (ALARA) levels (O’brien et al., 2006). The MOEs have become the better approach and been used for providing priority of risks to policy makers (Lee et al., 2016b). I determined simultaneously the levels of BaA, CHR, BbF, and BaP in edible oils with the validated analytical method and evaluated their risks of exposure to PAHs to the public health by using MOEs. Furthermore, I compared the risks of exposure to PAHs estimated from new toxicological values induced from the mixture of 4 PAHs to those from traditional toxic values calculated from equivalency factor (TEF) values.
II-2. Materials and Methods
Chemicals and materials. I purchased Benzo[a]anthracene, Chrysene,
Benzo[b]fluoranthene and Benzo[a]pyrene as standards and deutrated Chrysene and deutrated Benzo[a]pyrene as internal standards from Supelco (Bellefonte, PA, USA). Stock standards solutions of 100 μg/mL were made by dissolving standards and internal standards in methylene chloride, and working standards solutions of 400 μg/L were prepared by diluting stock standards with methylene chloride. 5 calibration standards were diluted to 0.2, 0.5, 1, 2, 5 μg/L with working standards in methylene chloride for leached and solid teas, and 0.1, 0.2, 0.4, 1 and 2 μg/L for liquid tea. Calibration standards contained 2 internal standards of 4 μg/L. Potassium hydroxide (Wako, Osake, Japan), sodium sulfate (Wako, Osake, Japan) were prepared, and ethyl alcohol (Merck, Darmstadt, Hesse, Germany), N,N-dimethylformamide (Merck, Darmstadt, Hesse, Germany), ethyl acetate (Merck, Darmstadt, Hesse, Germany), n-hexane (Merck, Darmstadt, Hesse, Germany), Methylee chloride (Burdick & Jackson, Muskegon, MI, USA) were HPLC grade. Deionized water was filtered by a Milli-Q system (Bedford, MA, USA), and SPE cartridges packed with silica of 50 mg in plastic syringe of 3cc (Supelco, Bellefonte, PA, USA) were used. I used a rotary evaporator
of Eyela (evaporate solutions, a rotary evaporator (Eyela, Tokyo) and a nitrogen evaporator of Organomation Associates. Inc (Oa-SYS Heating Device 5085, USA) to evaporate and dry solutions.
Pretreatment of sample. A oil sample of 10 g was weighed and moved into
a separatory funnel, and then it was shaken with N,N-DMF-DW (9:1, v/v) of 50 mL and n-hexane of 100 mL in the presence of the 2 deuterated internal standards (4 ng g-1). The N,N-DMF-DW (9:1, v/v) was transferred to a new separatory funnel and hexane layer solution extracted twice with 25 mL of N,N-DMF-DW (9:1, v/v) by shaking and equilibrating it. A sodium sulfate solution (1 %) of 100 mL aliquot and n-hexane of 50 mL were added to the N,N-DMF-DW layer and shaken, and the n-hexane layer was moved to another separatory funnel. The extraction with n-hexane was repeated twice. The extracted hexane were washed with 40 mL of DW 3 times, and then, anhydrous Na2SO4 (15 g)
was added to the hexane extract to remove DW remained. The extract was evaporated to approximately 2 mL by a rotary evaporator (Eyela, Tokyo Rikakikai Co. Ltd., Japan) to be purified with SPE catrideges (MFDS, 2013). The enriched extract was purified with the silica cartridge activated with dichloromethane (10mL) and n-hexane (20mL), and then the cartridge was washed with n-hexane (5mL) and eluted with n-hexane-dichloromethane (3:1,
v/v) (15mL). The eluate was concentrated to approximately 2 mL using a rotary evaporator. The concentrate was purified with a SPE-PAHs cartridge previously activated with n-hexane (1mL), and the cartridge was eluted with 0.5 mL and 1 mL of n-hexane followed by 3 mL of ethylacetate. The eluate was dried with a nitrogen evaporator (Oa-SYS Heating Device 5085, Organomation Associates. Inc., USA) at 20 psi stream of nitrogen (40 °C). The analyte was finally prepared by dissolving the dryness in 200 L of dichloromethane for GC-MS analysis.
Determination of PAHs using GC-MS. Determination PAHs was
determined and measured by using a GC chromatography, CP-3800 of Varian (CA, USA) with MS spectrometry, 1200L of Varian (CA, USA). An auto-sampler, Combi-PAL of CTC Analytics (Zwingen, Switzerland) was used based on the Korean Food Code method. A DB-5ms GC capillary column from Agilent technologies (CA, USA) with length of 30 m, inner diameter of 25 µm and film thickness of 0.25 μm was equipped. The oven was heated at a rate of 4 ℃/min to 245 ℃ following being at 80 ℃ for 1 min, and it was finally increased to 270 ℃ at 30 ℃/min followed by being held for 10 min. Helium carrier gas was flowing at 1.5 mL/min. A injector was at the temperature of 320 ℃ and 1 µL of samples were injected with splitless mode. Mass spectrometry was operated with source temperature of 250 ℃ and electron ionization (EI) of 70
eV. Signals are acquired by selective ion monitoring (SIM) mode with dwell time of 0.1 s. The 4 PAHs were quantified by comparison of retention times and ion masses of selected ions to those of the 4 PAHs in standards and qualified by calculating their levels with calibration curve. The BaA and CHR ions were m/z 228, m/z 229, m/z 226, and the quantitative analysis target ion was m/z 228. BbF and BaP were m/z 252, m/z 253, m/z 250, and the quantitative analysis target ion was m/z 252. CHR-d12 was m/z 240, m/z 241, m/z 236, and the quantitative analysis target ion was m/z 240. BaP-d12 was m/z 264, m/z 265, m/z 260, and the quantitative analysis target ion was m/z 264. When the difference of the ratios of other two qualifying ions in sample and standard were within 10 %, the peaks of PAHs in sample were accepted (MFDS, 2013).
Quality control. The method was validated to ensure the quality of analytical
results. Performance parameters: specificity, limit of detection (LOD), limit of quantification (LOQ), linearity, recovery, and precision were obtained to validate the method based on guidelines recommended by the International research group (Eurachem, 1998). Specificity was obtained by checking the isolation of PAHs peaks from noise peaks in samples fortified with PAHs. LOD was statistically calculated by multiplying 3 to a standard deviation obtained in repeated analysis of the lowest control 7 samples of 1.0 ng g-1. LOQ was
estimated by multiplying 9 to the same standard deviation. Linearity of calibration curve was obtained by calculating the correlation coefficient (R2). Six working standards of 1.0, 5.0, 10.0, 50.0, 100.0 and 500.0 μg/L were plotted and calibration curve was obtained by regression an equation of 6 plots. The relative recovery of accuracy was evaluated by analyzing five samples fortified with standards of 2.0 ng g-1and 10 ng g-1 and deuterated internal standards of 4.0 ng g-1 and calculating the average percentage of determined concentration via fortified amount. The repeatability of accuracy was evaluated by calculating the relative standard deviation (RSDr) obtained in the recovery experiments. The
reproducibility of accuracy was evaluated by calculating the relative standard deviation (RSDR) in experiments conducted by 4 different labs.
Exposure estimation and risk characterization. Exposure to PAHs was
estimated by combining PAHs contamination levels and edible oil consuming amounts. PAHs concentration and edible oil consuming data were obtained by this study and KNHANES, respectively. Consumption data of edible oils for total population and consumers were originated from KNHANES IV and V. KNHANES IV was conducted from 2007 to 2009 and KNHANES V was carried out from 2010 to 2012. The second and third programmes of KNHANES IV in 2008 and 2009 and the first programme of KNHANES V in 2010 were selected
to assess exposure to edible oils. The numbers of samples in 2008, 2009 and 2010 were 9,308, 10,078 and 8,473, respectively (CDC, 2008, CDC, 2009, CDC, 2010). The KNHANES is composed of three surveys: health interview, health examination and nutrition survey and food consumption data is collected by nutrition survey. Nutrition survey is conducted by face to face interview in sample person’s home using the 24 hour recall method (Kweon et al., 2014). The values below LOD were statistically assumed based on the recommendation of GEMS/Food. When the proportion of data below LOD was zero, the concentration of PAHs was not statistically modified. Meanwhile, when the proportion was between 60% and 80% and more than 25 samples were detected, or when the proportion of not-detected samples was higher than 80%, the PAHs concentration was assumed to zero for lower-bound (LB) and to value of LOD for upper-bound (UB). When not-detected sample was between 0% and 60%, the concentration of PAHs was replaced to half of LOD value (GEMS/Food, 1995). To calculate total PAHs concentration, the concentrations of each PAH were combined to use new toxicological values. Meanwhile, to use TEQ concept, BaA, CHR and BbF were estimated as BaP equivalent concentrations (TEQBaP) by
multiplying each PAH concentration with its TEF. TEFs of BaA, CHR and BbF were 0.1, 0.01, and 0.1, respectively (Moret et al., 2005).
The daily intakes of 4 PAHs and TEQBaPwere calculated by using equation (1) (Yoon et al., 2007). Daily exposure kg b. w. dayng =concentration of PAHs (or TEQ ) ngg × daily edible oil intake( g day) body weight (kg) (1)
To characterize a risk of PAHs, MOE was estimated by using equation (2). The MOE is used for assessing the risk of substances which does not show a threshold in the dose-response curve because of their genotoxic and carcinogenic properties. Exposure of it should be minimized according to “As Low As Reasonably Achievable (ALARA)” principle. However, Risk manager cannot get any information from ALARA which degree they should reduce which substances. The MOE could be one of the suitable approaches for the risk managers to set a priority list by comparing an appropriate reference point with human intake. The MOE of 10,000 or high in general would be interpreted as low concern to public health (EFSA, 2008).
Margin Of Exposure = BMDL (
ng kg b. w. day)
The estimated daily exposure (kg b. w. day)ng
In equation (2), MOE is calculated by dividing BMDL10 value by the estimated
daily exposure, and BMDL10 value was set by the dose-response analysis for
tumor type. BMDL10 for BaP and the sum of 4 PAHs ranged from 0.07 to 0.20
mg kg-1 b.w. day-1 and from 0.34 to 0.93 mg kg-1 b.w. day-1 based on total
tumour-bearing animals, respectively. Therefore, 0.07 and 0.34 mg kg-1 b.w. day-1 were conservatively adopted for BMDL10 of the BaP and the 4 PAHs
II-3. Results and discussions
Quality control. The specificity of the estimating method was guaranteed by
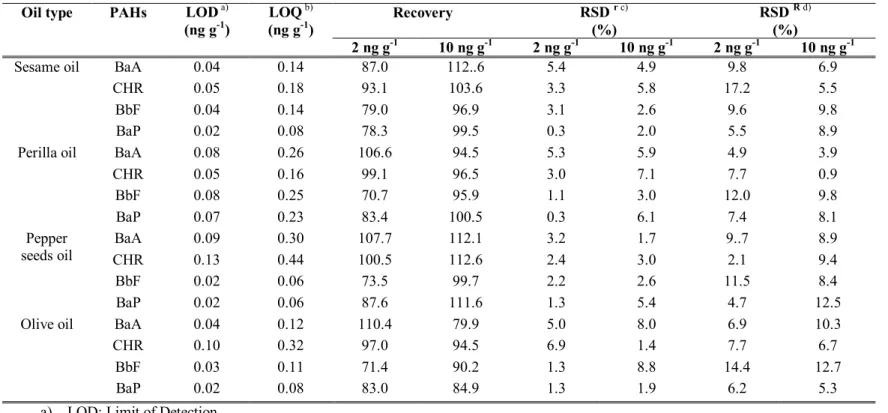
comparing retention times with reference materials in blank samples and monitoring fragment ions for each target compound. The calibration plots based on the linear regression analysis revealed good correlations between peak area and concentrations over the ranges 1–500 μg/L with correlation coefficients over 0.99 . The LOD and LOQ ranged from 0.02 to 0.13 ng g-1and from 0.06 to 0.44 ng g-1at four types of oil samples, respectively. The relative recoveries of 4
PAHs were from 70.7 to 110.4 % at 2 ng g-1 and from 79.9 to 112.6 % at 10 ng g-1.The RSDr for repeatability at a level of 2 ng g-1 were from 0.3 to 6.9 %, and from 1.4 to 8.8 % at a level of 10 ng g-1. The RSDR for reproducibility was from 2.1 to 17.2 % at a level of 2 ng g-1and from 0.9 to 12.7 % at a level of 10 ng g-1. All values of performances are shown in table II-1, and they are satisfying
the criteria proposed by Association of Official Agricultural Chemists (AOAC) (Table 1) (Taverniers et al., 2004).
Table II-1. Performance parameters of the method in optimum condition
a) LOD: Limit of Detection b) LOQ: Limit of Quantification
c) RSDr: Relative standard deviation of repeatability in single-lab.
d) RSDR: Relative standard deviation of reproducibility in multi-lab.
Oil type PAHs LODa)
(ng g-1) LOQ b) (ng g-1) Recovery RSD r c) (%) RSD R d) (%) 2 ng g-1 10 ng g-1 2 ng g-1 10 ng g-1 2 ng g-1 10 ng g-1
Sesame oil BaA 0.04 0.14 87.0 112..6 5.4 4.9 9.8 6.9
CHR 0.05 0.18 93.1 103.6 3.3 5.8 17.2 5.5
BbF 0.04 0.14 79.0 96.9 3.1 2.6 9.6 9.8
BaP 0.02 0.08 78.3 99.5 0.3 2.0 5.5 8.9
Perilla oil BaA 0.08 0.26 106.6 94.5 5.3 5.9 4.9 3.9
CHR 0.05 0.16 99.1 96.5 3.0 7.1 7.7 0.9
BbF 0.08 0.25 70.7 95.9 1.1 3.0 12.0 9.8
BaP 0.07 0.23 83.4 100.5 0.3 6.1 7.4 8.1
Pepper
seeds oil CHRBaA 0.090.13 0.300.44 100.5107.7 112.1112.6 3.22.4 3.01.7 9..72.1 8.99.4
BbF 0.02 0.06 73.5 99.7 2.2 2.6 11.5 8.4
BaP 0.02 0.06 87.6 111.6 1.3 5.4 4.7 12.5
Olive oil BaA 0.04 0.12 110.4 79.9 5.0 8.0 6.9 10.3
CHR 0.10 0.32 97.0 94.5 6.9 1.4 7.7 6.7
BbF 0.03 0.11 71.4 90.2 1.3 8.8 14.4 12.7
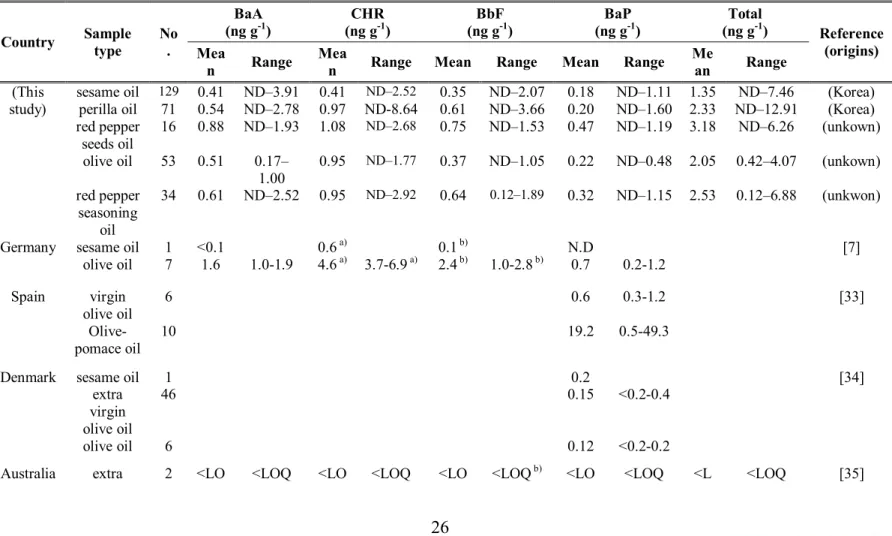
Occurrence of 4 PAHs in edible oils. Table II-2 shows means and ranges
for BaA, CHR, BbF, BaP and the sum of PAHs from edible oils analyzed in this study. A value below the LOQ was assigned to ND (not detected). The perilla oils and sesame oils were highly contaminated with PAHs. A maximum limit value of 2 ng g-1 for BaP was established in edible oils in Korea and EU (EC, 2011). The mean concentration of PAHs in 129 sesame oil samples analyzed was 0.41 ng g-1 for BaA, 0.41 ng g-1 for CHR, 0.35 ng g-1 for BbF, 0.18 ng g-1 for BaP and 1.35 ng g-1 for the sum of 4 PAHs,
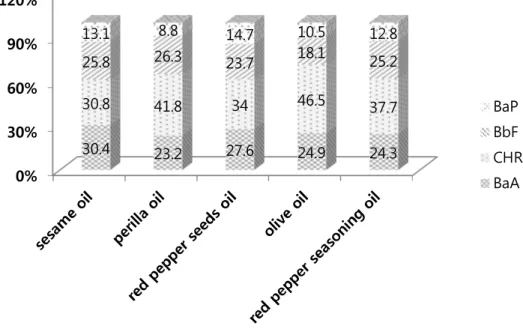
respectively. The contents of BaP in sesame oils were lower than maximum limit. The mean concentration of BaA (0.54 ng ng-1), CHR (0.97 ng ng-1), BbF (0.61 ng ng-1) and BaP (0.20 ng ng-1) for 71 perilla oil samples were analyzed and BaP were contaminated lower than the established maximum limit. Table II-2 shows PAHs content of edible oils in other countries. Red pepper seeds oil contained the highest 4 PAHs content in edible oils in Korea. However, there were no researches to determine PAHs content in red pepper seed oils in other countries. Meanwhile, PAHs contents in sesame oil and olive oil in Korea were similar with or lower than those in other countries. The relative contributions of each of the 4 PAHs to the total content of 4 PAHs in five edible oil categories were shown in figure 1. CHR had the highest average contributions of 30.8–46.5% in edible oils, and BaA, BbF
Table II-2. PAHs concentrations in edible oils
Country Sample type No.
BaA (ng g-1) (ng gCHR-1) (ng gBbF-1) (ng gBaP-1) (ng gTotal-1) Reference (origins) Mea n Range Mea
n Range Mean Range Mean Range
Me
an Range
(This
study) sesame oil
129 0.41 ND–3.91 0.41 ND–2.52 0.35 ND–2.07 0.18 ND–1.11 1.35 ND–7.46 (Korea)
perilla oil 71 0.54 ND–2.78 0.97 ND-8.64 0.61 ND–3.66 0.20 ND–1.60 2.33 ND–12.91 (Korea)
red pepper seeds oil 16 0.88 ND–1.93 1.08 ND–2.68 0.75 ND–1.53 0.47 ND–1.19 3.18 ND–6.26 (unkown) olive oil 53 0.51 0.17– 1.00 0.95 ND–1.77 0.37 ND–1.05 0.22 ND–0.48 2.05 0.42–4.07 (unkown) red pepper seasoning oil 34 0.61 ND–2.52 0.95 ND–2.92 0.64 0.12–1.89 0.32 ND–1.15 2.53 0.12–6.88 (unkwon)
Germany sesame oil 1 <0.1 0.6a) 0.1b) N.D [7]
olive oil 7 1.6 1.0-1.9 4.6a) 3.7-6.9a) 2.4b) 1.0-2.8b) 0.7 0.2-1.2 Spain virgin olive oil 6 0.6 0.3-1.2 [33] Olive-pomace oil 10 19.2 0.5-49.3
Denmark sesame oil 1 0.2 [34]
extra virgin olive oil
46 0.15 <0.2-0.4
olive oil 6 0.12 <0.2-0.2
virgin
olive oil Q Q Q
b) Q OQ
olive oil 3 <LO Q <LOQ <LO Q <LOQ <LO Qb) <LOQ b) <LO Q <LOQ <L OQ <LOQ Italy olive-pomace oil 3 12.4 6.0-25.0 60.9 133.218.6- 11.3 b) 1.1-31.4 b) 5.9 0.9-15.4 90.5 26.8-205.0 Portugal virgin olive oil 2 0.7 0.5-0.9 0.3 0.1-0.6 0.4 0.3-0.4 0.2 0.1-0.3 1.6 1.0-2.2 [12]
Kuwaitc) sesame oil 9 2.05
0.28-11.05 [14] extra virgin olive oil 21 0.53 0-6.77 virgin olive oil 7 0.90 0-6.31 olive oil 7 N.D. pomace olive oil 6 2.06 0-3.62
a) Sum of Chrysene and triphenylene
b) Sum of Benzo[b]Fluoranthene, Benzo[j]Fluoranthene and Benzo[k]Fluoranthene
c) Samples purchased from Kuwait markets originated from various countries. The original countries of sesame oils were SA, KW, IN, TH and SG, and those of extra virgin olive oils were from TR, SY, IT, ES, PS, TN, LB, CA and SA. The Virgin olive oils were made from TR, SY, PS and IT, and the pomace olive oils were from ES. Abbreviations of countries: TR; Turkey, SY; Syria, IT; Italy, ES; Spain, PS; Palestine, TN; Tunisia, LB; Lebanon, CA; Canada, SA; Saudi Arabia, SG; Singapore, KW; Kuwait, IN; India, TH; Thailand
Fig. II-1. Relative contribution of 4 PAHs in 5 edible oil categories. 0% 30% 60% 90% 120% 30.4 23.2 27.6 24.9 24.3 30.8 41.8 34 46.5 37.7 25.8 26.3 23.7 18.1 25.2 13.1 8.8 14.7 10.5 12.8 BaP BbF CHR BaA
and BaP had the average contributions of 23.2–30.4%, 18.1–26.3% and 8.8– 14.7%, respectively. Figure 2 shows the correlation of BaP and 4 PAHs in 5 edible oils. BaP has strong correlations with 4 PAHs in sesame oil, red pepper seasoning oil and red pepper seeds oil with correlation coefficients higher than 0.8. BaP has also correlations with 4 PAHs in other edible oils. However, some sesame oils and perilla oils contain 4 PAHs when BaP is not detected. Therefore, BaP is not good to represent 4 PAHs, even though BaP has correlations with 4 PAHs. Alomirah also figured out that Bap was not detected in some olive oils while eight genetoxic PAHs were detected and BaP is not good as the indicator for PAHs (Alomirah et al., 2010).
Fig. II-2. Correlations between 4 PAHs and BaP in 5 edible oil categories; (a) Sesame oil, (b) perilla oil, (c) olive oil, (d) red pepper seasoning oil, and (e) red pepper seeds oil.
Consumption of edible oils. The consumption of sesame oils, perilla oils
and olive oils were reported in KNHANES, whereas the consumptions of red pepper seeds oils and red pepper seasoning oils did not appear in KNHANES. Therefore, the amounts of red pepper seeds oils and red pepper seasoning oils intake were substituted by the consumption data of hot sauces. The mean daily intake and the consumption at the 95th percentile of edible oils for total population and consumers are shown in Table II-3. The zero consumption data at 95th percentile means that the Korean consumer intake
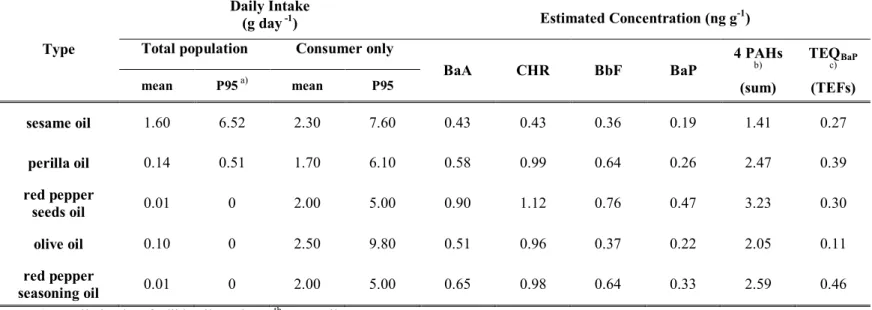
Table II-3. Consumption amounts of edible oils and estimated concentrations of each 4 PAH according to the proportion of not-detected samples
a) Daily intake of edible oils at the 95thpercentile b) The Sum of BaA, CHR, BbF and BaP contents
c) The estimated equivalent concentrations of BaP calculated by TEFs of BaA, CHR and BbF
Type
Daily Intake
(g day-1) Estimated Concentration (ng g-1)
Total population Consumer only
BaA CHR BbF BaP 4 PAHs b) (sum) TEQBaP c) (TEFs) mean P95a) mean P95 sesame oil 1.60 6.52 2.30 7.60 0.43 0.43 0.36 0.19 1.41 0.27 perilla oil 0.14 0.51 1.70 6.10 0.58 0.99 0.64 0.26 2.47 0.39 red pepper seeds oil 0.01 0 2.00 5.00 0.90 1.12 0.76 0.47 3.23 0.30 olive oil 0.10 0 2.50 9.80 0.51 0.96 0.37 0.22 2.05 0.11 red pepper seasoning oil 0.01 0 2.00 5.00 0.65 0.98 0.64 0.33 2.59 0.46
Exposure estimation. The proportions of samples contaminated with PAHs
below the LOD were below 60% and the values below the LOD was replaced to half of LOD. The estimated mean concentrations of 4 PAHs in edible oils were from 0.19 ng g-1 to 1.12 ng g-1 (Table II-2). The total contents of 4 PAHs and the total BaP equivalent values were from 1.41 to 3.23 and from 0.11 to 0.46 (Table 3). The average bodyweight of Korean was 58.3 kg (CDC, 2008, CDC, 2009, CDC, 2010). Table 4 shows the average and 95th percentile daily intakes of 4 PAHs for total populations and
consumers. The daily exposures to high consumers in the 95th percentile were from three times to five times greater than that of mean daily consumers. Furthermore, the mean and high exposures to total 4 PAHs for total populations and consumers only were shown in Table II-4, and they were compared with the exposures to estimated equivalent BaP. Korean people were the most highly exposed to PAHs from sesame oils among edible oils according to the estimations by both sum of each PAH and TEQBaP. This highest intake of PAHs by consumption of sesame oils arises
because Korean people consume sesame oil over 10 times more than other edible oils although the sesame oils are not highly contaminated with PAHs compared to others. Meanwhile, Korean consuming edible oils was exposed to PAHs mostly by olive oil due to the highest contamination of PAHs. In Brazil, people exposure to 4 PAHs of 7.3 ng kg-1 b.w. day-1 via edible oils
(soybean oils) (Camargo et al., 2011), and in Australia, People consume canola oil of 0.3 g day-1 and it contains BaA of below 0.06 ng g-1, Chr of below 0.1 ng g-1, BaP of below 0.08 ng g-1. People in Australia exposure to
BaA of 0.018 ng kg-1day-1, Chr of 0.03 ng kg-1 day-1and BaP of 0.024 ng kg-1 day-1at most (FSANZ, 2004). In Europe, the exposure to BaP and 4 PAHs via fats (vegetable and animal) are 26 ng day-1 and 177 ng day-1 (EFSA, 2008). Korean is not highly exposed to PAHs by eating edible oils comparing to other countries’ people.
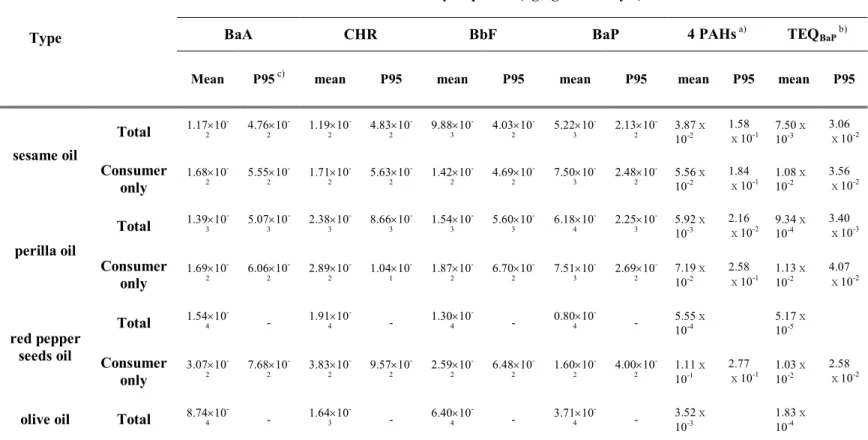
Table II-4. Dietary exposures to each PAH and total 4 PAHs by consuming edible oils
Type
Population
Dietary Exposure (ng kg-1b.w. day-1)
BaA CHR BbF BaP 4 PAHsa) TEQ
BaPb)
Mean P95c) mean P95 mean P95 mean P95 mean P95 mean P95
sesame oil Total 1.17´102 - 4.76´10 -2 1.19´10 -2 4.83´10 -2 9.88´10 -3 4.03´10 -2 5.22´10 -3 2.13´10 -2 3.87ⅹ10-2 1.58 ⅹ10-1 7.50ⅹ10-3 3.06 ⅹ10-2 Consumer only 1.68´10 -2 5.55´10 -2 1.71´10 -2 5.63´10 -2 1.42´10 -2 4.69´10 -2 7.50´10 -3 2.48´10 -2 5.56ⅹ10-2 1.84 ⅹ10-1 1.08ⅹ10-2 3.56 ⅹ10-2 perilla oil Total 1.39´103 - 5.07´10 -3 2.38´10 -3 8.66´10 -3 1.54´10 -3 5.60´10 -3 6.18´10 -4 2.25´10 -3 5.92ⅹ10-3 2.16 ⅹ10-2 9.34ⅹ10-4 3.40 ⅹ10-3 Consumer only 1.69´10 -2 6.06´10 -2 2.89´10 -2 1.04´10 -1 1.87´10 -2 6.70´10 -2 7.51´10 -3 2.69´10 -2 7.19ⅹ10-2 2.58 ⅹ10-1 1.13ⅹ10-2 4.07 ⅹ10-2 red pepper seeds oil Total 1.54´104 - - 1.91´10 -4 - 1.30´10 -4 - 0.80´10 -4 - 5.55ⅹ10-4 5.17ⅹ10-5 Consumer only 3.07´10 -2 7.68´10 -2 3.83´10 -2 9.57´10 -2 2.59´10 -2 6.48´10 -2 1.60´10 -2 4.00´10 -2 1.11ⅹ10-1 2.77 ⅹ10-1 1.03ⅹ10-2 2.58 ⅹ10-2
olive oil Total 8.74´104 - - 1.64´10
-3 - 6.40´10 -4 - 3.71´10 -4 - 3.52ⅹ10-3 1.83ⅹ 10-4
a) The Sum of BaA, CHR, BbF and BaP contents
b) The estimated equivalent concentrations of BaP calculated by TEFs of BaA, CHR and BbF c) Dietary exposure to PAHs at the 95thpercentile
Consumer only 2.19´10 -2 8.57´10 -2 4.10´10 -2 1.61´10 -1 1.60´10 -2 6.27´10 -2 9.28´10 -3 3.64´10 -2 8.81ⅹ10-2 3.45 ⅹ10-1 4.58ⅹ10-3 1.80 ⅹ10-2 red pepper seasoning oil Total 1.12´104 - - 1.68´10 -4 - 1.09´10 -4 - 0.56´10 -4 - 4.45ⅹ10-4 8.00ⅹ10-5 Consumer only 2.25´10 -2 5.61´10 -2 3.35´10 -2 8.38´10 -2 2.18´10 -2 5.45´10 -2 1.11´10 -2 2.79´10 -2 8.89ⅹ10-2 2.22 ⅹ10-1 1.59ⅹ 10-2 3.98 ⅹ10-2
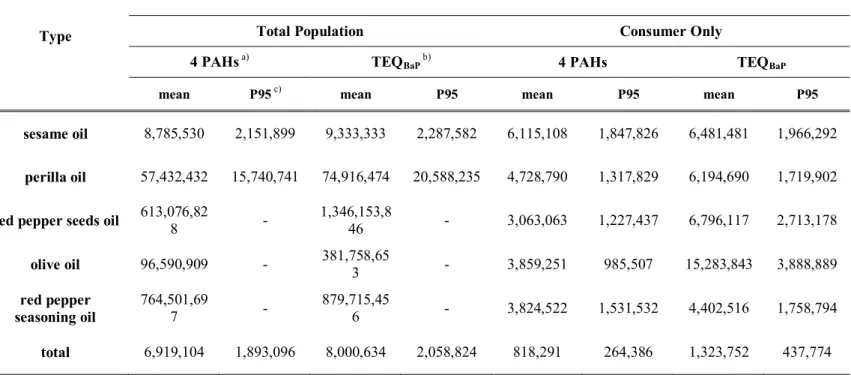
Risk characterization and uncertainty. The risk of PAHs by dietary intake
of edible oils was characterised by calculating MOEs (Table II-5). With regard to average consumption, the MOE of 4 PAHs for total population was 6,919,104 and that of consumers only was 818,291. In the case of high consumption in the 95th percentile, the MOEs were 1,893,096 and 264,386 for total population and consumers, respectively. All MOEs were over 1.0 ⅹ104and it was found that the risk of 4 PAHs in edible oils is “low concern from a public health point of view” (EFSA, 2008). According to the French total diet study, edible oils are the main contributors (16.2%) to PAHs exposure via foods (Veyrand et al., 2013). If Korean people are exposed to PAHs by edible oils with contribution of about 20%, MOEs will be between 66,096 and 1,729776. Therefore, exposure to PAHs by consuming food does not still represent a food safety issue to Korean people.
Furthermore, the MOEs of the estimated equivalent BaP calculated by TEFs of other 3 PAHs were from 2,058,824 to 8,000,634 for total population and 437,774 to 1,323,752 for consumers only. These MOEs are from 1.1 to 1.7 times higher than those of total of 4 PAHs. Therefore the risk of 4 PAHs estimated by the TEFs can be over-estimated comparing to the risk of total 4 PAHs. Many studies assessing the risk of PAHs by TEFs need to be re-assess the risk of PAHs by using total PAHs concentration and toxicological value from mixture of PAHs.
Table II-5. MOEs of total 4 PAHs by sum of each PAH and TEQBaPas BaP concentration estimated by TEFs
a) The Sum of BaA, CHR, BbF and BaP contents
b) The estimated equivalent concentrations of BaP calculated by TEFs of BaA, CHR and BbF c) Dietary exposure to PAHs at the 95thpercentile
Type
MOEs
Total Population Consumer Only
4 PAHsa) TEQ
BaPb) 4 PAHs TEQBaP
mean P95c) mean P95 mean P95 mean P95
sesame oil 8,785,530 2,151,899 9,333,333 2,287,582 6,115,108 1,847,826 6,481,481 1,966,292
perilla oil 57,432,432 15,740,741 74,916,474 20,588,235 4,728,790 1,317,829 6,194,690 1,719,902
red pepper seeds oil 613,076,828 - 1,346,153,846 - 3,063,063 1,227,437 6,796,117 2,713,178
olive oil 96,590,909 - 381,758,653 - 3,859,251 985,507 15,283,843 3,888,889
red pepper
seasoning oil 764,501,697 - 879,715,456 - 3,824,522 1,531,532 4,402,516 1,758,794
Statistical analysis. The percentages of ND sample of BaA, CHR, BbF
and BaP in all leached teas were less than 60%, therefore, the values of ND samples were substituted with half of the LOD. Meanwhile, CHR for green, barley and black tea in the liquid tea variety were not detected at all, and were replaced with 0 for LB and LOD for UB. The percentage of sample containing BaA, BbF and BaP were less than 60% and replaced with half of the LOD. BaA for preserved fruit tea was changed to 0 for LB and the LOD for UB, and half of the LOD was used for the other 3 PAHs for preserved fruit tea. For solid tea, BaP for black, herbal and ginger were substituted with 0 for LB and the LOD for UB, and half of the LOD was used for the other 3 PAHs. All samples of green tea contained all 4 PAHs.
II-4. Conclusion
To characterize the risk of PAHs in Korea by consuming the edible oils, an analytical method to detect 4 PAHs simultaneously was validated. The perilla oils and sesame oils were highly contaminated with 4 PAHs, and this might be because perilla and sesame seeds were fried at high temperature before being extracted. The levels of BaP in edible oils were suitable with regard to the Korean BaP maximum levels. According to the MOEs of 4 PAHs, the risk of PAHs in edible oils was of low concern.
Chapter III.
Risk Assessment of Polycyclic Aromatic
Hydrocarbons in Teas
2
2 This chapter has been published: Joon-Goo Lee, Taesuk Lim, Sheen-Hee
Kim, Dong-Hyun Kang and Hae-Jung Yoon, 2018, Determination and risk characterization of polycyclic aromatic hydrocarbons of tea by using the Margin of Exposure (MOE) approach, Food sci Biotehchnol, 27(6): 1843-1856
III-1. Introduction
Tea is a kind of drink which made of tea plant, even though tea is also referred as drinks made of vegetable substances including tea plant. Teas have several types of teas regarding to production procedures like fermentation and heating (Abd EL-Aty et al., 2014). Tea traditionally are made from the tea plant, camellia sinesis, refers to green or black tea (Wang et al., 2011). Teas have been consumed because of its taste, but many health benefits of teas have recently been figured out and made consumers to prefer to drink teas. Green teas contain fruitful catechins, a group of polyphenols, and especially (-)-epigallocatechin-3-gallage (EGCG), (-)-epigallocatecin (EGC), (-)-epicatechin (EC), and (-)-epicatechin gallate (ECG) of catechins showed the antiporliferative, antimutagenic, antioxidant, antibacterial, antiviral, and chemopreventive functions in some research (Banerjee et al., 2010, Butt et al., 2009).
Teas are classified into three categories in Republic of Korea by food code according to the tea production methods. Leached tea refers to tea made from plant materials like plants sprout, leaves, or flowers. Leached tea is normally produced by drying plant materials to reduce the amount of moisture and sometimes destroy the enzymes in plant materials. Leached tea is dipped and filtered in hot water and people drinks the water. Liquid tea is a
tea which is already dripped and filtered, and consumers don’t need to dip and filter it by themselves. Solid tea is a plant material itself or other processed form such as powder. People can melt the solid tea in water and drink the water (MFDS 2016).
Leached tea and some teas are dried to decrease the amount of moisture and destroy the enzymes to develop the tea flavor and taste. How to dry and how many times dry the tea are regarded to the most important steps. (Özcan et al., 2005, Venskutonis, 1997, Vieira et al., 2010). Tea is traditionally dried by frying tea several times, but recently using smoke, steam, sun-light or flames are easily used for rapidly drying tea. However, these drying processes develop not only quality of tea but also some hazard chemicals in tea. Polycyclic aromatic hydrocarbons (PAHs) are formed during drying tea with high temperature (Adisa et al., 2015, Pincemaille et al., 2014, Vieira et al., 2010).
PAHs are one of the well-known hazard chemicals formed with more than two aromatic rings. PAHs are produced by being combined with pyrolyzed organic matter in free-radical polymerization processes during incompletely combustion in high temperature (Longwell 1982, Richter and Howard, 2000).
reasons including bush fire, cars, and plants, and PAHs in the environment can contaminate food too. But Foods also produce the PAHs during cooking and processing them. Increasing the temperature of foods such as heating, grilling or smoking etc. accelerates formation of the PAHs (Boffetta et al., 1997, Lijinsky 1991, Singh et al., 2016). Food is the main source of consumers’ exposing to PAHs other than smoking cigarette (Zelinkova and Wenzi, 2015).
PAHs induce mutations, cancers and genotoxicity by interacting with DNA. PAHs are metabolized to active intermediates in liver by cytochrome P450 and the intermediates are chemically attached to DNA (IARC, 2010, Lagerqvist et al., 2011, Ramesh et al., 2015, Szeliga and Dipple, 1998). But not all PAHs show the mutagenic and carcinogenic risks. Some of PAHs in a number of PAHs are mutagens and carcinogens (Kao et al., 2014). 16 priority PAHs such as Naphthalane, Acenaphthene, Acenaphthylene, Fluorene, Phenanthrene, Anthracene, Fluoranthene, Pyrene, Benzo[a]anthracene, Chrysene, Benzo[b]fluoranthene, Benzo[k]fluoranthene, Benzo[a]pyrene, Dibenzo[a,h]anthracene, Benzo[g,h,i]perylene and Indeno[1,2,3,cd]pyrene were selected by the US Environmental Protection Agency (EPA) (1983) based on their carcinogenicity and toxicity for management the risks of PAHs (Fig. III-1). Meanwhile, 4 PAHs:
Benzo[a]anthracene (BaA), Chrysene (CHR), Benzo[b]fluoranthene (BbF) and Benzo[a]pyrene (BaP) were selected as the indicators of PAHs by the Europe Commission in 2011 after the European Commission had chosen Benzo[a]pyrene as an indicator of PAHs in 20005 because recent study from the European Food Safety Authority (EFSA) concluded that BaP could not represent PAHs in food and managing more than 4 PAHs did not have more advantages than managing only 4 PAHs. The European Commission added the maximum levels of sum of 4 PAHs to the maximum levels of BaP to several food categories (European Commission, 2006; Commission Union, 2011; European Food Safety Agency, 2008). In Korea, the Ministry of Food and Drug Safety (MFDS) has been set the maximum limits of BaP in different food categories such as edible oils, smoked fish, smoked meat etc.
In order to determine the PAHs levels in different kinds of food, several analytical methods with procedures of extraction and chromatography have been developed and optimized for different food matrix. PAHs have been extracted and isolated out of various foods by liquid-liquid extraction (LLE), solid-phase extraction (SPE) or saponification according to their marices. And isolated PAHs are quantified andqualified by chromatography such as liquid chromatography or gas chromatography with several detectors, fluorescence, ultraviolet-visible or mass spectrometry (Jira et al., 2008,
Plaza-Bolaños et al., 2010, Veyrand et al., 2007, Yu et al., 2012).
Several researches have been found that PAHs are occurred in various kinds of foods including edible oil and grilled meat etc. Edible oils are often containing high levels of PAHs because PAHs is easily carried over to edible oils from the seeds due to their being lipophilic when oils are extracted (Gertz and Kogelheide, 1994, Balenovic et al., 1995). Grilled and barbecued meats are also one of the most easily contaminated foods by PAHs because high levels of PAHs are produced when meat drips fall down to flame of charcoal and they are incompletely combusted. The meat drops are mainly composed of water, fats and proteins (Lee et al., 2016a).
Some research have assessed the risk of drinking teas according to exposure to PAHs to monitor the safety of tea, and most of them have used the Toxic Equivalency Quotient (TEQ) to evaluate the risk of exposure to 4 PAHs, since this approach was accepted by the US EPA (Nisbet et al., 1992). TEQ approach is the concept that changes the levels of other PAHs to BAP contents with toxic relations between other PAHs and BaP. The levels of BaP which are converted from those of other PAHs are called BaP equivalent contents (TEQBaP) and TEQBaP were calculated by multiplying
toxic equivalency factors (TEFs) and each PAHs contents (Jiang et al., 2015, Zhao et al., 2014, Alomirah et al., 2010, Martí-Cid et al., 2008). The
exposure to PAHs was finally shown by the exposure to BaP.
However, Scientists recently figured out that the TEQ concept is not suitable for PAHs because each PAHs has different toxicological mechanism. Food Safety Authority (EFSA) studied toxicological values of mixture of PAHs and suggested BMDL10 values for 2 PAHs, 4 PAHs and 8 PAHs in
food (EFSA, 2008). BMDL10 is the benchmark dose of lower confidence
limit to increase the amount of animals bearing tumor by 10%, and it is used for genotoxic and carcinogenic chemicals which do not have shreshoulds in toxicological dose-response relationship and health guidance values such as PAHs.
A Margin of Exposure (MOE) has been used for risk characterization for PAHs with BMDL10 since the Joint FAO/WHO Expert committee on Food Additives (JECFA) recommended us to use it in 2005 (JECFA, 2005, Lee et al., 2016b). Genotoxic and carcinogenic substances do not have health guidance values and the exposure to those chemicals should be minimized as low as reasonably achievable (ALARA). However, risk managers get no information from ALARA to make policies for food safety. MOE can give information for risk managers to establish priority lists for hazardous substances. They compare the MOE values to appropriate reference points. When the MOE values of substances are higher than 10,000, they would be
of low concern to public health and risk managers should focus on other substances (Benford et al., 2010a, Benford et al., 2010b).
There are a few studies assessing the risks of PAHs in food with MOE. Especially teas are highly consumed in Korea even though they are easily contaminated by PAHs due to heat processing to dry them. Therefore, I determined levels of 4 PAHs in tea highly consumed in the Korean market with a validated analytical method and characterized their risks with MOE values. Furthermore, I compared the risks of PAHs in tea assessed by the traditional TEQ concept and the MOE.
III-2. Materials and Methods
Chemicals and materials. I purchased Benzo[a]anthracene, Chrysene,
Benzo[b]fluoranthene and Benzo[a]pyrene as standards and deutrated Chrysene and deutrated Benzo[a]pyrene as internal standards from Supelco (Bellefonte, PA, USA). Stock standards solutions of 100 μg/mL were made by dissolving standards and internal standards in methylene chloride, and working standards solutions of 400 μg/L were prepared by diluting stock standards with methylene chloride. 5 calibration standards were diluted to 0.2, 0.5, 1, 2, 5 μg/L with working standards in methylene chloride for leached and solid teas, and 0.1, 0.2, 0.4, 1 and 2 μg/L for liquid tea. Calibration standards contained 2 internal standards of 4 μg/L. Potassium hydroxide (Wako, Osake, Japan), sodium sulfate (Wako, Osake, Japan) were prepared, and ethyl alcohol (Merck, Darmstadt, Hesse, Germany), N,N-dimethylformamide (Merck, Darmstadt, Hesse, Germany), ethyl acetate (Merck, Darmstadt, Hesse, Germany), n-hexane (Merck, Darmstadt, Hesse, Germany), Methylee chloride (Burdick & Jackson, Muskegon, MI, USA) were HPLC grade. Deionized water was filtered by a Milli-Q system (Bedford, MA, USA), and SPE cartridges packed with silica of 50 mg in plastic syringe of 3cc (Supelco, Bellefonte, PA, USA)
were used. I used a rotary evaporator of Eyela (evaporate solutions, a rotary evaporator (Eyela, Tokyo) and a nitrogen evaporator of Organomation Associates. Inc (Oa-SYS Heating Device 5085, USA) to evaporate and dry solutions.
Sampling. I bought 174 leached teas, 155 liquid teas and 139 solid teas
on markets in the 6 biggest cities in Korea. Tea products which are frequently consumed and easily contaminated by PAHs were selected based on the consumption data obtained by Korea National Health and Nutrition Examination Survey (KNHANES) and monitoring data from other research.
Sample preparation.
Leached tea and solid tea (powdered leached tea). Leached teas and
solid tea powdered from leached teas were homogenized with a blender (Mix-h03, Tongyang magic, China), and blended samples of 5 g and the internal standards of 200 μL were taken into a round-shaped flask of 500 mL. 1 M potassium hydroxide in ethanol of 100 mL was added to the flask, and the mixtures of samples were saponified under reflux at 80 ℃ for 3 h.
After the mixture was cooled down at room temperature, 50 mL of n-hexane was added through the reflux condenser to wash them. The mixture in flask was moved to a separatory funnel, and the flask was washed with 50 mL of solvent mixed with ethanol and n-hexane (1:1, v/v). The rinsed solution was collected to the separatory funnel. The separatory funnel was shaken and the hexane layer from the separatory funnel was isolated and transferred to another separatory funnel. The remainder of the mixture was extracted with 50 mL of n-hexane 2 times and the extracted hexane layers were combined. Afterwards, deionized water of 50 mL was added to the combined hexane layer to wash it and the layer was washed 2 times more. The washed layer was concentrated to 2mL with a vacuumed rotary evaporator, Eyela of Tokyo Rikakikai Co. Ltd. (Tokyo, Japan) following being dehydrated through anhydrous Na2SO4. The concentrated sample was
loaded on the silica-SPE cartridge which was washed and activated with 10 mL of dichloromethane and 20 mL of n-hexane in a row by gravity flow. The cartridge was cleaned with 10 mL of n-hexane and eluted with 20 mL of a mixed solvent of n-hexane and dichloromethane (3:1, v/v). The eluted solution was collected in a test tube and evaporated to dryness at 40 ℃ by nitrogen of 20 psi in a TurboVap of Zymark (MA, USA). The sample for GC-MS analysis was prepared by adding 200 µL of dichloromethane to the