Index terms Breast Cancer
Neoadjuvant Chemotherapy Magnetic Resonance Imaging Positron Emission Tomography
INTRODUCTION
Neoadjuvant chemotherapy (NAC) is a standard treatment for patients with locally advanced breast cancer and is gaining popularity for the treatment of patients with operable breast cancer to facilitate a breast-conserving surgery. Clinical and pathological responses to NAC represent the surrogates of long- term outcomes in breast cancer. The achievement of pathologi- cal complete response (pCR) or minimal disease after NAC is
correlated to a favorable disease-free and overall survival (1-3).
An accurate assessment of tumor response and early identifica- tion of responders during the treatment is important for a tai- lored therapy to each patient.
Dynamic contrast enhanced magnetic resonance imaging (DCE-MRI) is known to enable the most accurate assessment of tumor response in breast cancer after NAC in comparison to other conventional techniques (4-6). An objective response to NAC using DCE-MRI can be assessed by applying Response
J Korean Soc Radiol 2014;71(2):89-96 http://dx.doi.org/10.3348/jksr.2014.71.2.89
Received December 18, 2013; Accepted June 11, 2014 Corresponding author: Young Ha Park, MD
Department of Radiology, St. Vincent’s Hospital, College of Medicine, The Catholic University of Korea, 93 Jungbu-daero, Paldal-gu, Suwon 442-723, Korea.
Tel. 82-31-249-8495 Fax. 82-31-247-5713 E-mail: [email protected]
This is an Open Access article distributed under the terms of the Creative Commons Attribution Non-Commercial License (http://creativecommons.org/licenses/by-nc/3.0) which permits unrestricted non-commercial use, distri- bution, and reproduction in any medium, provided the original work is properly cited.
Purpose: The aim of this study was to compare the diagnostic performances be- tween the Response Evaluation Criteria in Solid Tumors version 1.1 (RECIST 1.1) cri- teria on dynamic contrast enhanced magnetic resonance imaging (DCE-MRI) and positron emission tomography Response Evaluation Criteria in Solid Tumors version 1.0 (PERCIST 1.0) criteria on positron emission tomography/CT (PET/CT) in evaluating the treatment response of neoadjuvant chemotherapy (NAC) in breast cancer patients.
Materials and Methods: We compared MRI and PET/CT in the assessment of tumor response after NAC with the pathological response as the standard reference in 54 breast cancer patients. The tumor response was assessed by using the RECIST 1.1 criteria on DCE-MRI and PERCIST 1.0 criteria on PET/CT. The diagnostic performance of RECIST 1.1 and PERCIST 1.0 criteria was statistically analyzed and compared by receiver operating characteristic (ROC) analysis.
Results: There were 21 responders and 33 non-responders according to the pathol- ogy. The discordant rate with pathological response was 37.0% for RECIST 1.1 and 55.6% for PERCIST 1.0. Twenty six patients (48.1%) were classified as responders in both MRI and PET/CT, but the final pathology showed non-response. In the ROC curve, the area under the curves (AUC) was 0.89 for RECIST 1.1 and 0.79 for PER- CIST 1.0 (p < 0.001).
Conclusion: The RECIST 1.1 criteria on MRI showed the better diagnostic perfor- mance than PERCIST 1.0 criteria on PET/CT for the response assessment of breast cancer after NAC, although there was no statistically significant difference between both (p = 0.15).
Response Evaluation to Neoadjuvant Chemotherapy in Advanced Breast Cancer: Comparison of MRI and Positron Emission
Tomography/CT (RECIST 1.1 versus PERCIST 1.0)
1진행성 유방암 환자에서 신보강 화학요법 후 종양의 반응성 평가:
자기공명영상과 양전자단층촬영의 비교(RECIST 1.1과 PERCIST 1.0)1
Yeong Yi An, MD
1, Sung Hun Kim, MD
2, Young Ha Park, MD
11Department of Radiology, St. Vincent’s Hospital, College of Medicine, The Catholic University of Korea, Suwon, Korea
2Department of Radiology, Seoul St. Mary’s Hospital, College of Medicine, The Catholic University of Korea, Seoul, Korea
MATERIALS AND METHODS
Patients
This retrospective study was approved by our Institutional Re- view Board. The need for an informed consent of patients was waived. A total of 54 patients with locally advanced breast cancer were included in this study between May 2007 and September 2011. The patients ranged in age from 31 to 82 years with a mean age of 49.9 years. All study participants were treated with chemo- therapy based on anthracycline and taxane followed by surgery.
MRI examinations and PET/CT were performed before each first cycle of chemotherapy (baseline) and after the completion of the planned chemotherapy (before surgery) for all study subjects.
Both baseline and preoperative DCE-MRI and PET/CT were also performed in all patients. All patients underwent either breast conserving surgery with axillary nodal dissection and adjuvant radiotherapy or modified radical mastectomy within a month of imaging studies. Clinical characteristics are listed in Table 1.
MRI Imaging Acquisition
The MRI images were acquired with a 1.5-T scanner (Achie- va; Philips Medical Systems, Best, the Netherlands) and a 3.0-T scanner (Magnetom Verio; Siemens Medical Solutions, Erlan- gen, Germany) equipped with a breast coil. The MRI images ac- quired with the Achieva scanner were obtained using the fol- lowing sequences: 1) a sagittal, fat-suppressed, fast spin-echo T2-weighted imaging sequence with a repetition time (TR)/
echo time (TE) of 6000/100, a flip angle of 90°, 30 slices with an field of view (FOV) of 320 mm, a matrix size of 424 × 296, 1 number of excitations (NEX), a slice thickness of 4 mm with a 0.1 mm interslice gap and an acquisition time of 2 minutes 56 seconds, and 2) a pre- and dynamic axial T1-weighted three-di- mensional, fat-suppressed, fast-spoiled gradient-echo sequence with a TR/TE of 6.9/3.4, a flip angle of 12°, a slice thickness of 2.0 mm with no gap and an acquisition time of 1 minute 31 sec- onds. The images were obtained before and at 0, 91, 182, 273, 364, and 455 seconds after a rapid bolus injection of 0.1 mmol/
kg body weight of gadolinium-diethylenetriamine pentaacetic acid (Gd-DTPA) (Magnevist, Schering, Berlin, Germany).
The MRI images produced by Verio scanner were obtained using the following sequences: 1) an axial, turbo spin-echo T2- weighted imaging sequence with a TR/TE of 4530/93, a flip an- Evaluation Criteria in Solid Tumors version 1.1 (RECIST 1.1)
criteria (7, 8), which are based on the anatomical changes of the tumor. Despite the wide acceptance of RECIST 1.1 criteria in the clinical practice, there are limitations for the response assess- ment because chemotherapy induced metabolic changes are known to precede anatomical changes in a tumor (9). The 18F-flu- orodeoxyglucose (FDG) positron emission tomography/comput- ed tomography (PET/CT) is a functional imaging modality which is commonly used in the area of oncology and provides informa- tion regarding the metabolic activity within tumors. The stan- dardized uptake value (SUV) has been used as a quantitative pa- rameter for the response assessment in PET/CT. The standardized response criteria for PET/CT, the so-called PET Response Evalua- tion Criteria in Solid Tumors version 1.0 (PERCIST 1.0) were also proposed by Wahl et al. (10).
DCE-MRI as well as PET/CT are promising methods to assess the tumor response after a NAC. So, the aim of this study was to evaluate the diagnostic performance of both DCE-MRI and PET/CT for the prediction of a pathological response after com- pletion of NAC, applying each response assessment criterion.
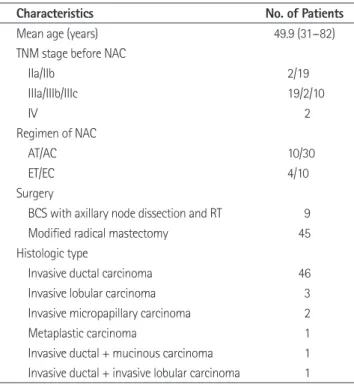
Table 1. Characteristics of 54 Patients
Characteristics No. of Patients
Mean age (years) 49.9 (31--82)
TNM stage before NAC
IIa/IIb 2/19
IIIa/IIIb/IIIc 19/2/10
IV 2
Regimen of NAC
AT/AC 10/30
ET/EC 4/10
Surgery
BCS with axillary node dissection and RT 9
Modified radical mastectomy 45
Histologic type
Invasive ductal carcinoma 46
Invasive lobular carcinoma 3
Invasive micropapillary carcinoma 2
Metaplastic carcinoma 1
Invasive ductal + mucinous carcinoma 1 Invasive ductal + invasive lobular carcinoma 1
Note.-AC = adriamycin-cyclophosphamide combination therapy, AT = Doxorubicin (adriamycin)-taxotere (Docetaxel) combination therapy, BCS = breast conserving surgery, EC = epirubicin-cyclophosphamide combination therapy, ET = epirubicin-doxetaxel combination therapy, NAC = neoadju- vant chemotherapy, RT = radiation therapy
center of the FOV. A region of interest (ROI) was placed over the most intense area of FDG accumulation. The FDG uptake within the ROI was analyzed by the maximum SUV.
Response Assessment by Imaging
The response assessment criteria on both DCE-MRI and PET/CT were summarized in Table 2. DCE-MRI images were reviewed by one radiologist with 3 years experiences. For the DCE-MRI assessment, a maximum of two lesions per organ were assessed as target lesions and the maximal diameters of the target lesions were measured by the revised RECIST 1.1 criteria (8). Patients who had complete or partial response were assigned as responders. Patients with stable and progressive disease were assigned as non-responders.
PET/CT reports were reviewed by a radiologist. A cut-off val- ue of a 30% decrease of the SUV for responders was used for the PET/CT response assessment (10). Patients with complete or partial metabolic response were assigned as responders. Patients with stable and progressive metabolic disease were assigned as non-responders.
Reference Standard
Core-needle biopsies of the primary tumor were performed before the initiation of treatment and the pathological response gle of 80°, 34 slices, a FOV of 320 mm, a matrix size of 576 × 403,
1 NEX, a slice thickness of 4 mm and an acquisition time of 2 minutes 28 seconds, and 2) a pre- and post-contrast, axial T1- weighted flash three-dimensional volumetric interpolated breath hold examination sequence with a TR/TE of 4.4/1.7, a flip angle of 10°, a slice thickness of 1.2 mm with no gap and an acquisi- tion time of 60 seconds. The images were obtained before and at 7, 67, 127, 187, 247, and 367 seconds after a rapid bolus injec- tion of 0.1 mmol/kg body weight of Gd-DTPA (Magnevist, Schering, Berlin, Germany).
PET/CT Imaging Acquisition
PET/CT studies were acquired on combined PET/CT in-line systems, either on Biograph Duo or BiographTruepoint (Sie- mens Medical Solutions, Knoxville, TN, USA). The acquisition time was two to three minutes per bed position. All subjects were in supine position during PET/CT scanning. The CT started at the orbitomeatal line and progressed to the proximal thigh (130 kVp, 80 mAs, and 5 mm slice thickness; 120 kVp, 50 mAs, and 5 mm slice thickness). A PET scan followed immedi- ately for the same body region. CT data were used for attenua- tion correction and images were reconstructed using a stan- dard ordered-subset expectation maximization algorithm. The axial spatial resolution was 6.5 mm respectively 4.5 mm in the
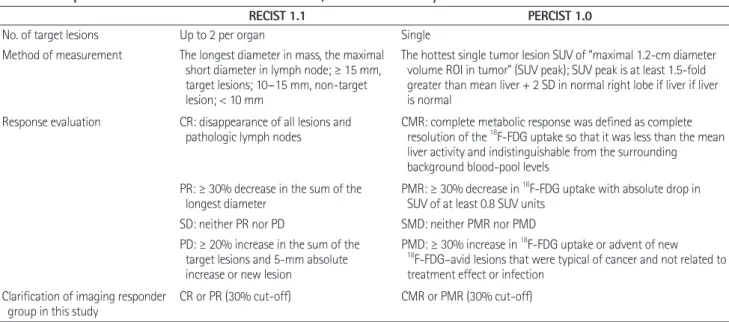
Table 2. The Response Assessment Criteria of DCE-MRI and PET/CT Used in Our Study
RECIST 1.1 PERCIST 1.0
No. of target lesions Up to 2 per organ Single
Method of measurement The longest diameter in mass, the maximal short diameter in lymph node; ≥ 15 mm, target lesions; 10--15 mm, non-target lesion; < 10 mm
The hottest single tumor lesion SUV of “maximal 1.2-cm diameter volume ROI in tumor” (SUV peak); SUV peak is at least 1.5-fold greater than mean liver + 2 SD in normal right lobe if liver if liver is normal
Response evaluation CR: disappearance of all lesions and
pathologic lymph nodes CMR: complete metabolic response was defined as complete resolution of the 18F-FDG uptake so that it was less than the mean liver activity and indistinguishable from the surrounding background blood-pool levels
PR: ≥ 30% decrease in the sum of the
longest diameter PMR: ≥ 30% decrease in 18F-FDG uptake with absolute drop in SUV of at least 0.8 SUV units
SD: neither PR nor PD SMD: neither PMR nor PMD PD: ≥ 20% increase in the sum of the
target lesions and 5-mm absolute increase or new lesion
PMD: ≥ 30% increase in 18F-FDG uptake or advent of new
18F-FDG–avid lesions that were typical of cancer and not related to treatment effect or infection
Clarification of imaging responder
group in this study CR or PR (30% cut-off) CMR or PMR (30% cut-off)
Note.-CMR = complete metabolic response, CR = complete response, DCE-MRI = dynamic contrast enhanced magnetic resonance imaging, PD = progres- sive disease, PERCIST = PET Response Evaluation Criteria in Solid Tumors, PET/CT = positron emission tomography/CT, PMD = progressive metabolic disease, PMR = partial metabolic response, PR = partial response, RECIST = Response Evaluation Criteria in Solid Tumors, ROI = region of interest, SD = stable disease, SMD = stable metabolic disease, SUV = standardized uptake value, 18F-FDG = fluorine 18 fluorodeoxyglucose
pare the diagnostic performance of DCE-MRI and PET/CT for predicting pathologic responders. Area under the curves (AUC) were calculated and compared to summarize the overall perfor- mances. Statistically significant differences between the AUC values are reported in terms of the 95% confidence interval (95%
CI). The two-tailed Mann-Whitney test and Student’s t test was used to assess the predictive role of the parameters among re- sponders and non-responders. All of the statistical analyses were performed with SAS software (version 9.1, SAS Institute Inc., Cary, NC, USA) and MedCalc version 10.1.6 (MedCalc soft- ware, Mariakerke, Belgium). A p value less than 0.05 indicated statistical significance.
RESULTS
Twenty-one out of 54 patients (38.9%) were classified as path- ological responders and thirty-three (61.1%) were classified as pathological non-responders. In their final pathology, twelve out of 54 patients (22.2%) had a complete remission and 9 patients (16.7%) had a pathological partial response.
The percent change of the maximal diameter was moderately correlated with the percent change of the SUVmax (Pearson’s correlation coefficient = 0.44, p = 0.001) (Fig. 1).
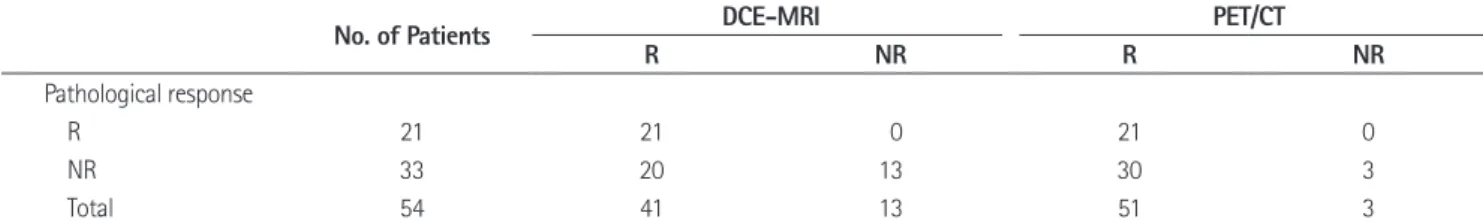
The assessment of tumor response for the use of DCE-MRI and PET/CT correlated with the pathological response are listed in Table 3. The disagreement rate of response assessment was 20/54 (37.0%) between DCE-MRI and pathology and 30/54 (55.6%) between PET/CT and pathology. In 26 cases (48.1%), both DCE-MRI and PET/CT examinations were classified as re- sponders but the final surgical specimen indicated the patholog- ical non-response (Fig. 2).
The sensitivity, specificity, accuracy, PPV, and NPV between both evaluation methods for the final pathological response as- sessment are summarized in Table 4. For the prediction of the to the NAC was determined by evaluating the surgical speci-
men. We reviewed the pathological reports of the gross and mi- croscopic evaluation of the post-chemotherapy surgical speci- mens. The pCR was defined as no recognizable invasive tumor cells encountered [ductal carcinoma in situ (DCIS) may be pres- ent]. A pathologic partial response (pPR) was characterized by microscopic residual cancers or macroscopic residual cancers with 1 cm in diameter (2). Tumors which did not exhibit pCR or pPR pathologic changes were assessed as showing a patho- logic non-response (pNR). pCR and pPR were defined as re- sponder and pNR were defined as a non-responder.
Statistical Analysis
The linear correlation between the different two methods and the pathology was analysed using Pearson’s correlation. The ac- curacy, sensitivity, specificity, and positive and negative predic- tive values (PPV, NPV) of RECIST 1.1 and PERCIST 1.0 were calculated with respect to the response evaluation, using the pathologic results as a reference. Additionally, receiver operating characteristic (ROC) analysis was performed to assess and com-
Fig. 1. The scatter-plot shows the relationship between changes in the maximal diameters with the use of breast MRI and standard uptake values (SUVs) with the use of PET after neoadjuvant chemotherapy.
Note.-PET = positron emission tomography -20
40
0 60
20 80 100 120
∆SUV (%)
-20 0 20 40 60 80 100 120
∆diameter (%)
Table 3. The Assessment of Tumor Responses for the Use of MRI and PET Correlated with the Pathologic Response
No. of Patients DCE-MRI PET/CT
R NR R NR
Pathological response
R 21 21 0 21 0
NR 33 20 13 30 3
Total 54 41 13 51 3
Note.-DCE-MRI = dynamic contrast enhanced magnetic resonance imaging, NR = non-responder, PET/CT = positron emission tomography/CT, R = re- sponder
pathological response, the diagnostic performance of DCE-MRI was better than that of PET/CT. But, the specificity was very low in the application of both criteria.
The AUC was 0.89 for DCE-MRI (p < 0.001) and 0.79 for PET/CT (p < 0.001) (Fig. 3). The sensitivity, specificity, accuracy, PPV, and NPV of DCE-MRI were 81%, 85%, 83%, 77%, and 88%, respectively, when the cut-off value of 61.5% was used. The sensitivity, specificity, accuracy, PPV, and NPV of PET/CT were 81%, 79%, 80%, 71%, and 87%, respectively, when the cut-off value of 83% was used (Table 5). The 95% CI was 0.81−0.98 for RECIST 1.1 criteria and 0.67−0.92 for PERCIST 1.0 criteria.
There was no statistical difference in AUCs between RECIST 1.1 criteria and PERCIST 1.0 criteria (p = 0.15).
DISCUSSION
There are several previous studies which compared DCE- MRI and PET/CT for the response evaluation and assessment of residual lesion after NAC (11-15). There were some discrepan- cies and variations among those data (11-15), which could be
Fig. 3. The ROC curves used to evaluate the pathological response of NAC with DCE-MRI and PET/CT. The AUC value of DCE-MRI (0.89, p <
0.001) was higher than that of PET/CT (0.79, p < 0.001). There was no statistical difference in AUCs between RECIST 1.1 criteria and PERCIST 1.0 criteria (p = 0.15).
Note.-AUC = area under the curves, DCE-MRI = dynamic contrast enhanced magnetic resonance imaging, dmax = the maximal diame- ter, NAC = neoadjuvant chemotherapy, PERCIST = PET Response Evaluation Criteria in Solid Tumors, PET/CT = positron emission to- mography/CT, RECIST = Response Evaluation Criteria in Solid Tumors, ROC = receiver operating characteristic, SUVmax = maximum stan- dardized uptake value
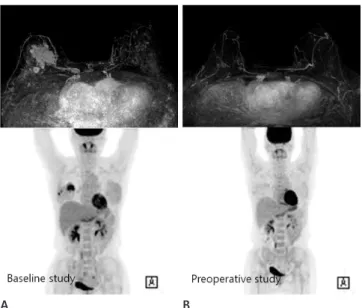
Fig. 2. A 47-year-old woman was diagnosed with invasive lobular carcinoma in the right breast and underwent neoadjuvant chemo- therapy. Pre-chemotherapy (A) and post-chemotherapy (B) maximal intensity projection images of DCE-MRI and PET/CT. Applying RECIST 1.1 and PERCIST 1.0 criteria, this case was classified into responder on both, DCE-MRI and PET/CT examinations. But there was an about 1.9 cm sized residual invasive cancer at the surgical specimen.
Note.-DCE-MRI = dynamic contrast enhanced magnetic resonance imaging, PERCIST = PET Response Evaluation Criteria in Solid Tumors, PET/CT = positron emission tomography/CT, RECIST = Response Evaluation Criteria in Solid Tumors
A B
Table 4. The Diagnostic Performances of DCE-MRI and PET for the Prediction of the Pathologic Response
DCE-MRI PET/CT
Sensitivity (%) 100 100
Specificity (%) 39.4 9.1
Accuracy (%) 63 44.4
PPV (%) 51.2 41.2
NPV (%) 100 100
Note.-DCE-MRI = dynamic contrast enhanced magnetic resonance im- aging, NPV = negative predictive value, PET/CT = positron emission tomog- raphy/CT, PPV = positive predictive value
Table 5. Comparison of Diagnostic Performances of DCE-MRI and PET/CT for Predicting the Pathological Response Via Receiver Oper- ating Characteristics Analysis
DCE-MRI PET/CT
Cut off value (%) 61.5 83
Sensitivity (%) 0.81 0.81
Specificity (%) 0.85 0.79
Accuracy (%) 0.83 0.80
PPV (%) 0.77 0.71
NPV (%) 0.88 0.87
AUC (95% CI) 0.89 (0.81--0.98) 0.79 (0.67--0.92)
p value < 0.001 < 0.001
Note.-AUC (95% CI) = area under the curve (95% confidence interval), DCE-MRI = dynamic contrast enhanced magnetic resonance imaging, NPV
= negative predictive value, PET/CT = positron emission tomography/CT, PPV = positive predictive value
0.00 0.50
0.25 0.75 1.00
Sensitivity
0.00 0.25 0.50 0.75 1.00
1-specificity ROC curves for comparisons
ROC curve (area) dmax (0.8947) SUVmax (0.7937)
sponse as reference standard. They used a cut-off value of great- er than 30% decrease in the maximal short diameter on MRI and of greater than 50% decrease in the SUVmax on PET/CT for responders. Similar to our study results, the change of the di- ameter of MRI correlated moderately with the change of the SUV on PET/CT. But, contrary to our study results, their results showed that the PET/CT had a higher sensitivity than the MRI although it was not statistically significant. For the prediction of the pathological response, the MRI was proven to be a more specific modality than PET/CT.
Recently, Tateishi et al. (15) compared the parameters of DCE- MRI and PET/CT at baseline and after two cycles of NAC. The sensitivity, specificity and accuracy to predict pCR with RECIST 1.1 criteria were 45.5%, 85.5%, and 82.4%, respectively and with PERCIST 1.0 criteria 70.4%, 95.7%, and 90.8%, respectively. In their study, the sensitivities of both response criteria were lower, but both, specificities and accuracies were higher than in our re- sults. Additionally, they evaluated the usefulness of various pre- dictive imaging parameters of DCE-MRI and PET/CT. Of the imaging parameters, the sensitivities of % SUVmax, % kep, and
% AUC90 (66.7%, 51.7%, and 50%, respectively) were not strong enough but the specificities (96.4%, 92%, and 95.2%, respective- ly) were high for a stratification of pathological responders in breast cancer.
In our study, the response rates of DCE-MRI and PET/CT were 87% and 75.9%, respectively. The pCR rate was 22.2%
which is similar with reported results (2, 16, 17) and the patho- logical response rate was 38.9%. Both DCE-MRI and PET/CT showed sensitivities and NPV of 100% for predicting the patho- logical response. Contrary to its high sensitivity and NPV, the specificity and PPV were very low. DCE-MRIs using RECIST 1.1 criteria showed better diagnostic performances than PET/CT using PERCIST 1.0 criteria in ROC analysis, but the accuracy of both diagnostic criteria was insufficient to predict the pathologi- cal response and residual lesion after NAC. Both examinations classified 26 of 54 study subjects (48.1%) as responders but the fi- nal pathology showed the non-response (Fig. 2). So, clinical deci- sion based on both DCE-MRI and PET/CT examinations should be made prudently with these limitations in mind. Neither DCE- MRI nor PET/CT could replace the pathologic examination after NAC to determine a pCR in our study.
This present study has several limitations: 1) This is a retro- explained by a significant difference in study population, data
analysis and methodology. Chen et al. (11) reported their initial experience using both MRI and PET/CT to monitor responses and to assess residual lesions in 16 lesions of 15 patients with lo- cally advanced breast cancer (LABC) in comparison to clinical breast examination and final pathology. In their correlated analy- sis of percent tumor size or SUV reduction with pathologic re- sponse, the PET/CT was more accurate in the prediction of the pNR in contrast to our study results. But, the complete response by MRI correlated well with the pathologic response. Recently, Choi et al. (12) estimated the predictive role of PET/CT and compared PET/CT with other modalities (including ultrasound and MRI) in 45 patients with breast cancer who were treated by NAC. They used RECIST 1.1 criteria for the assessment of tu- mor response for MRI and applied a cut off value of 30% for re- sponders. For PET/CT examinations, they defined a response as a greater than 50% decline of SUVmax on PET/CT using the Research and Treatment of Cancer guideline. The idea was that the PET/CT may more accurately predict the pCR because of the functional imaging ability for viable tumor cells compared with the anatomic tumor size. However, the AUC in MRI were higher (0.91) than in ultrasonography (0.83) and PET/CT (0.62) in the ROC analysis, which is similar to our result. They ex- plained the inferiority of PET/CT to MRI due to the lower ana- tomic discriminative resolution of PET/CT than of MRI. Also, the appropriate SUVmax cut-off value for the prediction of a pCR was undetermined. The clinician’s experience in reading PET/CT has had a lack of sufficiency compared to the MRI.
Dose-Schwarz et al. (13) evaluated the PET/CT for the assess- ment of residual lesions in 99 patients after primary chemother- apy of LABC in comparison with conventional imaging includ- ing MRI. In their study, FDG-PET/CT did not provide an accurate assessment of residual tumor after chemotherapy for subjects with breast cancer. Although all imaging modalities had distinct limitations in the assessment of residual lesions when compared with the histopathology, the MRI offered the highest sensitivity similar to our result. They explained the low detec- tion rate of PET/CT due to 1) the limited spatial resolution of FDG-PET/CT and 2) the ‘metabolic stunning’ of the residual vi- able tumor after chemotherapy. Park et al. (14) compared MRI and PET/CT in the assessment of tumor response to NAC for subjects with breast cancer in 32 patients with the pathologic re-
dates of National Surgical Adjuvant Breast and Bowel Project Protocols B-18 and B-27. J Clin Oncol 2008;26:
778-785
4. Partridge SC, Gibbs JE, Lu Y, Esserman LJ, Sudilovsky D, Hylton NM. Accuracy of MR imaging for revealing residual breast cancer in patients who have undergone neoadju- vant chemotherapy. AJR Am J Roentgenol 2002;179:1193- 1199
5. Londero V, Bazzocchi M, Del Frate C, Puglisi F, Di Loreto C, Francescutti G, et al. Locally advanced breast cancer: com- parison of mammography, sonography and MR imaging in evaluation of residual disease in women receiving neoad- juvant chemotherapy. Eur Radiol 2004;14:1371-1379 6. Yeh E, Slanetz P, Kopans DB, Rafferty E, Georgian-Smith D,
Moy L, et al. Prospective comparison of mammography, so- nography, and MRI in patients undergoing neoadjuvant chemotherapy for palpable breast cancer. AJR Am J Roent- genol 2005;184:868-877
7. Therasse P, Eisenhauer EA, Verweij J. RECIST revisited: a re- view of validation studies on tumour assessment. Eur J Cancer 2006;42:1031-1039
8. Eisenhauer EA, Therasse P, Bogaerts J, Schwartz LH, Sar- gent D, Ford R, et al. New response evaluation criteria in solid tumours: revised RECIST guideline (version 1.1). Eur J Cancer 2009;45:228-247
9. Kang H, Lee HY, Lee KS, Kim JH. Imaging-based tumor treatment response evaluation: review of conventional, new, and emerging concepts. Korean J Radiol 2012;13:371- 390
10. Wahl RL, Jacene H, Kasamon Y, Lodge MA. From RECIST to PERCIST: Evolving Considerations for PET response criteria in solid tumors. J Nucl Med 2009;50 Suppl 1:122S-150S 11. Chen X, Moore MO, Lehman CD, Mankoff DA, Lawton TJ,
Peacock S, et al. Combined use of MRI and PET to monitor response and assess residual disease for locally advanced breast cancer treated with neoadjuvant chemotherapy.
Acad Radiol 2004;11:1115-1124
12. Choi JH, Lim HI, Lee SK, Kim WW, Kim SM, Cho E, et al. The role of PET CT to evaluate the response to neoadjuvant che- motherapy in advanced breast cancer: comparison with ul- trasonography and magnetic resonance imaging. J Surg Oncol 2010;102:392-397
spective study with a small sample size. So, the statistical power was limited as a consequence. The statistical power will be great- er if the sample size is increased in future multicenter studies in order to assess the true accuracy of imaging techniques in NAC setting. 2) Inter/intraobserver variability, the reproducibility of diameter and the SUV measurement of target lesions were limit- ed. An automatic measurement using emerging various comput- er aided diagnosis programs might overcome this. 3) The cut-off value of each imaging criterion was arbitrary. 4) The main prob- lem in our study was that there are no widely accepted criteria for the response evaluation in the pathology. Especially, whether DCIS was or was not included in the definition of pCR might partly explain the difference observed in the DCE-MRI accuracy.
With these limitations, it is the first investigation to compare RECIST 1.1 criteria based on DCE-MRI measurements and PERCIST 1.0 criteria based on PET/CT measurements, which are both currently used as standard imaging response criteria in the clinical practice. Further studies or trials with a larger num- ber of eligible study subjects are necessary to validate the ability of both, anatomical and functional response criteria for predict- ing the treatment benefit during NAC.
The conclusion of this study after summarizing all those re- sults is that the MRI may be the best method for the response monitoring and assessment of residual lesions after NAC, al- though there was no statistically significant difference between the two (p = 0.15). Also, PET/CT is not superior to DCE-MRI.
Despite its simplicity of both, RECIST 1.1 and PERCIST 1.0 cri- teria for the clinical use, the response assessment applying RE- CIST 1.1 and PERCIST 1.0 criteria had its limitations for an ac- curate assessment of residual tumor after NAC.
REFERENCES
1. Chia S, Swain SM, Byrd DR, Mankoff DA. Locally advanced and inflammatory breast cancer. J Clin Oncol 2008;26:
786-790
2. Fisher ER, Wang J, Bryant J, Fisher B, Mamounas E, Wol- mark N. Pathobiology of preoperative chemotherapy:
findings from the National Surgical Adjuvant Breast and Bowel (NSABP) protocol B-18. Cancer 2002;95:681-695 3. Rastogi P, Anderson SJ, Bear HD, Geyer CE, Kahlenberg
MS, Robidoux A, et al. Preoperative chemotherapy: up-
namic contrast-enhanced MR imaging--prospective assess- ment. Radiology 2012;263:53-63
16. Bonadonna G, Valagussa P, Brambilla C, Ferrari L, Moliterni A, Terenziani M, et al. Primary chemotherapy in operable breast cancer: eight-year experience at the Milan Cancer Institute. J Clin Oncol 1998;16:93-100
17. Bear HD, Anderson S, Smith RE, Geyer CE Jr, Mamounas EP, Fisher B, et al. Sequential preoperative or postopera- tive docetaxel added to preoperative doxorubicin plus cy- clophosphamide for operable breast cancer: National Sur- gical Adjuvant Breast and Bowel Project Protocol B-27. J Clin Oncol 2006;24:2019-2027
13. Dose-Schwarz J, Tiling R, Avril-Sassen S, Mahner S, Lebeau A, Weber C, et al. Assessment of residual tumour by FDG- PET: conventional imaging and clinical examination follow- ing primary chemotherapy of large and locally advanced breast cancer. Br J Cancer 2010;102:35-41
14. Park JS, Moon WK, Lyou CY, Cho N, Kang KW, Chung JK. The assessment of breast cancer response to neoadjuvant che- motherapy: comparison of magnetic resonance imaging and 18F-fluorodeoxyglucose positron emission tomography.
Acta Radiol 2011;52:21-28
15. Tateishi U, Miyake M, Nagaoka T, Terauchi T, Kubota K, Kinoshita T, et al. Neoadjuvant chemotherapy in breast can- cer: prediction of pathologic response with PET/CT and dy-
진행성 유방암 환자에서 신보강 화학요법 후 종양의 반응성 평가:
자기공명영상과 양전자단층촬영의 비교 (RECIST 1.1과 PERCIST 1.0)1
안영이
1· 김성헌
2· 박영하
1목적: 유방암 환자에서 신보강 화학요법 후 반응성을 평가하기 위해 자기공명영상에서 측정한 Response Evaluation Criteria in Solid Tumors version 1.1 (이하 RECIST 1.1) 기준과 positron emission tomography Response Evaluation Criteria in Solid Tumors version 1.0 (이하 PERCIST 1.0) 기준을 이용하여 자기공명영상과 양전자방출단층촬영술의 진단적 수행 능력을 비 교하고자 하였다.
대상과 방법: 신보강 화학요법을 받은 54명의 유방암 환자를 대상으로 조직학적 반응도를 비교 표준으로 하여, 자기공명 영상과 양전자방출단층촬영술의 반응 평가를 비교하였다. 자기공명영상에서는 개정된 RECIST 1.1 기준을, 양전자방출단층 촬영에서는 PERCIST 1.0 기준을 사용하여 종양의 반응을 평가하였다. 각각의 진단적 수행 능력을 알아보기 위해 receiver operating characteristic (이하 ROC) 분석법을 이용하여 통계적으로 분석하였다.
결과: 수술 후 조직에서 21명의 환자가 조직학적 반응군으로, 나머지 33명은 조직학적 비반응군으로 분류되었다. RECIST 1.1 기준과 PERCIST 1.0 기준의 조직학적 반응과 불일치율은 각각 37%, 55.6%였다. 26명의 환자에서(48.1%) 두 영상 검사에서 모두 반응군으로 분류하였으나 최종 조직표본에서는 잔류병변이 있었다. ROC 분석에서 RECIST 1.1과 PERCIST 1.0 기준의 곡선 아래 면적은 각각 0.89(p < 0.001)와 0.79(p < 0.001)였다.
결론: 유방암 환자에서 신보강 화학요법 후 종양의 반응을 평가하는 데 있어서 자기공명영상의 진단능이 양전자단층촬영 술보다 높았으나, 통계적으로 유의한 차이는 없었다(p = 0.15).
1가톨릭대학교 의과대학 성빈센트병원 영상의학과, 2가톨릭대학교 의과대학 서울성모병원 영상의학과