Comparison of Full-Field Stresses around an Inclined Crack Tip by Using Fringe Data of Finite Element Method with Photoelastic
Experiment
Tae Hyun Baek*✝, Myung Soo Kim** and Lei Chen***
Abstract Abrupt change of cross-section in mechanical parts is one of significant causes of structural fracture. In this paper, a hybrid method is employed to analyze the stress distribution of a discontinuous plate. The plate with an inclined crack is utilized in our experiment and the stress field in the vicinity of crack tip is calculated through isochromatic fringe order of given points. This calculation can be made handy through least-squares method integrated with complex power series representation(Laurent series) implemented on a computer program for high-speed processing. In order to accurately compare calculated results with experimental ones, both of actual and regenerated photoelastic fringe patterns are doubled and sharpened by digital image processing. The experiment results show that regenerated patterns obtained by hybrid method are quite comparable to actual patterns.
Keywords: Photoelasticity, Inclined Crack, Complex Stress Function, Digital Image Processing
Received: September 10, 2009, Revised: December 7, 2009, Accepted: December 14, 2009. *School of Mechanical and Automotive Engineering, Kunsan National University, #68 Miryong-dong, Gunsan, Jeonbuk, 573-701, Korea,
**School of Electronics and Information Engineering, Kunsan National University, #68 Miryong-dong, Gunsan, Jeonbuk, 573-701, Korea, ***Department of Mechanical Engineering, Graduate School, Kunsan National University,
#68 Miryong-dong, Gunsan, Jeonbuk, 573-701, Korea, ✝Corresponding Author: [email protected] Journal of the Korean Society
for Nondestructive Testing Vol. 29, No. 6 (2009. 12)
1. Introduction
The occurrence of cracks in mechanical parts makes the parts discontinuous and causes the stress around them much higher than those in the region far away from themselves. The discontinuous parts may fracture at the stress which is much lower than the ultimate strength.
Even though their size may be very small, it should be a concern in the design.
Generally, engineering problems with irregular geometries and the boundary conditions are very complicated. Thus, mathematical methods become quite cumbersome and experimental methods are usually applied for them. Several methods can be found in the
literature ranging from FEM, the use of photoelastic-data, hybrid method and other various numerical and experimental procedures (Kobayshi, 1993; Pilkey, 2008).
In general case, however, it is difficult to measure directly the mechanical quantities very near the region of geometric discontinuity. In such case, the hybrid method which combines the advantages of mathematical analysis and experimental measurements far away from them is one of good alternatives(Baek, 2006; Baek and Panganiban, 2007).
In this paper, the hybrid method is employed to calculate full-field stress around an inclined crack in uni-axially loaded finite-width tensile plate and to compare with previous experimental
) )(
sin 2(cos
−1
− +
+
= j i j i j
j a α μ α e ζ e ζ
ω α α
(1a)
( )
{ }
(
α μ α)
α μ α ω
ζ ω
α
sin cos
sin
cos 2
2 2
j j j
j i
j a
a e
+ +
−
= ±
(1b)
)] (
) ( )
( ) Re[ (
2
2 2 2 2 2 1 1 2 1
1 ω ξ
ξ μ ψ ξ ω
ξ μ φ
σ ′
+ ′
′
= ′
x (2a)
)] (
) ( ) (
) Re[ ( 2
2 2
2 1
1
1 ω ξ
ξ ψ ξ ω
ξ σ φ
′ + ′
′
= ′
y (2b)
)] (
) ( )
( ) Re[ (
2
2 2 2 2 1 1
1 1 ω ξ
ξ μ ψ ξ ω
ξ μ φ
τ ′
+ ′
′
− ′
xy= (2c)
0 )
2
( 12 66 2 22
11 4+ S +S +S =
S μ μ (3)
∑
=−= m
m k
k k 1 1)
(ζ βζ
φ (k≠0) (4a)
) (
)
( 2 m 2 k 2k
m k
k
kBζ β Cζ
β ζ
ψ
∑
−
=
+
= (4b)
2 2
1 2 2
2 1
2 ,
μ μ
μ μ μ
μ μ μ
−
= −
−
= − C
B (5)
and numerical results(Rhee et al., 1996;
Murakami, 1987). In order to conveniently compare those values with each, both actual and regenerated photoelastic fringe patterns are doubled and sharpened by digital image processing(Baek and Lee, 1994).
2. Theory Formulation
2.1 Equations of Hybrid Method
The present technique employs general expressions for the stress functions with traction-free conditions which are satisfied at the geometric discontinuity using conformal mapping and analytical continuation.
Fig. 1 Conformal mapping of an inclined crack
As shown in Fig. 1, the inverse of the mapping function , namely , maps the geometry of interest from the physical z-plane into the -plane( ). For isotropic materials, the conformal transformations between unit circle in the -plane and the crack in the z-plane of length L = a/2 in Fig. 1 are given by (Savin, 1961)
where i = . The branches of the square root of eqns. (1) are chosen so that ≥
(j=1,2).
Then, general stress functions can be expressed in the –plane. In the absence of body forces and rigid body motion, the stresses under isotropy plane can be written as(Gerhardt, 1984;
Rhee, 1995)
where ′ , ′ ,
′ , and ′ . Complex material parameters (j=1, 2) are the roots of the characteristic eqn. (3) for an isotropic material under plane stress.
where (i, j=1,2,6) are the elastic compliances.
The two complex stress functions φ() and ψ() are related to each other by the conformal mapping and analytic continuation. For a traction-free physical boundary, the two functions within sub-region of Fig. 1 can be written as Laurent expansions, respectively(Gerhardt, 1984;
Rhee, 1995)
Complex quantities B and C depend on material properties and are defined as
The coefficients of eqns. (4) are where bk and ck are real numbers. In addition to satisfying the traction-free conditions on the crack boundary , the stresses of eqns. (2)
} ]{
[ }
{σ = V β (6)
1
1 1 1
1 '
1 1
1 1
1 2 2
2 '
2 2
( , ) ( 1) (2 )(Re(( ) ( )
( )
( ) )
k
i i
k k
i
V i j k
B C
μ ξ ω ξ
ξ ξ
μ ω ξ
− − −
− − −
−
= − +
− + (7a)
1
1 1 1
1 '
1 1
1 1
1 2 2
2 '
2 2
( , 1) ( 1) (2 )(Im(( ) ( )
( )
( ) )
k
i i
k k
i
V i j k
B C
μ ξ ω ξ
ξ ξ
μ ω ξ
− − −
− − −
−
+ = − − +
− − (7b)
2 2
2
} 2
2 { ⎭⎬⎫
⎩⎨
=⎧
⎭ +
⎬⎫
⎩⎨
⎧ −
t Nf
xy y
x σ τ σ
σ (9)
) 2 cos( N A I I
IR= L− D = π (10)
⎪⎭
⎪⎬
⎫
⎪⎩
⎪⎨
⎧
∇ Σ +
∇ Σ
∇ Σ +
∇
− Σ
= | | | |
|
|
| 1 |
y x
y
A x
T (11)
associated with these stress functions φ() and ψ() satisfy equilibrium and compatibility.
Combining eqns. (1) through (5) gives the stress through regions of Fig. 1 in matrix form
where , , and is a rectangular coefficient matrix whose size depends on material properties, positions and the number of terms m of the power series expansions of eqns. (4).
2.2 Stress Intensity Factor
As shown in Fig. 2, the crack lies along the x'-axis in the physical z-plane and (r, θ) are the local polar coordinates measured from the crack tip. When θ = 0 and r << a, where a is the half of crack length, the stress intensity factor of Mode I and Mode II is determined as follows:
Fig. 2 Coordinate system of the inclined crack
r
KI =σy' 2π (8a)
r
KII =τx'y' 2π (8b)
where ′ and ′′ are obtained from eqn. (6) and coordinate transformation.
2.3 Optical Theory for Photoelasticity
The stress-optic law relates in-plane principal stresses as , where N is the isochromatic fringe order, is the photoelas- ticity constant and t is the thickness of the specimen. By substituting the stresses into this equation, one obtains the basic relationship between isochromatic fringe order and the in-plane stress components
The techniques of fringe doubling and sharpening(Baek and Lee, 1994) were employed in order to obtain accurate isochromatic fringe patterns. For fringe doubling technique, two images are used as
where IL and ID are the light intensities of the light-field and dark-field isochromatic fringe patterns, respectively. The sharpening technique described here comes from the proportions of the gradient vector(Baek and Lee, 1994). To sharpen photoelastic fringes, measured changes in the gradient direction throughout an area are used.
The operator T, which is used for sharpening fringes, is given in eqn. (11)
where A is a proportionality constant, ▽X and
▽Y are x and y components of the photoelastic fringe gradient vector, respectively.
Fig. 3 Uni-axially loaded finite-width tensile plate containing an inclined crack
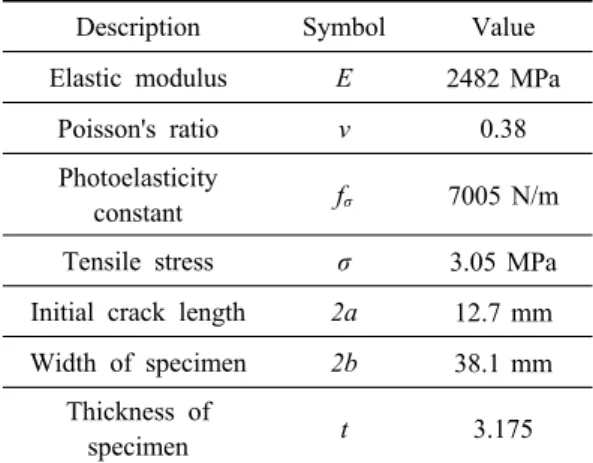
Table 1 Parameters of specimen
Description Symbol Value
Elastic modulus E 2482 MPa
Poisson's ratio ν 0.38
Photoelasticity
constant fσ 7005 N/m
Tensile stress σ 3.05 MPa
Initial crack length 2a 12.7 mm Width of specimen 2b 38.1 mm
Thickness of
specimen t 3.175
(a) Dark field (b) Light field
(c) Doubled pattern (d) Sharpened pattern Fig. 4 Experiment fringe patterns of 45° inclined
crack
3. Experiment and Analysis
3.1 Photoelasticity Experiment
In this experiment, a PSM-11) plate shown in Fig. 3 is subjected to the uni-axial tension. The degree of inclined crack is 45° and the width of crack is 0.5 mm. The isochromatic fringe order of given points will be obtained along B-C line and C-D line with the help of FEM software.
The material prosperities and dimensions of specimen are given by Table 1.
In order to obtain accurate fringe data, fringes are doubled and sharpened by using the digital image program. Fig. 4 shows the original light-field isochromatic fringe and doubled fringe pattern of the loaded tensile plate containing a central crack.
1) Photoelastic Division, Measurement Group, Inc., Raleigh, NC 27611, USA
3.2 FEM Analysis
As shown in Fig. 5, a common FEM software ABAQUS is used to simulate the tensile loaded finite-width plate.
The specimen is discretized into two kinds of elements, CPS3(3-node linear plane stress triangle element) and CPS4R(4-node bilinear plane stress quadrilateral element). The von Mises stress distribution of ABAQUS model is shown as Fig. 6.
In order to obtain the input data of hybrid method, the isochromatic fringe order of given points on B-C line and C-D line are necessary.
According to stress-optic law, the value of fringe order can be expressed by the stresses of those points.
Fig. 5 FEM model of specimen in ABAQUS
Fig. 6 ABAQUS discretization of the load tensile plate of Fig. 3
(a) Dark field (b) Light field
(c) Doubled pattern (d) Sharpened pattern Fig. 7 Regenerated fringe patterns of 45° inclined
crack
3.3 Hybrid Method Analysis
For given isochromatic fringe orders and a predetermined value of “m” in eqns. (4), coefficients {} are obtained by nonlinear least-sqaures(Sanford, 1980). Then, stress components are calculated by substituting {} into eqn. (6). To show the physical effect, full fringes are reconstructed using the results of {} obtained from the analyses, as shown in the right halves of Fig. 7.
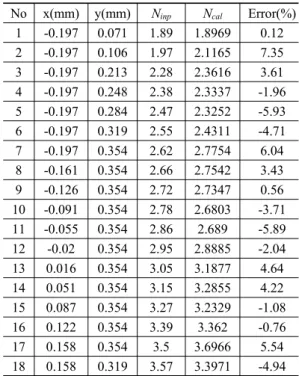
A quantitative check on the quality of fit between input and calculated isochromatic fringe order of given points shown in Table 2 is made by using a simple type of statistical parameter, such as the standard deviation(SD) of percentage error. For a predetermined point, the input fringe order (Ninp) is obtained by FEM analysis. The calculated fringe order (Ncal) is also determined at the same point by hybrid method. Comparison of input and calculated data are given in the Table 2.
The percentage error E between the calculated and the input fringes at any point is
(%) ) 100
( − ×
=
inp inp cal
N N
E N (12)
For “n” data points, the standard deviations of the percentage error can be calculated from
⎥⎥
⎦
⎤
⎢⎢
⎣
⎡ ⎟
⎠
⎜ ⎞
⎝
− ⎛
= −
∑ ∑
= =
n i
n i
i
i E
E n SD n
1
2
1
2 1
1
1 (13)
When number of terms m=1, the value of standard deviation SD is 4.3%.
The mixed-mode stress intensity factors of inclined crack are very important parameters to analyze the stress distribution around the crack tip. Here, stress intensity factors are obtained by hybrid method, FEM and theoretical formulation shown as Table 3.
Table 2 Comparison of input and calculated fringe orders
No x(mm) y(mm) Ninp Ncal Error(%) 1 -0.197 0.071 1.89 1.8969 0.12 2 -0.197 0.106 1.97 2.1165 7.35 3 -0.197 0.213 2.28 2.3616 3.61 4 -0.197 0.248 2.38 2.3337 -1.96 5 -0.197 0.284 2.47 2.3252 -5.93 6 -0.197 0.319 2.55 2.4311 -4.71 7 -0.197 0.354 2.62 2.7754 6.04 8 -0.161 0.354 2.66 2.7542 3.43 9 -0.126 0.354 2.72 2.7347 0.56 10 -0.091 0.354 2.78 2.6803 -3.71 11 -0.055 0.354 2.86 2.689 -5.89 12 -0.02 0.354 2.95 2.8885 -2.04 13 0.016 0.354 3.05 3.1877 4.64 14 0.051 0.354 3.15 3.2855 4.22 15 0.087 0.354 3.27 3.2329 -1.08 16 0.122 0.354 3.39 3.362 -0.76 17 0.158 0.354 3.5 3.6966 5.54 18 0.158 0.319 3.57 3.3971 -4.94
Table 3 Comparison of stress intensity factors Stress Intensity
Factor Hybrid FEM* Equation**
a KI
π σ0
0.492 0.526 0.532
I II
K
K 1.062 1.006 1.000
* See ABAQUS Analysis User’s Manual, ABAQUS Inc., Providence, RI 02909, USA.
** See Reference (Anderson, 1995)
4. Discussion and Conclusions
In this study, we use only isochromatic data with their respective coordinates to easily obtain stress field distribution and stress intensity factor at the geometric discontinuity. The figures and table presented above show that the hybrid method employed in this paper is an efficient method for calculating stress field for a discontinuous isotropic tensile-loaded plate. The stress of interest region is calculated through isochromatic fringe order of given points. This calculation has been made handy through least-squares method integrated with complex power series representation(Laurent series) implemented on a computer program for high-speed processing. The advantages of this method underscore the use of relatively small amount of data which are conveniently determined from the fringe loops.
Excellent results were obtained with number of terms m=1. Considering the experimental and calculated errors, we can see that the technique is effective and reliable. The use of hybrid method has a potential future and the results attained in this study can be used for bench mark test in theoretical simulation and experiment.
References
Anderson, T. L. (1995) Fracture Mechanics Fundamentals and Applications, 2nd Edition. CRC Press Inc., pp. 53-64
Baek, T. H. (2006) Photoelastic Stress Analysis by Use of Hybrid Technique and Fringe Phase Shiting Method, Journal of Experimental Mechanics, Vol. 21, No. 1, pp. 87-95
Baek, T. H., Panganiban, H. and Chung, T. J (2007) A Hybrid Photoelastic Stress Analysis around Holes in Tensile-Loaded Plates Using
Isochromatic Data and Finite Element Method, Lecture Series on Computer and Computational Sciences, Vol. 8, pp. 21-25
Baek, T. H. and Lee, J. C. (1994) Development of Image Processing for Photoelastic Fringe Analysis, Transactions of KSME (in Korean), Vol. 18, No. 10, pp. 2577-2584
Gerhardt, G. D. (1984) A Hybrid/Finite Element Approach for Stress Analysis of Notched Anisotropic Materials, ASME Journal of Applied Mechanics, Vol. 51, pp. 804-810
Kobayshi, A. S. (1993) Handbook on Experimental Mechanics, Second Revised Edition, Society for Experimental Mechanics, VCH Publishers, Inc., New York
Murakami, Y. (1987) Stress Intensity Factors, Vol. I & Vol. II, Pergamon Books Ltd., USA
Pilkey, W. D. and Pilkey, D. F. (2008) Peterson’s Stress Concentration Factors, John Wiley & Sons, Inc., USA
Rhee, J., He, S., and Rowlands, R. E. (1996) Hybrid Moire-Numerical Stress Analysis around Cutouts in Loaded, Experimental Mechanics, Vol.
36, No. 4, pp. 379-387
Rhee, J. (1995) Geometric Discontinuities in Orthotropic Composites, Ph. D Dissertation, Department of Engineering Mechanics and Astro- nautics, University of Wisconsin-Madison, USA
Sanford, R. J. (1980), Application of the Least Squares Method to the Photoelastic Analysis, Experimental Mechanics, Vol. 20, No. 6, pp.
192-197
Savin, G. N. (1961) Stress Concentration around Holes, Pergamon Press, New York, USA