J F E S
Journal of Forest and Environmental Science
Journal of Forest and Environmental Science Vol. 34, No. 1, pp. 31-45, February, 2018 https://doi.org/10.7747/JFES.2018.34.1.31
Tree Diversity, Distribution and Population Structure of a Riparian Forest from Certain Zones along the Dikhu River in Nagaland, India
Devlin Leishangthem and Maibam Romeo Singh*
Centre for Biodiversity Studies, Department of Botany, Nagaland University, Lumami-798627, Nagaland, India
Abstract
At present the biodiversity of the riparian forest is under threat due to various anthropogenic pressures. Hence study was conducted along the three unprotected zones of riparian forest in Dikhu river, Nagaland, north-east India in order to compared the diversity, distribution and population structure of riparian trees. In each zone 100×100 m2 plot were marked and subdivided into 20 plots of 10×10 m2. 10 plots on each side of the river were taken randomly covering 0.02 ha. Only tree with dbh ≥10 cm and dbh above 1.5 m above ground level were recorded as individual species.
A total of 29 tree species belonging to 18 families were recorded from the three zones of the river. Tree species richness was highest at the middle zone (19) followed by upper (14) and lower zone (7). The most abundant species and family recorded at upper, middle and lower zones were Melia azaderach of Euphorbiaceae (380 stems ha-1), Terminalia chebula of Euphorbiaceae (432.5 stems ha-1) and Duabanga grandiflora of Lythraceae (365 stems ha-1) respectively. The ranges of diversity indices observed in the three zones were: Shannon-Wiener index (1.25-0.73), Simpson diversity index (0.42-0.93), Evenness index (0.47-0.37) and Index of co-dominance (0.75-0.94). Rest of other indices were also estimated and compared.
Distribution of trees shows the contagious pattern common in the upper and middle zones and regular in the lower zone. The girth size class analysis demonstrated that the riparian forest is in less mature succession stage. This study emphasize the need for management and conservation of riparian forest by developing policy to declare the riparian zone as protected area to prevent further degradation and loss of biodiversity from these unregulated zones along the river.
Key Words: riparian trees, unprotected zone, tropical forest, Eastern Himalaya, Dikhu river
Received: September 14, 2017. Revised: December 4, 2017. Accepted: January 22, 2018.
Corresponding author: Maibam Romeo Singh
Centre for Biodiversity Studies,Department of Botany, Nagaland University, Lumami-798627, Nagaland, India Tel: 91-9612211169, Fax: +91-0369-2268248, E-mail: [email protected]
Introduction
Riparian plant communities along the rivers are dynam- ic, species rich (Nilsson 1991) and sensitive to anthro- pogenic interference (Malanson 1993) resulting distur- bance adapted communities. Plant communities in these systems are likely to be affected both by longitudinal i.e. up- stream-downstream (Vannotte et al. 1980; Noss 1983) and transversal i.e. stream-floodplain or floodplain-basin
(Newbold et al. 198l) linkages for species recruitment and diversity. The spatial heterogeneity resulting from geo- morphological processes is viewed as one of the major caus- es of high species richness (Ferreira and Stohlgren 1999).
As a consequence of the shifting mosaic of landforms and communities resulting from natural disturbance (Whittaker 1977), high levels of species richness are usually found along rivers. Studies on species richness patterns in river corridors indicated that total species richness in a river is
maximum in the middle reaches (Vannotte et al. 1980).
Species richness patterns in the riparian corridor change in response to the dynamics of flood disturbance (Renofalt et al. 2005) but regular moderate flooding is required to sus- tain high levels of diversity in riparian ecosystems (Naiman and Decamps 1997). Tree species diversity is an important aspect of forest ecosystem diversity (Rennolls and Laumonier 2000; Tchouto et al. 2006) and is also fundamental to trop- ical forest biodiversity (Evariste et al. 2010). The rapid in- ventory of tree species that provides information on diver- sity will represent an important tool to enhance our ability to maximize biodiversity conservation that results from defor- estation and degradation (Baraloto et al. 2013). Tree species diversity in tropical forests differs greatly from location to location mainly due to variation in biogeography, habitat and disturbance (Neumann and Starlinger 2001; Padalia et al. 2004). Plant diversity changes are compared in con- junction with human impacts. Certain changes are easy to predict, at least qualitatively. Population sizes when reduced may have deleterious consequences (Sukumar et al. 1992).
Human activities have been drastically transformed the ma- jor rivers of Asia such as Indus, Ganges and Yangtze (Dudgeon 2000) and are now categorized as threatened ecosystems (Johnsingh and Joshua 1989; Dudgeon 1992) due to the loss of species richness. In India, the phytodiver- sity of riparian forests are under threat due to anthro- pogenic disturbances such as deforestation, overgrazing and land reclamation (Gopal 1988). The Ganga river has lost 80% of its original forest cover in its basin (Smakhtin et al.
2007). Riparian forests adjoining stream and river banks have been almost entirely eliminated outside the protected areas (Gadgil 2004). Moreover, there has been no quantita- tive estimation of riparian diversity in Indian rivers. In India, few quantitative plant biodiversity inventories were investigated in riparian forests of Chalakkudy river (Bachan 2003); Valapattanam river (Sreedharan 2005) of Kerala and Cauvery river of Tamil Nadu (Sunil et al. 2010) and Meenachil river basin in Kerala (Vargashe 2014). Dikhu river is the important river of Nagaland, a state in the north- east corner of India bordering the Indo-Myanmar bio- diversity hotspot which is under the eastern Himalayan region. The riparian forest along the Dikhu river remains relatively unprotected from poor agricultural practices by way of shifting cultivation, residential and commercial con-
struction, rock quarrying, forest fire, fodder collection for feeding animals and logging. These result in accelerating both onsite and offsite degradation due to erosion, runoff, nutrient losses, siltation, loss of bio-diversity and disruption in watershed hydrology causing fragmentation of riparian forest. The objectives of this paper was to compare the com- munity composition, species diversity, distribution and tree population structure from three unprotected zones of ri- parian forest in Dikhu river. Understanding the knowledge of species diversity is a useful tool in plant ecology and for- estry to compare the composition of different species.
Quantitative analysis of trees from riparian forest will pro- vide a valuable information for riparian forest assessment and improve our knowledge by the identification of ecologi- cally, useful species as well as species of special concern, thus identifying conservation efforts for sustainability of ri- parian forest biodiversity.
Materials and Methods
Study areas
The study was conducted in the three unprotected zones of riparian forest along Dikhu river, Nagaland, India.
Nagaland has a total geographical area of 16,579 sq. km and extends between 25°6′ N to 27°4′ N Latitude and 93°20′ E to 95°15′E Longitude. The state enjoys sub-trop- ical to warm temperate monsoonic types of climate with an annual mean rainfall of approximately 2,600 mm. The Dikhu river is one of the most prominent rivers of Nagaland which passes mainly to Zunheboto, Tuensang, Longleng, Moko- kchung and Mon districts of the state and flows across the Mokokchung and the Longleng districts. The Dikhu river is one of the tributaries of Brahmaputra. It originates from Nuroto Hill area in Zunheboto district, flow further north- ward and leaves the hill near Naginimora and finally joined with the Brahmaputra River in Assam. The river has a total length of about 160 km. The three zones were selected for the present study and designated as 1. Upper zones, Lumami (Latitude 26°12′57.2′′ and Longitude 094°29′
45.5′′) with an elevation of 960 m above ‘m a.s.l.’ in Zunhebotto district 2. Middle zones, Chare (Latitude 26°17′ 58.00′′ and Longitude 094°35′26.8′′) with an ele- vation of 566 m above ‘m a.s.l.’ in Tuensang district and 3.
Lower zones, Yachem (Latitude 26°29′51.5′′ and Longitude
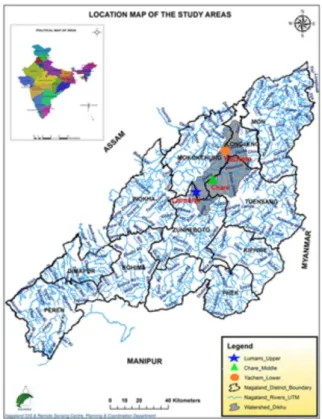
Fig. 1. Location map of the study areas showing the upper, middle and low- er zones of Dikhu river in Nagaland, India.
094°41′40.00′′) with an elevation of 292.6 m above ‘m a.s.l.’ in Longleng district (Fig. 1). In all the three zones through observation the level of disturbance is much more in the lower zone compared to rest of other zones. The low- er zone being located near the residential area and passing highway, it is much prone to anthropogenic activities like logging, rock quarrying, farming and plantation practices.
However, upper and middle zone are not much affected as they are located in the interior portion of the riparian forest but logging is taking place in these zones.
Vegetation analysis and identification of Species The phytosociological studies of trees from three zones along the river were conducted during the period of 2014 to 2015. The vegetation was analyzed by random sampling to obtain the most representative composition of the samples. In each zone 100×100 m2 plots were marked and subdivided randomly into 20 plots of 10×10 m2 sizes. 10 plots on each side of the river were taken randomly covering 0.02 ha. Tree density, basal area and girth class were esti-
mated from 0.2 ha area and extrapolated on per hectare basis. In each quadrate, the circumference at breast height (dbh at 1.37 m above ground level) of each tree (>10 cm dbh) was measured and individuals with dbh <10 cm were recorded as individual tree (Pande et al. 1988). The plant specimens collected during field study were processed for herbarium preservation and identified with the help of liter- atures (Bentham and Hooker 1862-1883; Prain 1903;
Kanjilal et al. 1934; Kanjilal et al. 1936; Kanjilal et al. 1938;
Kanjilal et al. 1940; Bor 1940; Guha Bakshi 1984; Bennet 1987). Herbarium specimen were deposited and preserved in the Department of Botany, Nagaland University, Lumami Campus.
Data Analysis
Standard methods of Curtis and Mclntosh (1950) and Mueller-Dombois and Ellenberg (1974) have been adopt- ed to analyze the density, frequency and abundance. For calculation of frequency, density and abundance the follow- ing formulae have been used.
Density=Total no. of individuals of a species Total no. of quadrates studied
Relative density (%)=
Number of individuals of a species Number of individuals of all species ×100
Frequency=
Number of sampling units species occur Total number of sampling units ×10
Relative frequency (%)= Frequency of a species Frequency of all species×100
Abundance =
Total no. of individuals of a species Total no. of quadrates in which the species occured
Relative Basal Area (%)=
Basal area of a species Basal area of all the species ×100
Basal area of trees was calculated by using the formula:
Basal area= C 2 4
where, C= Girth breast height
IVI of each species was calculated by summing the RF, RD and RBA values following Curtis (1959). Abundance to Frequency ratio (A/F) of each species was calculated to study the population dispersion pattern. The ranges of values for determining dispersion pattern were: regular (<0.025), random (0.025-0.05) and contiguous (>0.05) given by Cottam and Curtis (1956). Population structure of tree spe- cies was analyzed across ten girth classes.
Measurement of biodiversity indices
The formulae used in the calculation of various bio- diversity indices were:
1. Concentration of dominance was measured by using the formula given by Simpson’s (1949).
Cd=∑(ni/N)2
where, ni=Proportion of individuals belonging to the ith species
N=Total number of individuals
2. Shannon and Wiener Index (1963)
It is also called species diversity index. This index is based on information theory and improves upon the Simpson’s by giving more importance to the rare species.
H=−Σ (ni/N) log (ni/N)
ni=Total number of individuals belonging to its species N=Total number of individuals in the sample.
3. Simpson’s Diversity Index (D) given by Simpson’s (1949) as
D= ∑ ni (ni−1) N (N−1)
4. Simpson’s Index of Diversity (1949)=1-D
5. Simpson’s Reciprocal Index elaborated from Simpson (1949)=1/D
6. Species heterogeneity is defined as the reciprocal of Simpson’s index or under root of concentration of domi- nance (Cd), was also determined as:
Species heterogeneity=
7. Hill’s diversity Index
N1=eH, Where H=Shannon-Weiner’s index N2=1/D, Where D=Simpson’s index
8. Margalef ’s richness index (1958) R=S-1/ln N
where, S=Total no. of species
N=Total no. of individual of all species.
9. Evenness Index given by Pielou (1969)=H/ln S
10. E4=
11. E5=
12. Menhinick’s richness index was calculated by using the formulae given by Menhinick (1964) as, DI=
where, S=No. of species N=No. of total species
13. Similarity Index (Sorenson 1948) was also calculated by using the formula;
S= ,
wheres, S=Similarity Index A=No. of species at a site B=No. of species at another site
C=No. of species common to both the sites.
14. Dissimilarity Index (Sorenson, 1948)=1-S where, S=Similarity Index
Results and Discussion
Species composition and distribution of trees Table 1 shows the composition and distribution of tree
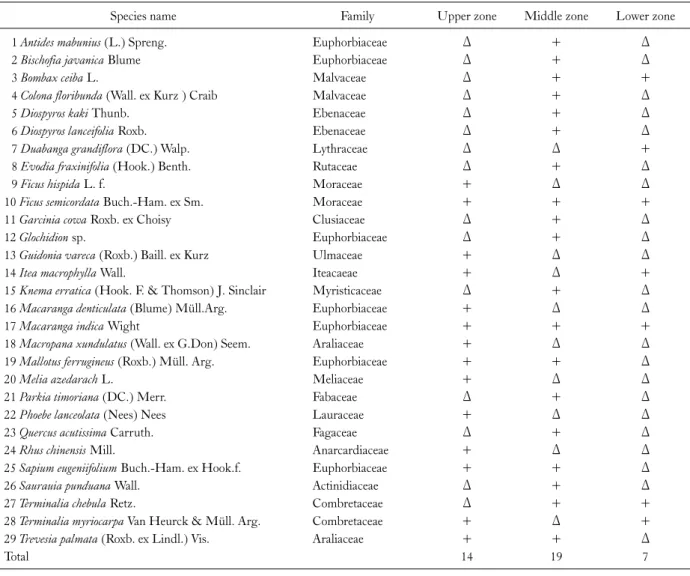
Table 1. Composition and distribution of tree in riparian forest at upper, middle and lower zone of Dikhu river
Species name Family Upper zone Middle zone Lower zone
1 Antides mabunius (L.) Spreng. Euphorbiaceae Δ + Δ
2 Bischofia javanica Blume Euphorbiaceae Δ + Δ
3 Bombax ceiba L. Malvaceae Δ + +
4 Colona floribunda (Wall. ex Kurz ) Craib Malvaceae Δ + Δ
5 Diospyros kaki Thunb. Ebenaceae Δ + Δ
6 Diospyros lanceifolia Roxb. Ebenaceae Δ + Δ
7 Duabanga grandiflora (DC.) Walp. Lythraceae Δ Δ +
8 Evodia fraxinifolia (Hook.) Benth. Rutaceae Δ + Δ
9 Ficus hispida L. f. Moraceae + Δ Δ
10 Ficus semicordata Buch.-Ham. ex Sm. Moraceae + + +
11 Garcinia cowa Roxb. ex Choisy Clusiaceae Δ + Δ
12 Glochidion sp. Euphorbiaceae Δ + Δ
13 Guidonia vareca (Roxb.) Baill. ex Kurz Ulmaceae + Δ Δ
14 Itea macrophylla Wall. Iteacaeae + Δ +
15 Knema erratica (Hook. F. & Thomson) J. Sinclair Myristicaceae Δ + Δ
16 Macaranga denticulata (Blume) Müll.Arg. Euphorbiaceae + Δ Δ
17 Macaranga indica Wight Euphorbiaceae + + +
18 Macropana xundulatus (Wall. ex G.Don) Seem. Araliaceae + Δ Δ
19 Mallotus ferrugineus (Roxb.) Müll. Arg. Euphorbiaceae + + Δ
20 Melia azedarach L. Meliaceae + Δ Δ
21 Parkia timoriana (DC.) Merr. Fabaceae Δ + Δ
22 Phoebe lanceolata (Nees) Nees Lauraceae + Δ Δ
23 Quercus acutissima Carruth. Fagaceae Δ + Δ
24 Rhus chinensis Mill. Anarcardiaceae + Δ Δ
25 Sapium eugeniifolium Buch.-Ham. ex Hook.f. Euphorbiaceae + + Δ
26 Saurauia punduana Wall. Actinidiaceae Δ + Δ
27 Terminalia chebula Retz. Combretaceae Δ + +
28 Terminalia myriocarpa Van Heurck & Müll. Arg. Combretaceae + Δ +
29 Trevesia palmata (Roxb. ex Lindl.) Vis. Araliaceae + + Δ
Total 14 19 7
+, presence; Δ, absence.
species in riparian forest at upper, middle and lower zone of Dikhu river. A total of 29 tree species belonging to 18 fami- lies were recorded from the three zones of the river. The species richness was highest at the middle zone (19) fol- lowed by upper (14) and lower zone (7). At upper zone, a total of 627 tree individual representing 14 species belong- ing to 9 families were identified within the 0.2 ha area plot whereas at middle zone, a total of 840 individual trees be- longing to 12 families were identified and at lower zone, 175 individual trees belonging to 6 families were recorded.
Total stand density and basal area recorded from three zones were: 3,132.5 trees ha-1 and 261.48 m2 ha-1 at upper zone, 4,200 trees ha-1 and 378.48 m2 ha-1 at middle zone
and 872.5 trees ha-1 and 5.6 m2 ha-1 at lower zone. High species richness means greater diversity and which leads to a higher community stability (MaAcrthur 1955). Iqbal et al. (2012) reported 31 tree species around Khok river of Garhwal Himalaya, India. Sunil et al. (2016) recorded a to- tal of 177 tree species from the riparian forest along the riv- er Cauvery. Species composition varies widely according to the frequency of river disturbances (Oliveira-Filho et al.
1994; Metzger et al. 1997). This spatial heterogeneity re- sulting from geomorphological processes is viewed as one of the major causes of species richness (Gould and Walker 1997; Ferreira and Stohlgren 1999). Even though the de- gree of disturbance in the riparian forests of Dikhu river
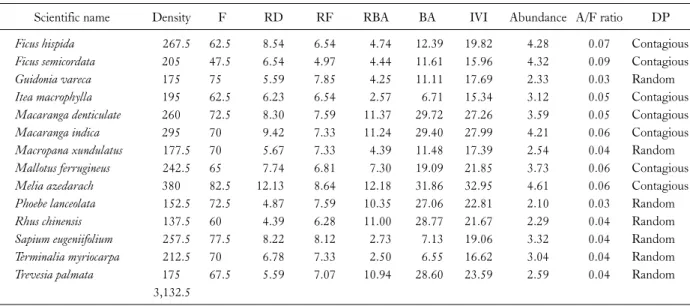
Table 2. Quantitative analysis of tree at upper zone (Lumami) in riparian forest of Dikhu river
Scientific name Density F RD RF RBA BA IVI Abundance A/F ratio DP
Ficus hispida 267.5 62.5 8.54 6.54 4.74 12.39 19.82 4.28 0.07 Contagious
Ficus semicordata 205 47.5 6.54 4.97 4.44 11.61 15.96 4.32 0.09 Contagious
Guidonia vareca 175 75 5.59 7.85 4.25 11.11 17.69 2.33 0.03 Random
Itea macrophylla 195 62.5 6.23 6.54 2.57 6.71 15.34 3.12 0.05 Contagious
Macaranga denticulate 260 72.5 8.30 7.59 11.37 29.72 27.26 3.59 0.05 Contagious
Macaranga indica 295 70 9.42 7.33 11.24 29.40 27.99 4.21 0.06 Contagious
Macropana xundulatus 177.5 70 5.67 7.33 4.39 11.48 17.39 2.54 0.04 Random
Mallotus ferrugineus 242.5 65 7.74 6.81 7.30 19.09 21.85 3.73 0.06 Contagious
Melia azedarach 380 82.5 12.13 8.64 12.18 31.86 32.95 4.61 0.06 Contagious
Phoebe lanceolata 152.5 72.5 4.87 7.59 10.35 27.06 22.81 2.10 0.03 Random
Rhus chinensis 137.5 60 4.39 6.28 11.00 28.77 21.67 2.29 0.04 Random
Sapium eugeniifolium 257.5 77.5 8.22 8.12 2.73 7.13 19.06 3.32 0.04 Random
Terminalia myriocarpa 212.5 70 6.78 7.33 2.50 6.55 16.62 3.04 0.04 Random
Trevesia palmata 175 67.5 5.59 7.07 10.94 28.60 23.59 2.59 0.04 Random
3,132.5
D, density (trees ha-1); F, frequency; RD, relative density (%); RF, relative frequency (%); RBA, relative basal area (%); BA, basal area (m2 ha-1); IVI, importance value index; A, abundance; A/F ratio; DP, distribution pattern.
has not been analyzed, the anthropogenic stress and the in- termittent small scale folds were prevalent at upper and lower zones. However, the disturbance is not among the most important factors that affect species diversity (Mackey and Currie 2001) but variation in species richness and com- position also related to natural site variations like elevation, slope and mean annual precipitation (Wyant and Ellis 1990). It was recorded that the maximum environment het- erogeneity occurs in midcourse resulting highest species richness and habitat diversity (Vannotte et al. 1980;
Tabacchi 1990). The riparian forest of Dikhu river harbors diverse riparian trees with high species richness. Species richness in a forest depends on climatic, edaphic and biotic factors (Ayappan and Parthasarathy 1999).
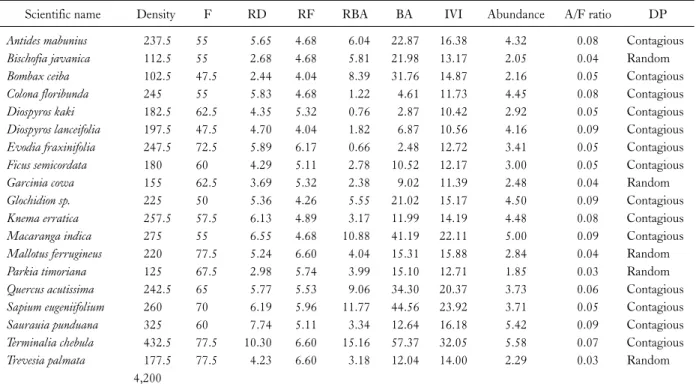
Based on the IVI obtained, Melia azaderach had the highest IVI (32.95) followed by the Macaranga indica and Macaranga denticulata (27.26) and lowest in Itea macro- phylla (15.34) at upper zone (Table 2). At middle zone, Terminalia chebula had the highest IVI (32.05) followed by Sapium eugeniifolium (23.92), Macaranga indica (22.11) and Diospyros kaki has the lowest (10.42) IVI (Table 3) whereas at the lower zone Duabanga grandiflora had the highest IVI (110.47) followed by Ficus semicordata (58.52), Itea macrophylla (32.03) whereas Bombax ceiba had the lowest IVI (21.40) as shown in Table 4. At the up-
per zone, Euphorbiaceae family occupied the highest (4) followed by Araliaceae (2), Moraceae (2), Meliaceae (1), Lauraceae (1), Anarcardiaceae (1), Combretaceae (1), Itea- caeae (1), Ulmaceae (1). At the middle zone, Euphorbia- ceae family has also occupied the maximum (6) followed by Malvaceae (2), Ebenaceae (2), Combretaceae (1), Fagaceae (1), Actinidiaceae (1), Myristicaceae (1), Araliaceae (1), Rutaceae (1), Fabaceae (1), Moraceae (1) and Clusiaceae (1). Whereas, at the lower zone Combretaceae family ob- tained the highest (2), followed by Lythraceae, Moraceae, Iteacaeae, Euphorbiaceae and Malvaceae family having 1 number in each of the family (Table 1). Thus from the IVI values, Melia azaderach, Terminalia chebula and Duabanga grandiflora were found to be the most dominant tree species occurred at upper, middle and lower zones respectively. IVI value of any species indicates the dominant of species in a mixed population and it gives a total picture of the social structure of species in a community and can be used to form an association of dominant species (Parthasarathy and Karthikeyan 1997). In the present study, it was found that Euphorbiaceae family was dominant at upper and middle zones whereas Lythraceae was dominant at lower zone. The predominant of Fabaceae, Combretaceae and Euphorbiaceae families in riparian zone was confirmed by Fousseni et al.
(2011). The dominance of tree families Euphorbiaceae,
Table 3. Quantitative analysis of tree at middle zone (Chare) in riparian forest of Dikhu river
Scientific name Density F RD RF RBA BA IVI Abundance A/F ratio DP
Antides mabunius 237.5 55 5.65 4.68 6.04 22.87 16.38 4.32 0.08 Contagious
Bischofia javanica 112.5 55 2.68 4.68 5.81 21.98 13.17 2.05 0.04 Random
Bombax ceiba 102.5 47.5 2.44 4.04 8.39 31.76 14.87 2.16 0.05 Contagious
Colona floribunda 245 55 5.83 4.68 1.22 4.61 11.73 4.45 0.08 Contagious
Diospyros kaki 182.5 62.5 4.35 5.32 0.76 2.87 10.42 2.92 0.05 Contagious
Diospyros lanceifolia 197.5 47.5 4.70 4.04 1.82 6.87 10.56 4.16 0.09 Contagious
Evodia fraxinifolia 247.5 72.5 5.89 6.17 0.66 2.48 12.72 3.41 0.05 Contagious
Ficus semicordata 180 60 4.29 5.11 2.78 10.52 12.17 3.00 0.05 Contagious
Garcinia cowa 155 62.5 3.69 5.32 2.38 9.02 11.39 2.48 0.04 Random
Glochidion sp. 225 50 5.36 4.26 5.55 21.02 15.17 4.50 0.09 Contagious
Knema erratica 257.5 57.5 6.13 4.89 3.17 11.99 14.19 4.48 0.08 Contagious
Macaranga indica 275 55 6.55 4.68 10.88 41.19 22.11 5.00 0.09 Contagious
Mallotus ferrugineus 220 77.5 5.24 6.60 4.04 15.31 15.88 2.84 0.04 Random
Parkia timoriana 125 67.5 2.98 5.74 3.99 15.10 12.71 1.85 0.03 Random
Quercus acutissima 242.5 65 5.77 5.53 9.06 34.30 20.37 3.73 0.06 Contagious
Sapium eugeniifolium 260 70 6.19 5.96 11.77 44.56 23.92 3.71 0.05 Contagious
Saurauia punduana 325 60 7.74 5.11 3.34 12.64 16.18 5.42 0.09 Contagious
Terminalia chebula 432.5 77.5 10.30 6.60 15.16 57.37 32.05 5.58 0.07 Contagious
Trevesia palmata 177.5 77.5 4.23 6.60 3.18 12.04 14.00 2.29 0.03 Random
4,200
D, density (trees ha-1); F, frequency; RD, relative density (%); RF, relative frequency (%); RBA, relative basal area (%); BA, basal area (m2 ha-1); IVI, importance value index; A, abundance; A/F ratio; DP, distribution pattern.
Table 4. Quantitative analysis of tree at lower zone (Yachem) in riparian forest of Dikhu river
Scientific name Density F RD RF RBA BA IVI Abundance A/F ratio DP
Bombax ceiba 57.5 62.5 6.13 13.66 1.61 0.09 21.40 0.92 0.01 Regular
Duabanga grandiflora 365 67.5 38.93 14.75 56.79 3.18 110.47 5.41 0.08 Contagious
Ficus semicordata 153.5 67.5 16.27 14.75 27.50 1.54 58.52 2.26 0.03 Random
Itea macrophylla 44 70 11.73 15.30 5.00 0.28 32.03 1.57 0.02 Regular
Macaranga indica 80 60 8.53 13.11 2.50 0.14 24.15 1.33 0.02 Regular
Terminalia chebula 80 65 8.53 14.21 2.86 0.16 25.60 1.23 0.02 Regular
Terminalia myriocarpa 92.5 65 9.87 14.21 3.75 0.21 27.82 1.42 0.02 Regular
872.5
D, density (trees ha-1); F, frequency; RD, relative density (%); RF, relative frequency (%); RBA, relative basal area (%); BA, basal area (m2 ha-1); IVI, importance value index; A, abundance; A/F ratio; DP, distribution pattern.
Araliaceae, Moraceae, Meliaceae, Lauraceae, Anarcardia- ceae, Combretaceae, Iteacaea, Ulmaceae, Malvaceae, Ebe- naceae, Fagaceae, Actinidiaceae, Myristicaceae, Rutaceae, Fabaceae, Clusiaceae and Lythraceae in the riparian forest of Dikhu river indicates the types of the tropical forest.
There is no riparian tree data to cite the comparison from India except the work of Chalakkudy river basin (Bachan 2003) and Meenachil river basin (Varghese 2014). Fig. 2
depicts dominance diversity (D-d) curve of the tree species from the three zones of Dikhu riparian forest in relation to their availability of suitable niche. Whittaker (1969) point- ed out that resource apportionments in a community have often been interpreted from (D-d) curve. The (D-d) curve under present investigation approached to log normal dis- tribution model of Preston (1948) with less number of tree in high IVI range. Dominance diversity relationships form
Fig. 2. (a) Dominance diversity curve for riparian tree species at upper zone. (b) Dominance diversity curve for riparian tree species at middle zone. (c) Dominance diversity curve for riparian tree species at lower zone.
a continuous progression from dominant to intermediate to rare species. These curves are believed to expressed differ- ent pattern of competition and value differentiation in com- munities and thus have varied forms. Lognormal hypoth- esis assumes that the importance of species is governed by the interaction between a large numbers of factor determin- ing successes in the niche hyperspace (Whittakker 1970).
In connection to this, Whittakker (1965) noted that the log-normal series describes the partitioning of realized ni- che space among various species and is the consequence of evolution of particular species diversity along the niche pa- rameters which they exploit.
Distribution pattern
The Abundance to frequency ratio ranged from 0.03 to 0.09 at upper zone, 0.03 to 0.09 at middle zone and 0.01 to 0.08 at lower zone. At the upper zone, 7 species con- tributing 50% were recorded the contagious pattern of dis- tribution followed by value of 50% for random distribution pattern by 7 species. At middle zone, out of 19 species re- corded, 14 species show the contagious pattern of dis- tribution contributing 73.69% and remaining 5 species show random distribution pattern contributing 26.31%. At lower zone, out of 7 tree species recorded, 5 species were re- corded to be show regular pattern of distribution (71.42%) followed by contagious pattern (14.29%) by Duabanga grandiflora and random pattern of distribution (14.29%) by Ficus semicordata as mentioned in Table 1-3. The dis- tribution pattern analysis shows species dispersion across a
span of time at any given site. The patterns of distribution solely depend on both the physico-chemical natures of the environment as well as on the biological peculiarities of the organisms themselves. According to Odum (1971), con- tiguous distribution is common in nature and formed as a result of small but significant variations in the ambient en- vironmental conditions. The author also noted that random distribution is found in very uniform environments only, and regular distribution occurs where severe competition exists between individuals. The above statement supports the findings of the present study. The analysis of dis- tribution pattern along the three zones indicate that con- tiguous distribution pattern was the most common followed by random pattern except in lower zone, the pattern of spe- cies distribution was dominated by regular. Several workers (Ralhan et al. 1982; Majumdar and Datta 2015) have re- ported similar distribution pattern in the forest vegetation of India. Variation in the distribution pattern among zones and vegetation composition are associated with micro-envi- ronmental and biotic factors (Singhal and Soni 1989).
Population structure
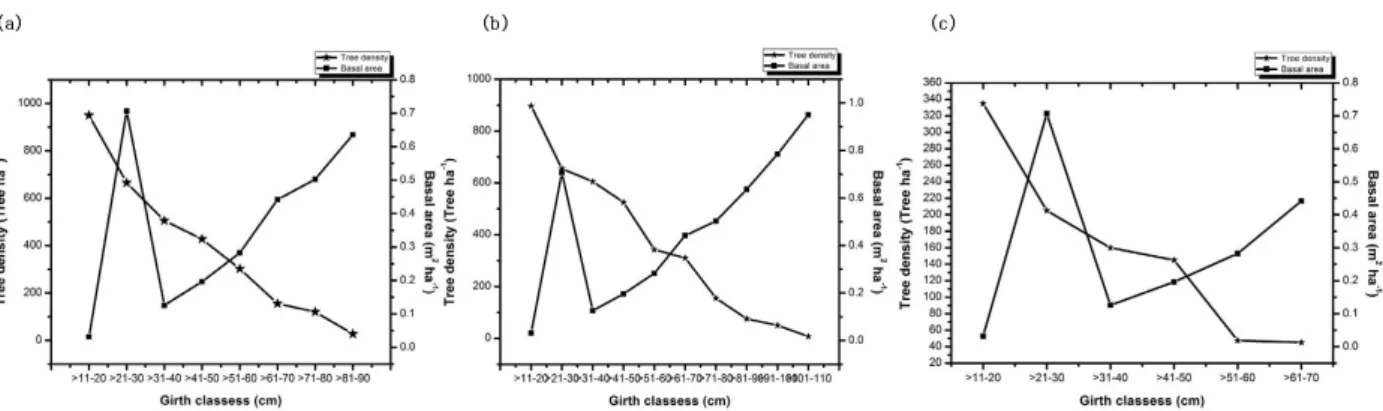
Tree density at the middle riparian zone was higher (4,200 trees ha-1) compared to upper (3,132.5 trees ha-1) and lower zone (872.5 tree ha-1). However, the tree density observed in the present study was high compared to 118.6 trees ha-1 in Cauvery river and 11.9 trees in 0.01 ha-1 re- ported by Bachan (2003) in Chalakkudy river, Kerala and 660 ha-1 reported by Iqbal et al. (2012) in Khok river of
Fig. 3. (a) Tree density (tree ha-1) and basal area (m2 ha-1) distribution along the girth classes at upper zone. (b) Tree density (tree ha-1) and basal area (m2 ha-1) distribution along the girth classes at middle zone. (c) Tree density (tree ha-1) and basal area (m2 ha-1) distribution along the girth classes at lower zone.
Garhwal Himalaya. Burton et al. (2005) worked in riparian forest of two countries observed the density values between 950 trees ha-1 to 1958 trees ha-1. The reason for higher tree density values at the upper and middle zones may be due to Melia azaderach, Terminalia chebula and Duabanga gran- diflora are dominant at the upper, middle and lower zone of the riparian forest indicating the deciduous type of forest.
They are pioneer species which often initiates a secondary succession in the riparian forest replacing the dominant na- tive riparian species. Upper and middle zone are less af- fected by anthropogenic activities compared to lower zone.
The reason for low tree density in the lower zone may be due to high anthropogenic pressure created by villagers for extraction of fuel wood, collection of fodder for animal feeding and farming practices. Flooding events are primar- ily responsible for creating its spatial heterogeneity, with the timing of flooding, its duration, frequency and magnitude all identified as influencing the structure and composition of riverine vegetation (Richter et al. 1997; Ward et al.
1999). There is considerable heterogeneity in tree species along the three zones of the river. He and Lagendre (2002) reported species-area relation, which predicts that species richness increases with increasing area. Pausas and Austin (2001) also suggested that over large region, the dis- tribution of species richness is likely to be governed by two or more environmental factors and not by a single factor.
Density of tree with smaller girth size is higher than that of the larger girth size (Basyal et al. 2011). The basal area of the trees in the studied zones indicates a high level of hu- man disturbance in lower (10-60 cm gbh) and middle girth classes (61-120 cm gbh) because of selective felling of under
storey and upper storey trees for fence-posts, house con- struction and other agricultural implements according to the information gathered during field work. Such selective elimination of species would affect forest species composi- tion and stand structure, and also a more subtle impact and depends largely on accessibility, which itself is related to topography (Johst et al. 2002). Stem density and species richness have consistently decreased with increasing girth class of tree species from 60 to more than 100 cm girth. The contribution of each species to the overall basal area of the trees showed that Terminalia chebula contributed the larg- est basal area of 57.37 m2 ha-1 at middle zone followed by Melia azadarach at upper zone (31.86 m2 ha-1) and Duabanga grandiflora (3.18 m2 ha-1) at lower zone (Table 2-4). The mean basal area ranged from 0.45 m2 ha-1 (lower zone) -21.29 m2 ha-1 (upper zone). Higher value at upper zone indicates that the riparian forest at this zone are dense- ly populated and exhibit species competition whereas mini- mum at lower zone might be due to less number of species with few population. Variation in density and basal area of different zones of riparian forest may be attributed by altitu- dinal variation, species composition, age structure, succes- sional stage of the forest and degree of disturbance (Swamy et al. 2000). The size class distribution of tree has often been use to represent the population structure of forest (Saxena and Singh 1984; Khan et al. 1987). Tree size class distribution can be used as indicator of changes in pop- ulation structure and species composition (Newbery and Gartlan 1996). Fig. 3 shows that all the three riparian zone were characterized by small and young trees whose girths were mostly >11-20, >21-30, >31-40, >41-50, >51-60 cm
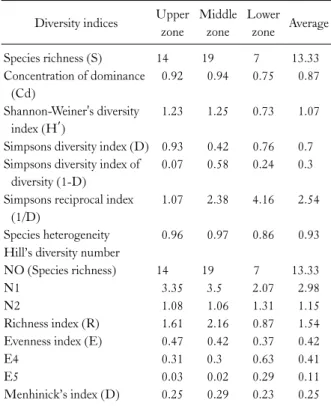
Table 5. Diversity indices of riparian tree at upper, middle and low- er zones of Dikhu river
Diversity indices Upper zone
Middle zone
Lower zone Average
Species richness (S) 14 19 7 13.33
Concentration of dominance (Cd)
0.92 0.94 0.75 0.87
Shannon-Weiner's diversity index (H′)
1.23 1.25 0.73 1.07
Simpsons diversity index (D) 0.93 0.42 0.76 0.7 Simpsons diversity index of
diversity (1-D)
0.07 0.58 0.24 0.3
Simpsons reciprocal index (1/D)
1.07 2.38 4.16 2.54
Species heterogeneity 0.96 0.97 0.86 0.93 Hill’s diversity number
NO (Species richness) 14 19 7 13.33
N1 3.35 3.5 2.07 2.98
N2 1.08 1.06 1.31 1.15
Richness index (R) 1.61 2.16 0.87 1.54 Evenness index (E) 0.47 0.42 0.37 0.42
E4 0.31 0.3 0.63 0.41
E5 0.03 0.02 0.29 0.11
Menhinick’s index (D) 0.25 0.29 0.23 0.25 though, trees of higher girth were obtained in the middle
zone compared to the rest of the zones. Girth class fre- quency showed reverse J-shaped population curve in our present study which is similar to those reported from forest of north-east India (Mishra et al. 2005; Tynsong and Tiwari 2011), eastern ghats (Kadavul and Parthasarathy 1999; Sahu et al. 2012). The reverse J-shaped population curve of trees suggests an evolving or expanding pop- ulation, climax or stable type of population in forest ecosys- tem, indicating that the forest harbors a growing and healthy population (Mishra et al. 2005; Sahu et al. 2012;
Sarkar and Devi 2014). The reverse J-shaped GBH-den- sity distribution of trees indicates that the forest sites are disturbed and they are in their successional stages, hence most of the species identified are secondary forest regrowth species.
Diversity indices and their measures
Table 5 show the various diversity indices of riparian tree at the three zones of riparian forest. The highest index of co-dominance (Cd) values recorded was 0.94 at middle zone whereas lowest index obtained was 0.75 at lower zone.
The concentration of dominance of the study sites corre- sponds with the reported value for tropical semi evergreen forest of Manipur (Devi and Yadava 2006). According to Whittaker and Niering (1965), Risser and Rice (1971), Singhal et al. (1986) and Pande et al. (1996), the value of concentration of dominance (Cd) for temperate forests falls within the range of 0.10 to 0.99, however, for tropical for- ests the average value was 0.06 as reported by Knight (1975). The range of Cd reported for tropical forest of India varies from 0.21 to 0.92. The value reported in pres- ent study corresponds well with the reported ranged for tropical forest by several workers (Parthasarathy et al. 1992;
Visalakshi 1995).
The highest Shannon’s Index H′ was recorded in middle zone (1.25) whereas lowest H′ (0.73) was recorded at lower zone. High value of H′ at the middle zone would be repre- sentative of more diverse community. The diversity index (H') for some of the Indian riparian forest were 3.06 (Iqbal et al. 2012), 5.6 (Sunil et al. 2016), 1.43-1.84 (Bachan 2003), 2.19-2.92 (Burton et al. 2005) and 2.43-5.4 (Natta 2000).
Hill diversity numbers (N1 and N2) recorded at three
zones were 3.35 and 1.08 at upper zone followed by middle zone (3.50 and 1.06) and 2.07 and 1.31 at lower zone, respectively. Number 2 of Hill diversity index was found to be consistent with the values of Kumar et al. (2004) whereas Number 1 and 2 of Hill diversity indices were found to be very low with the values of Rajkumar and Parthasarathy (2008), Yang et al. (2008) and Adekunle et al. (2013).
Maximum Menhinick’s richness index was found to be recorded at middle zone (0.29) and minimum at lower zone (0.23). The reason for minimum Menhinick’s richness in- dex at lower zone may be due to disturbances like logging activity, collection of fodder for animal feeding and plantation. Although riparian areas are largely spared dur- ing logging activity because of the regulation on the buffer zone, many plants would be affected particularly due to sil- tation from runoff water from the area that has been made into footways. Many studies have shown that logging in- tensity is negatively associated with stem densities and spe- cies abundance and richness (Azliza et al. 2012). This was due to targeted removal of large commercial and non-com- mercial (silvicultural treatments) tree species and an in-
Table 6. Similarity and Dissimilarity indices of riparian tree at up- per, middle and lower zones of Dikhu river
Zone Middle zone Lower zone
Upper zone 0.30 (0.7) 0.38 (0.62)
Middle zone 0.30 (0.7)
Values in parentheses indicate dissimilarity indices.
creased mortality soon after logging. The present study was consistent with studies in tropical rain forest (De-graaf 1986) as well as other vegetation (Korning and Baslev 1994).
Similarity indices was found to be maximum between upper and lower zone (0.38) and minimum both between upper and middle zone, middle and lower zone with a value of 0.30 (Table 6). The dissimilarity index value shows the opposite trends of similarity index value in the compared studied zone. Sorensen’s similarity index expressed in per- centage show low similarity (30.30%) of species composi- tion when compared between upper and middle zone, and obtained high similarity between upper and lower zone (38.09%) followed by middle and lower zone (30.76%) ri- parian vegetation in the present study. However, a high similarity index in term of species composition was reported for Kenong Forest Park (48%) and Chini watershed forest (40%) in Azliza et al. (2012). According to Chandrashek- ara and Ramakrishna (1993) the level of distribution and succession ages of forest has effects on species composition.
Simpson’s diversity index (D) lies within the ranged:
0.42 (middle zone) -0.93 (upper zone), Simpson’s index of diversity (1-D) lies within the range: 0.07 (upper zone) -0.58 (middle zone) and Simpson’s reciprocal index (1/D) lies within the range: 1.07 (upper zone) -4.16 (lower zone).
The value obtained for Simpson diversity index in present study is less than the value reported by Bachan (2003) which lies within the range 0.94 -1.00 from the riparian vegetation along the middle and lower zones of the Chalakkudy river, Kerala, India. Indicating less number of tree diversity in the studied zones. Sunil et al. (2016) re- corded Simpson’s index value of 0.96 in riparian vegetation across forest of river Cauvery southern, India. Iqbal et al.
(2012) obtained Simpson’s index value of 0.08 of trees growing along the Khoh river of Garhwal Himalaya, India, and Varghese (2014) reported the range of 0.12 to 0.67
which are lesser than the present value. Simpson index di- versity and Simpsons reciprocal index values obtained in the present study i.e. 0.30 and 2.54, respectively are lower than the values reported by Varghese (2014) in his studies on the comparison of riparian species diversity between the main river channel and sub watersheds of Meenachil river basin.
The species evenness (E) was higher at upper zone (0.47) followed by middle (0.42) and lower zone (0.37). E4
values were found to be maximum at lower zone (0.63) and minimum value of 0.30 was recorded at middle zone. E5
values recorded its maximum value of 0.29 at lower zone and a minimum value of 0.02 at middle zone. E4 indicates the ratio of abundant species whereas E5 indicates the very abundant species in a community. The increase in value of evenness index (Hill’s ratio) in general as compared to modified hill ratio seems to be related to the Co-dominance of species and very similar nature of individuals compared to many species. Species evenness is a measure of the rela- tive abundance of species that make up the richness of a for- ested ecosystem; the maximum evenness was (E=1) ob- tained when all species in a site have similar population size.
Higher the evenness value, more even the species is (Kent and Coker 1992). The high evenness value at lower zone might be due to difference in site condition and disturbance regime in the vegetation types of the riparian corridors.
This is in agreement with the report of Naiman et al. (1993) who reported that riparian and adjacent upland vegetation often contrast conspicuously in physical conditions, dis- turbance regime and vegetation pattern.
Maximum species heterogeneity values were recorded at middle zone (0.97) and minimum at lower zone (0.86).
Our values are slightly higher than the values given by Varghese (2014) where he recorded the values of species heterogeneity for riparian trees between 0.40 and 0.83. The present findings are in conformity with the work of numer- ous riparian ecologists who have noted similar variation in vegetation along river corridors (Carbiener and Schnitzler 1990; Varghese 2014).
Conclusion
This study provides a critical analysis of riparian tree species richness in the riparian forest of Dikhu river.
Although a total of 29 trees species were found from the three zones studied but it provides a diverse family indicat- ing high diversity of the riparian forest. A reverse J-shaped population curve indicates high tree species richness and density in lower girth class which gradually decrease with increase in girth class population size indicating that the ri- parian forest of Dikhu river is in less mature succession stage. Our observation shows that the riparian forest of Dikhu river harbours rich tree diversity providing habitat and food resources to large number of fauna. However, the anthropogenic activities prevailing in the lower zone like collection of fodder for animals, fuel wood, construction purposes and logging by the local people to meet their re- quirements imposed threat to the survival and population structure of the species. So, if the present trends of anthro- pogenic pressure continues, the growth, survival and re- production potential of the trees species will be affected in near future. Therefore, a proper strategy for the con- servation and management of the study site is required to formulate, ensuring a sustainable harvest and utilization of forest resources by the local villagers. This information is also useful for designing management practices of riparian zone to enhance understanding of riparian forest ecology and ecosystem function. It will be interesting to study more representatives of riparian plant communities from other type of forest that exist in India to know more about these plant communities.
Acknowledgements
The first author is thankful to University Grant Commission sponsored SAP-DRS-III, Programme, New Delhi, Government of India for providing financial assis- tance by appointing as the project fellow. The author also thank the Nagaland GIS & Remote Sensing Centre, Planning & Coordination Department, Nagaland for pro- viding Study area map. We are grateful to the Mr. Santanu Dey, Research Scholar Department of Botany, Nagaland University, for his contribution in identifying the tree spe- cies at field.
References
Adekunle VAJ, Olagoke AO, Akinele SO. 2013. Tree species diver-
sity and structure of a Nigerian strict nature reserve. Trop Ecol 54: 275-289.
Ayyappan N, Parthasarathy N. 1999. Biodiversity inventory of trees in a large-scale permanent plot of tropical evergreen forest at Varagalaiar, Anamalais, Western Ghats, India. Biodivers Conserv 8: 1533-1554.
Azliza M, Nazre M, Mohamad-Roslan MK, Shamsul K. 2012.
Characterization of riparian plant community in lowland forest of Peninsular Malaysia. Int J Botany 8: 181-191.
Bachan AKH. 2003. Riparian Vegetation Along the Middle and Lower Zones of the Chalakkudy River, Kerala, India. Project 26/2000 Sponsored by Kerala Research Programme of Local Development, CDS, Thiruvananthapuram.
Baraloto C, Molto Q, Rabaud S, Herault B, Valencia R, Blanc L, Fine PVA, Thompson J. 2013. Rapid simultaneous estimation of above ground biomass and tree diversity across Neotropical forests: a comparison of field inventory methods. Bitropica 45:
288-298.
Basyal S, Lekhak HD, Devkota A. 2011. Regeneration of Shorea robusta. Gaertn in tropical forest of Palpa district, Central Nepal. Sci World 9: 53-56.
Bennet SSR. 1987. Name Changes in Flowering Plants of India and Adjacent Regions. Triseas Publishers, Dehradun, 772 pp.
Bentham G, Hooker JD. 1862-1883. Genera Plantarum. 3 Vols.
London.
Bor NL. 1940. Flora of Assam. Vol. 5. Gramineae. Government of Assam, Shillong, 480 pp.
Burton ML, Samuelson LJ, Pan S. 2005. Riparian woody plant di- versity and forest structure along an urban-rural gradient.
Urban Ecosyst 8: 93-106.
Carbiener R, Schnitzler A. 1990. Evolution of major pattern mod- els and processes of alluvial forest of the Rhine in the rift valley (France/Germany). Vegetatio 88: 115-129.
Chandrashekara UM, Ramakrishnan PS. 1994. Vegetation and gap dynamics of a tropical wet evergreen forest in the Western Ghats of Kerala, India. J Trop Ecol 10: 337-354.
Cottam G, Curtis JT. 1956. The use of distance measures in phyto- sociological sampling. Ecology 37: 451-460.
Curtis JT, McIntosh RP. 1950. The interrelations of certain ana- lytic and synthetic phytosociological characters. Ecology 31:
434-455.
Curtis JT. 1959. The vegetation of Wisconsin: an ordination of plant communities. University of Wisconsin Press, Madison, Wisc, 657 pp.
de Graaf NR. 1986. A silvicultural system for Natural regeneration of tropical rain forest in Suriname. Ph.D. thesis. Agricultural University, Wageningen, Netherlands.
Devi LS, Yadava PS. 2006. Floristic diversity assessment and vege- tation analysis of tropical semievergreen forest of Manipur, north east India. Trop Ecol 47: 89-98.
Dudgeon D. 1992. Endangered ecosystems: a review of the con- servation status of tropical Asian rivers. Hydrobiologia 248:
167-191.
Dudgeon D. 2000. The ecology of tropical Asian rivers and streams in relation to biodiversity conservation. Annu Rev Ecol Syst 31: 239-263.
Evariste FF, Bernard-Aloys N, Nolé T. 2010 The importance of habitat characteristics for tree diversity in the Mengamé Gorilla Reserve (South Cameroun). Int J Biodivers Conserv 2:
155-165.
Ferreira LV, Stohlgren TJ. 1999. Effects of river level fluctuation on plant species richness, diversity, and distribution in a flood- plain forest in Central Amazonia. Oecologia 120: 582-587.
Fousseni F, Yu ZX, Hai ZX, Kperkouma W, Koffi A. 2011.
Floristic diversity in most dry and environmentally disturbed areas of northern Togo. Energy Procedia 11: 2127-2132.
Gadgil M. 2004. Karnataka state of environment report and action plan biodiversity sector. ENVIS Technical Report No.16.
Indian Institute of Science, Bangalore, 117 pp.
Gopal B. 1988. Wetlands: management and conservation in India.
Water Quality Bull 13: 3-6.
Gould WA, Walker MD. 1997. Landscape-scale patterns in plant species richness along an arctic river. Can J Bot 75: 1748-1765.
Guha Bakshi DN. 1984. Flora of Murshidabad District, West Bengal, India. Scientific Publishers, Jodhpur, 440 pp.
He F, Legendre P. 2002. Species diversity patterns derived from species-area models. Ecology 83: 1185-1198.
Iqbal K, Bhat JA, Nazir AP, Negi AK. 2012. Structure and compo- sition estimation of plant species around Khoh river of Garhwal Himalaya, India. J Biodivers Environ Sci 2: 1-11.
Johnsingh AJT, Joshua J. 1989. The threatened gallery forest of the river Tambiraparani, Mundanthurai Wildlife Sanctuary, South India. Biol Conserv 47: 273-280.
Johst K, Brandl R, Eber S. 2002. Metapopulation persistence in- dynamics landscapes: the role of dispersal distance. Oikos 98:
263-270.
Kadavul K, Parthasarathy N. 1999. Plant biodiversity and con- servation of tropical semi-evergreen forests in the Shervarayan hills of Eastern Ghats, India. Biodivers Conser 8: 419-437.
Kanjilal UN, Das A, Kanjilal PC, De RN. 1938. Flora of Assam.
Vol. 3. Caprifoliaceae to Plantaginaceae. Government of Assam, Shillong, 578 pp.
Kanjilal UN, Kanjilal PC, Das A, Purkayastha C. 1934. Flora of Assam. Vol. 1. Ranunculaceaeto Elaeocarpaceae. Government of Assam, Shillong, 184 pp.
Kanjilal UN, Kanjilal PC, Das A. 1936. Flora of Assam. Vol. 2.
Connaraceæ to Cornaceæ. Government of Assam, Shillong, 409 pp.
Kanjilal UN, Kanjilal PC, De RN, Das A. 1940. Flora of Assam.
Vol. 4. Nyctaginaceæ to Cycadaceæ. Government of Assam, Shillong, 377 pp.
Kent M, Coker P. 1992. Vegetation description and analysis: a prac- tical approach. Belhaven Press, London, 384 pp.
Khan ML, Rai JPN, Tripathi RS. 1987. Population structure of
some tree species in disturbed and protected sub-tropical forests of north-east India. Acta Oecol Oec Appl 8: 247-255.
Knight DH. 1975. A phytosociological analysis of species-rich tropical forest on Barro Colorado Island, Panama. Ecol Monogr 45: 259-284.
Korning J, Basley H. 1994. Growth rates and mortality patterns of tropical lowland tree species and the relation to forest structure in Amazonian Ecuador. J Trop For Sci 10: 151-166.
Kumar M, Sharma CM, Rajwar GS. 2004. A study on the com- munity structure and diversity of a sub-tropical forest of Garhwal Himalayas. Indian For 130: 207-214.
Macarthur R. 1955. Fluctuation of animal population, and a meas- ure of community stability. Ecology 36: 533-536.
Mackey RL, Currie DJ. 2001. The diversity-disturbance relation- ship: is it generally strong and peaked? Ecology 82: 3479-3492.
Majumdar K, Datta BK. 2015. Cachar tropical semi-evergreen for- est type of Northeast India: status of species diversity, dis- tribution and population structure. Proc Int Acad Ecol Environ Sci 5: 104-127.
Malanson GP. 1993. Riparian Landscapes. Cambridge University Press, Cambridge.
Margalef DR. 1958. Information theory in ecology. Gen Syst 3:
36-71.
Menhinick EF. 1964. A comparison of some species-individuals diversity indices applied to samples of field insects. Ecology 45:
859-861.
Metzger JP, Bernacci LC, Goldenberg R. 1997. Pattern of tree species diversity in riparian forest fragments of different widths (SE Brazil). Plant Ecol 133: 135-152.
Mishra BP, Tripathi OP, Laloo RC. 2005. Community character- istics of a climax subtropical humid forest of Meghalaya and population structure of ten important tree species. Trop Ecol 46:
241-251.
Mueller-Dombois D, Ellenberg H. 1974. Aims and Methods of Vegetation Ecology. Wiley, New York, 547 pp.
Naiman RJ, Décamps H, Pollock M. 1993. The role of riparian corridors in maintaining regional biodiversity. Ecol Appl 3:
209-212.
Naiman RJ, Décamps H. 1997. The ecology of interfaces: riparian zones. Annu Rev Ecol Syst 28: 621-658.
Natta AK. 2000. Tree species diversity assessment in riparian for- ests using remote sensing, geographical information systems and geostatistics (case study of Toui-Kilibo protected forests in Benin). MS thesis. ITC- Forest Science Division, Enschede, The Netherlands, pp 91.
Neumann M, Starlinger F. 2001. The significance of different in- dices for stand structure and diversity in forests. For Ecol Manage 145: 91-106.
Newbery DM, Gartlan JS. 1996. A structural analysis of rain for- ests at Korup and Douala-Edea, Cameroon. Proc Royal Soc Edinb 104B: 177-224.
Newbold JD, Elwood JW, O’Neill RV, Van Winkle W. 1981.