© 2019 The Korean Ophthalmological Society
This is an Open Access article distributed under the terms of the Creative Commons Attribution Non-Commercial License (http://creativecommons.org/licenses /by-nc/3.0/) which permits unrestricted non-commercial use, distribution, and reproduction in any medium, provided the original work is properly cited.
Original Article
Evaluation of Foveal Avascular Zone and Capillary Plexuses in Diabetic Patients by Optical Coherence Tomography Angiography
Emine Ciloglu, Fikret Unal, Emine Alyamaç Sukgen, Yusuf Koçluk
Department of Ophthalmology, Adana Training and Research City Hospital, Adana, Turkey
Optical coherence tomography angiography (OCTA) is a new imaging technique that enables detailed imaging of
retinal veining by obtaining movement contrast of the erythrocytes in vessels through consecutive optic coher- ence tomography screenings of a specific retinal area. In contrast to fundus fluorescein angiography (FFA), this an- giography method is noninvasive and requires no intrave- nous contrast materials [1-6]. OCTA enables high resolu- tion and rapid imaging of the blood stream in various layers of the retina, and also generates a three-dimensional image belonging to these vascular layers. This feature makes it possible to get a quantitative measurement of the neovascular formation areas as well as blood stream in Purpose: To investigate the foveal avascular zone (AVZ), superficial and deep foveal and parafoveal vessel
density (VD) changes related to diabetic retinopathy.
Methods: Forty-nine type 2 diabetes mellitus (DM) and 45 healthy control subjects were included in this study.
The demographic data (age and sex), disease duration, and level of glycated hemoglobin were collected. Su- perficial VD (%), superficial AVZ area (mm2), deep VD (%) and deep AVZ area (mm2) were evaluated via optic coherence tomography angiography.
Results: Superficial AVZ was 0.438 ± 0.05 mm2 in the DM group, 0.246 ± 0.022 mm2 in the control group (p
< 0.001). Deep AVZ was 0.732 ± 0.06 mm2 in the DM group, and 0.342 ± 0.022 mm2 in the control group (p
< 0.001). Superficial foveal VD was 29.45 ± 0.76 mm2 in the DM group, and 34.86 ± 0.75 mm2 in the control group (p < 0.001). Deep foveal VD was 24.85 ± 1.08 mm2 in the DM group, and 33.47 ± 0.56 mm2 in the con- trol group (p < 0.001).
Conclusions: In this study, we demonstrated an enlargement in the foveal AVZ along with a reduction in the vascular density of the superficial and deep capillary network in the foveal and parafoveal area using optic co- herence tomography angiography in patients with nonproliferative diabetic retinopathy. This technique can be used to monitor the progression of the disease and to evaluate the response to treatment.
Key Words: Capillary plexus, Diabetic retinopathy, Foveal avascular zone, Ischemia, Optic coherence tomogra- phy angiography
Received: March 5, 2018 Final revision: April 30, 2018 Accepted: May 17, 2018
Corresponding Author: Emine Ciloglu, MD. Department of Ophthalmol- ogy, Adana Training and Research City Hospital, Kışla Mah, Dr. Mithat Özsan Blv. No. 1, 01170 Yüreğir, Adana, Turkey. Tel: 90-505-842-1081, E-mail: [email protected]
This manuscript was presented at Turkish Ophthalmological Association 51th National Congress, October 2017, Antalya, Turkey.
these vessels. OCTA facilitates individual analysis of the distinct vascular layers of the retina, namely the superficial and deep capillary plexus. As imaging with FFA is limited with only superficial capillary plexus (SCP), OCTA is su- perior over FFA in terms of its use in the diagnosis of dis- eases that affect deep capillary plexus (DCP). This is a very important advantage since previous studies have shown that the most important vascular changes happen in DCP, and decreased perfusion, ischemia and neovascular- izations in DCP are important in visual prognosis [1,7-9].
In addition the en face imaging mode of OCTA enables imaging of a normal foveal avascular zone (FAZ) like in FFA. As the extension of FAZ is viewed before microaneu- risms appear, and retinopathy is still reversible at this phase, it is very important to measure the FAZ area. Dia- betes mellitus (DM) is characterized by capillary nonper- fusion, vessel hyperpermeability and neovascularization.
After the discovery that early detection and intervention was efficacious in preventing severe vision loss in patients with diabetic retinopathy (DR), subsequent research has focused on new methods for screening diabetic eyes.
OCTA can detect the posterior pole in retinopathy and ischemia areas in the mid-peripheral retina. In OCTA, the shape and size of FAZ can be assessed and FAZ changes can be followed by revealing the deterioration in the peri- foveal microvascular stream reaching the central macula [10,11]. De Carlo et al. [12] reported with OCTA that FAZ was larger in diabetic eyes in comparison to healthy eyes.
Takase et al. [13] reported that retinal microcirculation dis- order in macula could be viewed with OCTA before DR develops in diabetic eyes. These vascular anomalies are re- portedly seen more in DCP [14]. Pruning in macular capil- laries, telangiectasia, microvascular loops, and loop in- crease in capillaries can also be detected with OCTA [6,15].
When using the AngioVue system, the retina-choroid layer is divided into four layers that include the SCP, DCP, outer retina and the choroidal vessels [16-18]. The aim of this study was to investigate the FAZ, and superficial and deep foveal and parafoveal vessel density (VD) changes related to DR.
Materials and Methods
This study included type 2 diabetic patients with non- proliferative diabetic retinopathy (NPDR) and persons
with healthy eyes as the control group. The control group included age-matched subjects who underwent routine ophthalmic examination to our clinic. This prospective cross-sectional observational case-control clinical study was performed according to the Declaration of Helsinki and was approved by the ethics committee (16-2017). All individuals were screened after informed consent was ob- tained. The right eyes of the control subjects and of type 2 DM patients with NPDR were included in the study. De- mographic data (age and sex), disease duration, and level of glycated hemoglobin were also collected. Exclusion cri- teria for both groups were: the presence of glaucoma, age-related macular degeneration, retinal vascular occlu- sion, refractive error >6 diopters, ocular surgery, panreti- nal photocoagulation, intravitreal anti-vascular endothelial growth factor/steroid injection, and proliferative DR. In addition, the exclusion criteria for the control group in- cluded presence of DM.
The diagnosis of DR was based on medical and ophthal- mic history and full ophthalmic examination. DR was graded according to the Early Treatment of Diabetic Reti- nopathy Study classification. All patients underwent com- prehensive ophthalmic examination, which included best corrected visual acuity, refractive error using autorefrac- tometry, slit-lamp biomicroscopic and fundus examination.
FFA and spectral-domain optical coherence tomography were used for retinal assessment. OCTA (Optovue RTVue XR Avanti; Optovue, Fremont, CA, USA) was used for macular retinal vascularization assessment. Superficial VD (%), superficial FAZ area (mm2), deep VD (%) and deep FAZ area (mm2) were evaluated. This instrument has an A-scan rate of 70,000 scans per second and uses a light source centered on 840 nm with a bandwidth of 45 nm.
After setting the image scale to 3 × 3 mm in the software parameters, the FAZ area was evaluated in the superficial and deep vessel plexus using the nonflow area tool from the software, which automatically delineates the FAZ after selecting a segment of it. The superficial retinal, deep reti- nal vascular networks were generated by using an auto- mated software algorithm (Fig. 1).
The en face image was then automatically segmented with an inner boundary 3 µm beneath the internal limiting membrane and an outer boundary 15 µm beneath the inner plexiform layer to obtain images of the SCP. The segmenta- tion was carried out with an inner boundary 15 µm beneath the inner plexiform layer and an outer boundary 70 µm
beneath the inner plexiform layer in order to obtain DCP images. The parafoveal VD was calculated for the ring- shaped area between a 0.3 and 1.25 mm radius from the center of the macula. Parafoveal VD is defined as the per- centage of total area occupied by vessels and microvascula- ture, and was quantified in the SCP and DCP. The An- gioVue Analytics software (Optovue) was used to calculate the VD to extract a binary image of the blood vessels from the grey scale OCTA image and then calculate the percent-
age of pixels with flow signal greater than the threshold in the defined region (Fig. 2).
Statistical analyses were performed using the IBM SPSS Statistics ver. 20.0 (IBM Corp., Armonk, NY, USA). The Kolmogorov-Smirnov test was used to assess the appropri- ateness of calculations for a normal distribution. In para- metric comparisons, the Student t-test was used for two in- dependent groups. The Mann-Whitney U-test was used for variables without a normal distribution. A 5% level of sig-
Fig. 1. Macular perfusion parameters of a 3 × 3 mm2 angiography scan size using optical coherence tomography angiography. The fove- al avascular zone is automatically delineated by the software and represented by the color yellow.
Fig. 2. Images of the macular region and the sections where vessel densities are calculated.
nificance was adopted and results with a p-value <0.05 were considered significant.
Results
Patients
Forty-nine DM (25 male, 24 female) and 45 healthy con- trol subjects (25 male, 20 female) were included. The mean age was 56.61 ± 1.33 years in the DM group and 54.09 ± 1.49 yeaers in the control group. DM subjects had a mean disease duration of 13.65 ± 0.66 years (16 subjects had less than 10 years, 33 subjects had more than 10 years). All pa- tients had NPDR, 26 (53%) patients had macular edema, 23 (47%) patients had not macular edema. The mean gly- cated hemoglobin A1c level was 6.8 ± 1.5%.
OCTA findings
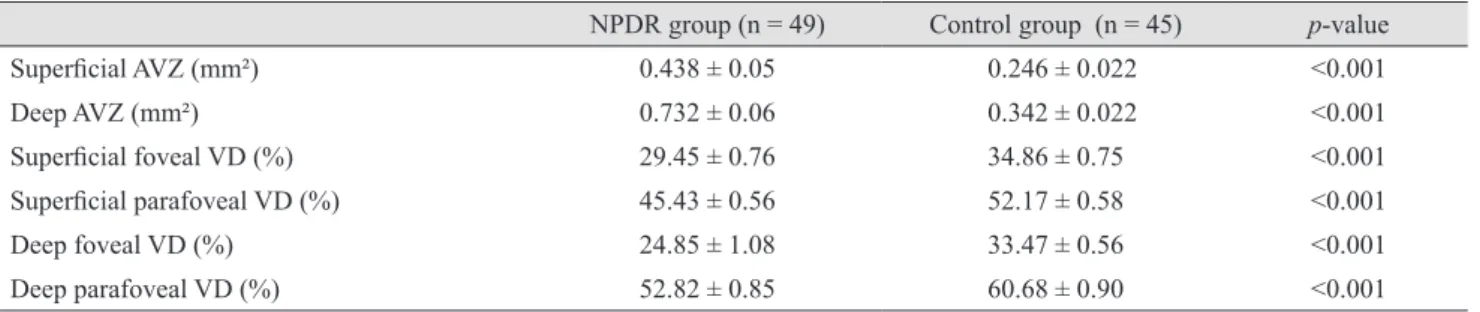
Superficial avascular zone (AVZ) was 0.438 ± 0.05 mm2 in the DM group, and 0.246 ± 0.022 mm2 in the control group (p < 0.001). Deep AVZ was 0.732 ± 0.06 mm2 in the DM group, and 0.342 ± 0.022 mm2 in the control group (p
< 0.001). Superficial foveal VD was 29.45 ± 0.76 mm2 in the DM group, and 34.86 ± 0.75 mm2 in the control group (p < 0.001). Deep foveal VD was 24.85 ± 1.08 mm2 in the DM group, and 33.47 ± 0.56 mm2 in the control group (p <
0.001). Parafoveal VD at the SCP and DCP was significant- ly decreased compared with that in the controls (p < 0.001) (Table 1). The patients with macular edema had a deeper AVZ than DM patients without edema (p < 0.05). No dif- ference was observed between the groups with or without edema in terms of the other parameters (Table 2). There
were ten patients with peripheral ischemia and 39 patients with no ischemia. We could not find any significant differ- ences between the groups (Table 3). When parameters were evaluated according to duration of diabetes (<10 and
>10 years), it was not significantly associated with any of the OCTA parameters in diabetic patients (Table 4).
Discussion
In our study, we first aimed to compare diabetic patients with the non-diabetic healthy individuals. Then, we aimed to compare diabetic patients grouped according to duration of diabetes, presence of macular edema and peripheral ischemia. This study evaluated the FAZ area and VD of the foveal and parafoveal capillary network, using OCTA in patients with NPDR. Results from this study indicated that foveal and parafoveal VD in the SCP and DCP de- creased and that foveal and parafoveal AVZ in the SCP and DCP increased when compared to the control subjects.
It has been reported that retinal blood flow decreases in patients with type 2 DM who have no or mild DR, sug- gesting that the retinal microvasculature is impaired in early-stage DR, even in patients with no evidence of reti- nopathy [16]. Previous histologic studies have shown capil- lary nonperfusion to be an important feature of this vascu- lar disease [17]. In the literature, there are a lot of studies reporting qualitative and quantitative OCTA metrics in di- abetic patients [12,13,18,19]. Takase et al. [13] showed that in diabetic patients without DR, the FAZ is enlarged in the SCP and DCP. Freiberg et al. [14] reported FAZ diameter enlargement in DR, which was most pronounced in the DCP and correlated with visual acuity. Al-Sheikh et al. [20]
found an enlargement of the AVZ area and a reduction in
Table 1. Baseline patient characteristics
NPDR group (n = 49) Control group (n = 45) p-value
Superficial AVZ (mm²) 0.438 ± 0.05 0.246 ± 0.022 <0.001
Deep AVZ (mm²) 0.732 ± 0.06 0.342 ± 0.022 <0.001
Superficial foveal VD (%) 29.45 ± 0.76 34.86 ± 0.75 <0.001
Superficial parafoveal VD (%) 45.43 ± 0.56 52.17 ± 0.58 <0.001
Deep foveal VD (%) 24.85 ± 1.08 33.47 ± 0.56 <0.001
Deep parafoveal VD (%) 52.82 ± 0.85 60.68 ± 0.90 <0.001
Values are presented as the mean ± standard deviation.
NPDR = nonproliferative diabetic retinopathy; AVZ = avascular zone; VD = vessel density.
retinal capillary density in the SCP and DCP in eyes with DR. In our study, we also detected an increased AVZ in both the SCP and DCP of patients with NPDR in compari- son to control subjects. OCTA and analytic software have facilitated automated processing of macular perfusion
data. Kim et al. [18] have detected progressively decreasing capillary density, branching complexity and progressively increasing average vascular caliber in eyes with different stages of DR. They have not been able to detect a signifi- cant difference in these variables between healthy subjects Table 2. The measurements in NPDR patients with or without DME
NPDR DME (+) NPDR DME (-) p-value
Age (yr) 58.31 ± 1.50 54.70 ± 2.25 0.180
Duration of diabetes (yr) 13.65 ± 0.93 13.65 ± 0.95 >0.05
Superficial AVZ (mm²) 0.435 ± 0.12 0.452 ± 0.24 >0.05
Deep AVZ (mm²) 0.849 ± 0.045 0.650 ± 0.10 0.012
Superficial foveal VD (%) 30.40 ± 1.15 28.24 ± 1.60 >0.05
Superficial parafoveal VD (%) 46.87 ± 0.99 48.06 ± 1.00 >0.05
Deep foveal VD (%) 25.13 ± 1.38 26.90 ± 1.70 >0.05
Deep parafoveal VD (%) 52.91 ± 1.01 54.85 ± 1.06 >0.05
Values are presented as the mean ± standard deviation.
NPDR = nonproliferative diabetic retinopathy; DME = diabetic macular edema; AVZ = avascular zone; VD = vessel density.
Table 3. The measurements in NPDR patients with or without ischemia
NPDR ischemia (+) NPDR ischemia (-) p-value
Age (yr) 56.20 ± 2.57 56.72 ± 1.55 0.878
Duration of diabetes (yr) 16.30 ± 1.77 12.97 ± 0.66 0.077
Superficial AVZ (mm²) 0.423 ± 0.05 0.450 ± 0.12 >0.05
Deep AVZ (mm²) 0.670 ± 0.08 0.776 ± 0.05 >0.05
Superficial foveal VD (%) 27.92 ± 2.35 29.71 ± 1.05 >0.05
Superficial parafoveal VD (%) 48.92 ± 0.78 47.05 ± 0.85 >0.05
Deep foveal VD (%) 26.76 ± 1.98 25.76 ± 1.26 >0.05
Deep parafoveal VD 56.02 ± 1.30 55.13 ± 0.80 >0.05
Values are presented as the mean ± standard deviation.
NPDR = nonproliferative diabetic retinopathy; AVZ = avascular zone; VD = vessel density.
Table 4. The measurements of patients with diabetes for less than 10 years and more than 10 years
DM <10 yr DM >10 yr p-value
Age (yr) 52.62 ± 3.06 58.55 ± 1.21 0.088
Duration of diabetes (yr) 8.50 ± 0.45 16.15 ± 0.57
Superficial AVZ (mm²) 0.410 ± 0.05 0.458 ± 0.12 >0.05
Deep AVZ (mm²) 0.755 ± 0.12 0.756 ± 0.18 >0.05
Superficial foveal VD (%) 32.04 ± 1.48 29.25 ± 1.03 >0.05
Superficial parafoveal VD (%) 46.80 ± 1.33 47.97 ± 1.3 >0.05
Deep foveal VD (%) 30.05 ± 2.00 26.04 ± 1.20 >0.05
Deep parafoveal VD (%) 52.90 ± 2.05 55.01 ± 1.04 >0.05
Values are presented as the mean ± standard deviation.
DM = diabetes mellitus; AVZ = avascular zone; VD = vessel density.
and patients with mild nonproliferative DR. Agemy et al.
[19] observed significantly reduced density in the SCP and DCP in mild NPDR in comparison to control subjects.
Hwang et al. [10] described a similar decrease in VD in 12 patients with DR compared to healthy controls. Our find- ings were consistent with results from these studies; foveal VD was decreased at both the SCP and DCP. Additionally, we measured parafoveal VD. Similarly, it was decreased at both the SCP and DCP. Macular edema can develop in ev- ery stage of DR. Tang et al. [21] did not observe any statis- tically significant association between OCTA metrics and the presence of diabetic macular edema (DME) on SCP.
Lee et al. [22] recently demonstrated that eyes with DME have an enlarged AVZ area and lower vascular density only at DCP, but not SCP, compared with eyes without DME. In our study, we observed an enlargement of deep AVZ in the eyes with DME compared to those without DME. This might be due to microvascular alternations oc- curring at the DCP, not at the superficial plexus during the pathogenesis of DME. However, it should be considered that Freiberg et al. [14] reported that the performance of the automated segmentation of the deep vascular layer is suboptimal in patients with DME. According to their re- port, the default definition of the borders of the deep vas- cular layer results in a fixed slab thickness of 55 microns.
Thus, the outer vasculature of the deep vascular layer is regularly outside the slab. Measurement techniques that lead to more reliable results in DME can be developed.
More work is needed in this regard. Multiple properties, including distance from the larger arterioles, proximity to high metabolic demand of the outer retina and the com- plexity of the vascular anatomical architecture may make the DCP more susceptible to diabetic damage [23]. In our study, there were ten patients with peripheral ischemia and 39 patients with no ischemia. There was no significant dif- ference between the groups. After further subdivision of the DR group based on the duration of diabetes, we ob- served no difference at AVZ, VD at the SCP and DCP be- tween the groups. The duration of diabetes is considered a risk factor for the development of retinopathy, so we antic- ipated that we would observe a difference between the groups. Although the two subgroups had different dura- tions of diabetes, subjects from the two groups had similar baseline clinical findings like NPDR at the beginning.
In conclusion, in this study, we demonstrated an enlarge- ment in FAZ along with a reduction of vascular density of
the superficial and deep capillary network in the foveal and parafoveal area using OCTA in patients with NPDR.
Deeper AVZ was found in patients with DME compared to patients without DME. We found that the presence of peripheral ischemia did not affect the parameters in NPDR patients. To prove this, additional studies are needed. DM progressively impairs the microvascular structures of reti- nal vessels, resulting in DR. OCTA allows a precise visual- ization of these changes, circumventing the risk from in- vasive conventional angiography.
Conflict of Interest
No potential conflict of interest relevant to this article was reported.
References
1. Wylegala A, Teper S, Dobrowolski D, Wylegala E. Optical coherence angiography: a review. Medicine (Baltimore) 2016;95:e4907.
2. Kim DY, Fingler J, Zawadzki RJ, et al. Optical imaging of the chorioretinal vasculature in the living human eye. Proc Natl Acad Sci U S A 2013;110:14354-9.
3. Coscas G, Lupidi M, Coscas F. Heidelberg Spectralis opti- cal coherence tomography angiography: technical aspects.
Dev Ophthalmol 2016;56:1-5.
4. Jia Y, Bailey ST, Hwang TS, et al. Quantitative optical coher- ence tomography angiography of vascular abnormalities in the living human eye. Proc Natl Acad Sci U S A 2015;112:E2395- 402.
5. Spaide RF, Klancnik JM Jr, Cooney MJ. Retinal vascular layers imaged by fluorescein angiography and optical co- herence tomography angiography. JAMA Ophthalmol 2015;133:45-50.
6. de Carlo TE, Romano A, Waheed NK, Duker JS. A review of optical coherence tomography angiography (OCTA). Int J Retina Vitreous 2015;1:5.
7. Turgut B. Optical coherence tomography angiography: a general view. Eur Ophthalmic Rev 2016;10:39-42.
8. Rahimy E, Sarraf D, Dollin ML, et al. Paracentral acute middle maculopathy in nonischemic central retinal vein occlusion. Am J Ophthalmol 2014;158:372-80.
9. Christenbury JG, Klufas MA, Sauer TC, Sarraf D. OCT
angiography of paracentral acute middle maculopathy as- sociated with central retinal artery occlusion and deep cap- illary ischemia. Ophthalmic Surg Lasers Imaging Retina 2015;46:579-81.
10. Hwang TS, Gao SS, Liu L, et al. Automated quantification of capillary nonperfusion using optical coherence tomogra- phy angiography in diabetic retinopathy. JAMA Ophthal- mol 2016;134:367-73.
11. Di G, Weihong Y, Xiao Z, et al. A morphological study of the foveal avascular zone in patients with diabetes mellitus using optical coherence tomography angiography. Graefes Arch Clin Exp Ophthalmol 2016;254:873-9.
12. de Carlo TE, Chin AT, Bonini Filho MA, et al. Detection of microvascular changes in eyes of patients with diabetes but not clinical diabetic retinopathy using optical coherence tomography angiography. Retina 2015;35:2364-70.
13. Takase N, Nozaki M, Kato A, et al. Enlargement of foveal avascular zone in diabetic eyes evaluated by en face optical coherence tomography angiography. Retina 2015;35:2377- 83.
14. Freiberg FJ, Pfau M, Wons J, et al. Optical coherence to- mography angiography of the foveal avascular zone in dia- betic retinopathy. Graefes Arch Clin Exp Ophthalmol 2016;254:1051-8.
15. Lumbroso B, Huang D, Jia Y, et al. Clinical guide to an- gio-OCT: non invasive, dyeless OCT angiography. 1st ed.
New Delhi: Jaypee Brothers Medical Publishers; 2015. p.
1-110.
16. Nagaoka T, Sato E, Takahashi A, et al. Impaired retinal circulation in patients with type 2 diabetes mellitus: retinal laser Doppler velocimetry study. Invest Ophthalmol Vis Sci 2010;51:6729-34.
17. Durham JT, Herman IM. Microvascular modifications in diabetic retinopathy. Curr Diab Rep 2011;11:253-64.
18. Kim AY, Chu Z, Shahidzadeh A, et al. Quantifying micro- vascular density and morphology in diabetic retinopathy using spectral-domain optical coherence tomography angi- ography. Invest Ophthalmol Vis Sci 2016;57:OCT362-70.
19. Agemy SA, Scripsema NK, Shah CM, et al. Retinal vascu- lar perfusion density mapping using optical coherence to- mography angiography in normals and diabetic retinopathy patients. Retina 2015;35:2353-63.
20. Al-Sheikh M, Akil H, Pfau M, Sadda SR. Swept-source OCT angiography imaging of the foveal avascular zone and macular capillary network density in diabetic retinopa- thy. Invest Ophthalmol Vis Sci 2016;57:3907-13.
21. Tang FY, Ng DS, Lam A, et al. Determinants of quantita- tive optical coherence tomography angiography metrics in patients with diabetes. Sci Rep 2017;7:2575.
22. Lee J, Moon BG, Cho AR, Yoon YH. Optical coherence to- mography angiography of DME and its association with an- ti-VEGF treatment response. Ophthalmology 2016;123:2368- 75.
23. Nakahara T, Hoshino M, Hoshino S, et al. Structural and functional changes in retinal vasculature induced by retinal ischemia-reperfusion in rats. Exp Eye Res 2015;135:134-45.