Article http://dx.doi.org/10.14478/ace.2015.1028
분무열분해법으로
CeO 2 :Er/Yb 형광체 제조 및 발광특성 최적화
정경열
†
⋅박재훈⋅송신애*공주대학교 화학공학부, *한국생산기술연구원 마이크로제조시스템기술센터 (2015년 3월 6일 접수, 2015년 4월 9일 심사, 2015년 4월 10일 채택)
Preparation and Luminescence Optimization of CeO 2 :Er/Yb Phosphor Prepared by Spray Pyrolysis
Kyeong Youl Jung † , Jea Hoon Park, and Shin Ae Song
*Department of Chemical Engineering, Kongju National University, 1223-24 Cheonan-Daero, Seobuk-gu, Cheonan, Republic of Korea
*
Energy Materials Research Center, Korea Research Institute of Chemical Technology, Sinseongno 19, P.O.Box 107, Daejeon 305-600, Republic of Korea
(Received March 6, 2015; Revised April 9, 2015; Accepted April 10, 2015)
초 록
분무열분해법을 이용하여 서브 미크론 크기의 CeO 2 :Er 3+ /Yb 3+ 상향 변환 형광체 입자를 합성하고 Er 3+ 및 Yb 3+ 농도 변화에 따른 발광특성을 조사하였다. 합성한 CeO 2 :Er 3+ /Yb 3+ 는 Er 3+ 활성이온의 4 S 3/2 / 2 H 11/2 → 4 I 15/2 및 4 F 9/2 → 4 I 15/2 전이 에 기인한 강한 녹색 및 적색 발광을 보였다. 가장 높은 발광을 보이는 활성제 농도는 Er = 1.0% 그리고 Yb = 2.0%이 며, 농도소광 현상은 쌍극자-쌍극자 상호작용을 통해 일어남이 확인되었다. 레이저 다이오드 여기 광 세기에 대한 발 광강도 의존성을 활성이온 농도에 따라 조사하였고, 발광 중간 에너지 레벨의 주 소멸과정을 고려하여 발광 메커니즘 을 조사하였다. Yb 3+ 에서 Er 3+ 으로 에너지 전달은 바닥 상태 흡수(ground state absorption, GSA)에 기여하고, Yb 3+ 도핑 은 4 I 11/2 → 4 I 13/2 전이를 가속화시켜 적색/녹색 발광세기 비를 상승시킨다. 최종적으로 분무열분해법으로 제조된 CeO 2 :Er 3+ /Yb 3+ 형광체의 발광은 선형 감쇠가 중간 에너지 레벨의 고갈을 지배하는 2 광자 프로세스에 의해 일어남을 확인하였다.
Abstract
Submicron-sized CeO 2 :Er 3+ /Yb 3+ upconversion phosphor particles were synthesized by spray pyrolysis, and their luminescent properties were characterized by changing the concentration of Er 3+ and Yb 3+ . CeO 2 :Er 3+ /Yb 3+ showed an intense green and red emission due to the 4 S 3/2 or 2 H 11/2 → 4 I 15/2 and 4 F 9/2 → 4 I 15/2 transition of Er 3+ ions, respectively. In terms of the emission intensity, the optimal concentrations of Er and Yb were 1.0 % and 2.0%, respectively, and the concentration quenching was found to occur via the dipole-dipole interaction. Upconversion mechanism was discussed by using the dependency of emission intensities on pumping powers and considering the dominant depletion processes of intermediate energy levels for the red and green emission with changing the Er 3+ concentration. An energy transfer from Yb 3+ to Er 3+ in CeO 2 host was mainly involved in ground-state absorption (GSA), and non-radiative relaxation from 4 I 11/2 to 4 I 13/2 of Er 3+ was accelerated by the Yb 3+
co-doping. As a result, the Yb 3+ co-doping led to greatly enhance the upconversion intensity with increasing ratios of the red to green emission. Finally, it is revealed that the upconversion emission is achieved by two photon processes in which the linear decay dominates the depletion of intermediate energy levels for green and red emissions for CeO 2 :Er 3+ /Yb 3+ phosphor.
Keywords: Upconversion phosphor, Spray pyrolysis, Energy transfer, two-photon process
1. Introduction
1)Upconversion (UC) materials converting near-infrared (NIR) into visible light have drawn great attention in many research areas such as
† Corresponding Author: Kongju National University,
Department of Chemical Engineering, 1223-24 Cheonan-Daero, Seobuk-gu, Cheonan, Republic of Korea
Tel: +82-41-554-2640 e-mail: [email protected]
pISSN: 1225-0112 eISSN: 2288-4505 @ 2014 The Korean Society of Industrial and Engineering Chemistry. All rights reserved.
bio-imaging, security ink, 3D displays, and solar cells[1-5]. Host mate-
rials for UC phosphors should have low phonon energy to achieve effi-
cient emission. The emission wavelength and upconversion intensity
are influenced by host compositions even though the same activators
are used. A number of materials including fluorides, chlorides, sulfides
and oxides have been considered as the UC host[6-9]. Among these,
most of researches have been performed on fluorides (e.g. NaYF 4 ) due
to their low phonon energy[10-14]. Fluorides not only have weak
chemical and thermal stability, but also can deliquesce with generating
(a)
2 0 3 0 4 0 5 0 6 0 7 0
C e O
2 J C P D S N O 8 1 - 0 7 9 2
In te ns it y[ a. u. ]
2
2 0 3 0 4 0 5 0 6 0 7 0
(3 1 1 ) (2 2 0 ) (2 0 0 ) (1 1 1 )
(4 0 0 ) (2 2 2 )
2 7 2 8 2 9 3 0
In te ns it y[ a. u. ]
2
2 7 2 8 2 9 3 0
(1 1 1 )
(b)
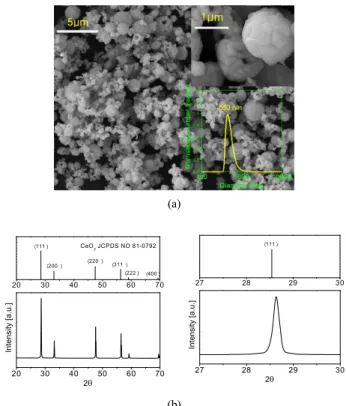
Figure 1. (a) SEM photo (inset-particle size distribution) and (b) XRD pattern of CeO 2 :Er/Yb particles prepared by spray pyrolysis.
HF which causes a safety problem in a preparation procedure, which may be obstacle to their practical application[15]. On the contrary, ox- ide-based UC phosphors have good chemical and thermal properties.
Thus, recently, the development of oxide-based UC phosphors with good optical properties has received great attention for various practical applications.
Suitable selection of oxide matrix is critical to obtain the high emis- sion efficiency for oxide-based UC phosphors. A number of simple ox- ides, such as Y 2 O 3 , Gd 2 O 3 , ZrO 2 , Lu 2 O 3 and La 2 O 3 , have been inves- tigated as a host for UC phosphors due to their low vibrational fre- quencies[16-22]. Recently, CeO 2 was reported as a promising host for UC phosphor because it has low phonon cutoff energy and excellent thermal stability[23-25]. In addition, it has the same crystal structure as erbium and ytterbium, which facilitates the substitution of activators into the CeO 2 host lattices.
To achieve high luminescence, activators and sensitizers should be well distributed into ceria lattices without any phase segregation. Thus, it is important to select a proper synthetic method in terms of prepar- ing high upconversion phosphors. Spray pyrolysis is one of excellent synthetic processes and has been used to prepare multi-component functional materials like phosphor[26-29]. Since one droplet containing precursors is turned to one particle in the spray pyrolysis, all in- gredients in one particle is able to be mixed well at the nanoscale.
Nevertheless, to our best knowledge, there are no reports on the syn- thesis of CeO 2 -based upconversion phosphors via the spray pyrolysis.
In this work, CeO 2 :Er 3+ /Yb 3+ upconversion phosphor particles were synthesized by spray pyrolysis. The concentrations of Er 3+ and Yb 3+
were optimized in terms of the luminescence intensity of CeO 2 :Er 3+ /Yb 3+ . The luminescent quenching property and the upconver- sion mechanism were studied by changing the concentration of Er 3+
and Yb 3+ .
2. Experimental
Ce 1-x-y O 2 :Er 3+ x ,Yb 3+ y upconversion phosphor particles were prepared by a spray pyrolysis process which consists of an ultrasonic aerosol generator with 17 vibrators of 1.7 MHz, a quartz tube (inner diameter
= 55 mm, length = 1000 mm), and a Teflon bag filter. Cerium nitrate (Aldrich, 99%), erbium oxide (Aldrich, 99.99%), and ytterbium oxide (Alfa, 99.99%) were used as the precursor of Ce, Er, and Yb, respectively. 1.0 wt% Er 2 O 3 aqueous solution was prepared according to the following procedure. 1g Er 2 O 3 was first dissolved in nitric acid solution, and followed by adding purified water until the solution weight reaches 100 g. As the same manner, 1.0 wt% solution of Yb 2 O 3
was prepared in advance. The exact quantities of activators required when varying the Er or Yb concentration in the Ce 1-x-y O 2 :Er 3+ x ,Yb 3+ y
phosphor particles was measured by taking the weight of the two acti- vator aqueous solutions prepared in advance. The spray solutions were prepared by dissolving cerium nitrate in the aqueous solution contain- ing each activator. The total concentration of the precursors was fixed at 0.2 M. The Er 3+ (x) concentrations were varied from 0.005 to 0.06, and the Yb concentrations (y) were controlled from 0.01 to 0.07. The
spray solutions were atomized to droplets which were carried by air (30 liter/min) into the quartz tube reactor at 900 ℃. The powders were collected by the Teflon bag filter installed at the end of the quartz reactor. The obtained precursor powders were followed by a thermal treatment at 1300 ℃ for 3 h in a box furnace under an air environment.
The emission properties of the prepared phosphor particles were in- vestigated by using a fluorescence spectrometer (Perkin Elmer, LS 55) under the excitation of 975 nm light pumped by an IR Laser (Optoenergy, PL980P330J). Changes in the emission intensity were monitored by varying the power of the IR source from 100 to 1000 mW. The crystal structure was identified by X-ray diffraction (XRD, Rigaku, D/Max-RB) using Cu K a radiation ( = 1.5418 Å). The mor- phology of the prepared phosphor particles were monitored by using scanning electron microscopy (SEM, TESCAN, MIRA LMH). Particle size distribution was measured by using a particle size analyzer (DLS, Photal Otsuka Electronics).
3. Results and discussion
Figure 1(a) shows the morphology and size distribution of phosphor particles prepared by spray pyrolysis. The particles have spherical shape, but hollow structure. The average particle size is about 580 nm.
The hollow structure indicates that the precipitation of the precursor
salts begins at the surface of droplets because the surface concentration
of salts first reaches the supercritical saturation due to the fast drying
of water. According to the SEM result, no particle agglomeration oc
(a)
(b)
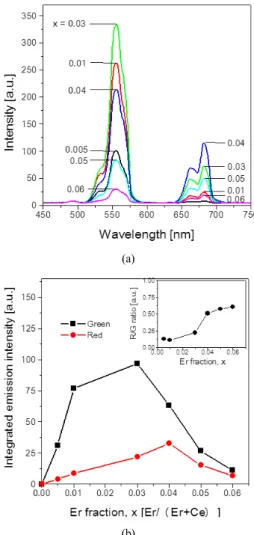
Figure 2. (a) Upconversion emission spectra of Ce 1-x O
2: Erx particles and (b) the emission intensity (inset-the emission ratio of red to green) as a function of Er content.
curs during the post thermal treatment at 1300 °C. To achieve high lu- minescence, phosphors should have high crystallinity and activators should be inserted in host lattice sites. According to the XRD analysis as shown in Figure 1(b), the prepared particles have the cubic fluo- rite-type CeO 2 structure (JCPDS No. 81-0792) without any phase for- mation for Er 2 O 3 and Yb 2 O 3 crystalline. The peak for (111) phase shifts toward a large diffraction angle compared with pure cerium ox- ide, indicating that the rare-earth activators are successfully doped into the host lattice.
Figure 2(a) shows the upconversion spectra of Ce 1-x O 2 :Er x particles prepared by changing the Er concentration. The integrated intensity for green and red emission is shown in Figure 2(b) as a function of the Er concentration. In the green region, the peaks at 537 nm and 556 nm are due to the 2 H 11/2 → 4 I 15/2 and 4 S 3/2 → 4 I 15/2 transitions of Er ions, respectively. The red emission in the wavelength range of 650~
700 nm is attributed to the 4 F 9/2 → 4 I 15/2 transition. As increasing the Er content, the intensity for the green and red emission increases and reaches to the maximum value at x = 0.03 and x = 0.04, respectively.
This means that both of the 4 S 3/2 → 4 I 15/2 and the 4 F 9/2 → 4 I 15/2 tran-
sitions are accelerated simultaneously by increasing the Er concen- tration up to 3% (x = 0.03). When the Er concentration is larger than 3%, there is the concentration quenching which lowers the entire emis- sion intensity. The inset of Figure 2(b) shows the dependence of the R/G ratio (red emission/green emission) on the Er concentration. When the Er content is 3% and larger, the R/G ratio increases, indicating that the non-radiative decay from the 4 S 3/2 level to the red-emitting level ( 4 F 9/2 ) is populated by increasing the Er concentration.
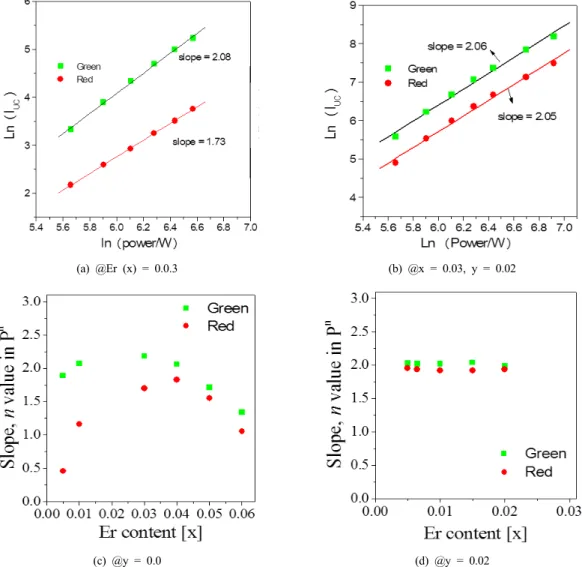
Figure 3(a) and (b) show the Yb 3+ co-doping effect on the emission properties. The Yb 3+ doping clearly enhances both green and red emis- sion due to the resonant energy transfer (ET) from Yb 3+ to Er 3+ [24-25].
The green emission intensity is strongest at y = 0.02 (2% with respect to Ce), whereas for the red emission the concentration quenching be- gins at y = 0.03 (3%). However, the green emission dramatically de- creases when the Yb 3+ content is 3% and larger. As shown in the inset of Figure 3(b), the ratio of red to green in the emission intensity in- creases monotonically with increasing the Yb 3+ concentration. These results indicate that the Yb 3+ doping evidently enhances the absorption of the IR photons, and that the ET processes involved in the red emis- sion are accelerated by increasing the Yb 3+ concentration. In terms of optimizing the emission intensity of CeO 2 :Er 3+ ,Yb 3+ phosphor at y = 0.02, the fine tuning in the Er 3+ concentration was carried out and the results were shown in Figure 3(c) and (d). The highest intensity was observed at x = 0.01 and 0.015 for the green and red emission, respectively. As shown in Figure 3(d), the R/G ratio was also enlarged linearly as increasing the Er 3+ content. This is consistent with the result for the Er concentration effect when no Yb 3+ is co-doped as shown in Figure 2. On the basis of all results obtained from the variation of Er and Yb concentrations, the optimal composition in terms of the total emission intensity was determined as (Ce 0.97 , Er 0.01 , Yb 0.02 )O 2 .
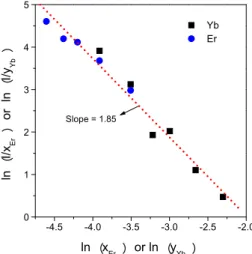
For phosphor materials, a concentration quenching in the emission intensity occurs due to the non-radiative decay of excited photons to the ground state of activators. On the basis of the concentration quenching observed, the critical distance (R c ) for the non-radiative en- ergy transfer can be calculated by the following equation[30].
3
1/32 4
c
c