INTRODUCTION
Diabetic nephropathy and vascular changes remain major complications of diabetes, accounting for up to 40% of cases with end-stage renal disease and 75% of cases with cardio- vascular disease (1). Many studies suggest a key role for hyper- glycemia in the pathogenesis of these complications (2, 3).
Indeed, elevated glucose is known to activate a variety of cells to stimulate extracellular matrix (ECM) synthesis including collagen mediated by stimulating transforming growth fac- tor (TGF)-β(2, 4, 5).
Pathologic changes in the glomerular ECM lead to abnor- mal protein excretion as well as to impairment of glomeru- lar filtration in diabetic nephropathy. Alterations in the dia- betic glomerular basement membrane (GBM) include in- crease in its thickness and decrease in the density of anionic sites (6). The former corresponds to increase in GBM con- tent of collagen forming mesh-like barrier structure which regulates the size-selective aspects of glomerular permselec- tivity (1-3).
GBM are assembled through an interweaving of type IV
collagen (collagen IV) with laminins, nidogen, and sulfated proteoglycans (7-9). Collagen IV belongs to a family of collage- nous proteins that has at least 25 distinct members. The CO- L4A1, COL4A2, COL4A3, COL4A4, COL4A5, and COL4A6 genes encode the six chains of collagen IV, α1(IV) through α6(IV) (9-11). Type IV collagen chains have a highly regu- lated distribution in the glomerulus; α1 and α2 chains are localized to the mesangium, whereas α3 through α6 chains are found mainly in the GBM (9-13). Type IV collagen of GBM is produced by and attached to podocytes, therefore, type IV collagen of GBM is closely related to podocytes. Dys- regulation of GBM collagen chains produces proteinuria and hematuria as seen in Alport’s syndrome and Goodpasture syn- drome clinically (10, 11). However, the dysregulation of cel- lular metabolism of individual chains of type IV collagen in podocytes (glomerular epithelial cells; GEpC) has not been well studied in diabetic nephropathy. Our aim in this study was to investigate the regulation of αchains of type IV col- lagen of podocytes that is responsible for the synthesis of GBM in diabetic condition.
837
Tae-Sun Ha1, Eun-Jeong Hong1, Eun-Mi Ahn1, and Hee-Yul Ahn2
Departments of Pediatrics1and Pharmacology2, Chungbuk National University, Cheongju, Korea
Address for correspondence Tae-Sun Ha, M.D.
Department of Pediatrics, College of Medicine, Chungbuk National University, 48 Gaesin-dong, Heungdeok-gu, Cheongju 361-240, Korea Tel : +82.43-269-6374, Fax : +82.43-264-6620 E-mail : [email protected]
This work was supported by grants from from Korea Science and Engineering Foundation (KOSEF, R01- 2007-000-20856-0) and Korea Research Foundation Grant funded by the Republic of Korea Government (MOEHRD, Basic Research Promotion Fund) (KRF- 2007-E00269).
DOI: 10.3346/jkms.2009.24.5.837
Regulation of Type IV Collagen α α Chains of Glomerular Epithelial Cells in Diabetic Conditions
An early feature of diabetic nephropathy is the alteration of the glomerular basement membrane (GBM), which may result in microalbuminuria, subsequent macropro- teinuria, and eventual chronic renal failure. Although type IV collagen is the main component of thickened GBM in diabetic nephropathy, cellular metabolism of each αchains of type IV collagen has not been well studied. To investigate the regulation of α(IV) chains in diabetic conditions, we examined whether glucose and advanced glycosylation endproduct (AGE) regulate the metabolism of each α(IV) chains in the diabetic tissue and glomerular epithelial cells (GEpC). Glomerular collagen α3(IV) and α5(IV) chains protein were higher and more intense in immunofluorescence staining according to diabetic durations compared to controls. In vitro, mainly high glucose and partly AGE usually increased total collagen protein of GEpC by [3H]- proline incorporation assay and each α(IV) chain proteins including α1(IV), α3(IV), and α5(IV) in time-dependent and subchain-specific manners. However, the changes of each α(IV) chains mRNA expression was not well correlated to the those of each chain proteins. The present findings suggest that the metabolism of individual α(IV) chains of GBM is differentially regulated in diabetic conditions and those changes might be induced not only by transcriptional level but also by post-translational modi- fications.
Key Words : Glycosylation End Products, Advanced; Diabetic Nephropathies; Collagen Type IV; Glucose;
Podocytes
Received : 16 September 2008 Accepted : 16 June 2009
MATERIALS AND METHODS Diabetic animals
Diabetes was induced by a single intravenous injection of streptozotocin (STZ; Sigma Chemical Co., St. Louis, MO, U.S.A.) at 45 mg/kg body weight, freshly dissolved in 0.1 M sterile sodium citrate, pH 4.5, in 6-week-old (180-220 g) male Sprague-Dawley rats. The rats were considered diabetic if blood glucose levels were above 200 mg/dL at 48 hr after STZ injection. The rats remained hyperglycemic throughout experi- ment were sacrificed at 48 hr, 4 weeks and 10 weeks after the induction of diabetes. The right kidney was removed, weighed, cut into portions, and sectioned at 5 μm for the assessment of immunofluorescence (IF).
Cell culture
Rat GEpCs, cloned from primary rat glomerular cultures, were characterized and provided by Kreisberg (14). They were characterized by sensitivity to puromycin aminonucleoside, positive staining for Heymann antigen (gp330) and podoca- lyxin, whereas negative staining for factor VIII (15). GEpCs were maintained as previously described (15). Experiments were performed with cells between passages 15 and 18.
Preparation of culture additives
Cells were serum-deprived to reduce background for 24 hr before each experiment, then exposed to glucose and/or AGE.
Rat GEpCs were incubated in culture media containing either 5 mM glucose with 66 unit/mL insulin or 30 mM glucose (high glucose, HG) without insulin in order to mimic the metabolic environment of type I diabetes mellitus. Advanced glycosylation endproducts (AGE) was produced by the tech- nique previously described by Ha et al. (15). To imitate the long-term diabetic condition, AGE was added (5 μg/mL) and controls were established using unmodified bovine serum albu- min (BSA) (5 μg/mL). To exclude the effect of additionally produced glycated proteins in culture conditions, no longer than 48 hr of incubation was used. Fetal bovine serum (FBS) was reduced to 0.5% on the last media change to reduce back- ground before protein and RNA extraction. For identifica- tion purposes, coating with AGE or BSA was denoted as ‘A’
or ‘B’, and addition of glucose at 5 or 30 mM by ‘5’ or ‘30’, respectively. Their meaning of each condition described before (15).
[3H]-proline incorporation
Collagen synthesis was assessed by measurement of cellu- lar [3H]-proline uptake. For all experiments, [3H]-proline (PerkinElmer, Boston, MA, U.S.A.) was added to each well at a final concentration of 1 μCi/mL for the last 24 hr in trip-
licate. After incubation, the media was removed and the cells were washed with ice-cold 10% trichloroacetic acid (TCA) for 30 min at 4℃. After two rinses with cold 10% TCA, the acid-precipitable material was solubilized overnight in 1N NaOH at 37℃and neutralized with 1N HCl per well. Total protein was determined from an aliquot of each well by Brad- ford assay (Sigma Chemical Co., St. Louis, MO, U.S.A.). Incor- porated radioactivity (dpm) from the resultant supernatant was measured in a liquid scintillation counter and was ex- pressed as percent of control.
Cellular protein extraction
For measuring collagen, cell extracts were prepared from rat GEpCs grown for each duration period under different condi- tions as described before. At the end of incubation, the con- fluently grown cell layers were washed twice with phosphate- buffered saline and subsequently extracted in 4 M guanidi- nium-HCl, 2% CHAPS, and protease inhibitors containing 100 mM 6-aminohexanoic acid, 10 mM benzamidine HCl, and 1 mM phenylmethylsulfonyl fluoride (PMSF) at 4℃ overnight and stored at -20℃till further analysis. Protein concentrations were determined with a Bio-Rad kit (Bio-Rad Laboratories, Hercules, CA, U.S.A.).
Western blotting of collagen ααchains
Thirty μg of boiled extracts was applied on 10% SDS-PAGE gels and transferred to polyvinylidene fluoride membranes (Bio-Rad Laboratories). Then, the membranes were air-dried and blocked in 3% fat-free milk before incubation with mon- oclonal goat anti-rat collagen α1, α3, and α5 chains (Santa Cruz Biotechnology, Santa Cruz, CA, U.S.A.). After incuba- tion with horseradish peroxidase-conjugated secondary anti- bodies, bands were detected by using the ECL chemilumines- cence system (Amersham Biotech Ltd., Bucks, U.K.). Each band density was measured using densitometry program (Lab- Works 4.0, UVP Inc., Upland, CA, U.S.A.) and controlled by β-actin amounts.
RT-PCR analysis of collagen ααchains
Total RNA was extracted from cultured rat GEpC as pre- viously described (15). After estimating its concentration by UV spectrophotometry, 5 μg of total RNA was used for first- strand cDNA synthesis. Aliquots of the cDNA were ampli- fied using primers for collagen α1(IV): sense 5′-TCGGCTA- TTCCTTCGTGATG-3′and anti-sense 5′-TCTCGCTTC- TCTCTATGGTG-3′; α3(IV): sense 5′-ATCCTGGTCTTC- CTGGACCT-3′and anti-sense 5′-CCATCTCACCAGGA- CAACCT-3′; collagen α5(IV): sense 5′-ATGCTGACTAG- CAACCATGA-3′and anti-sense 5′-GCCAGATCACATC- TAAATGA-3′. The expression of GAPDH as RNA control was analyzed employing the following primers: sense 5′-CT-
CTACCCACGGCAAGTTCAA-3′and anti-sense 5′-GGA- TGACCTTGCCCACAGC-3′. PCR products were visual- ized on 2% agarose gels, and band density was measured using densitometry program as Western blotting.
Statistics
The data (cpm per mg cell protein) in each condition of incubation from at least three experiments were expressed as mean±SD if not remarked and compared by Student’s t test; P<0.05 was considered to be statistically significant.
RESULTS
Increased intensity of αα(IV) chains in diabetic glomeruli
Double-staining of α5(IV) with P-cadherin and α3(IV) showed colocalization in podocyte foot processes around cap- illary loops in rat glomeruli (Fig. 1A). The observed tissues were obtained at 48 hr, 4 weeks and 10 weeks after the induc- tion of diabetes, of them, urinary albumin excretion increased significantly only in the prolonged diabetic rat (24.5 mg/day at 10 weeks vs. less than 4 mg/day at 48 hr and 4 weeks). IF microscopy of kidney stained with anti-α3(IV) and α5(IV) antibodies showed that the increased and more intense stain- ings of glomerular capillary α3(IV) and α5(IV) chains were observed according to diabetic durations compared to con- trols (Fig. 1B). There were no glomerular stainings in pri- mary antibodies-negative controls (figures not shown). We also found that there were glomerular hypertrophy and scle- rosis in the advanced diabetic kidneys.
High glucose increases [3H]-proline incorporation
Compared to incubation of GEpC with 5 mM glucose (B5), 30 mM glucose without insulin (B30), AGE with 5 mM glu- cose (A5), and AGE with 30 mM glucose (A30) for 48 hr resulted in 55.5%, 20.6, and 50.3% increase in [3H]-proline incorporation, respectively (Fig. 2). Therefore, the increase in
[3H]-proline incorporation meaning collagen synthesis might be induced mainly by high glucose.
High glucose increases ααchains of type IV collagen by western analysis
The protein amounts of novel glomerular collagen αchains proteins, α3(IV) and α5(IV) chains, were compared with that
×1,000). (B) Immunofluorescence microscopy of rat kidney tissue stained with anti-α3(IV) and α5(IV) antibodies at each experimental time (magnification ×400). The further diabetic nephropathy advanced, the more intense stainings of α3(IV) and α5(IV) chains along the glomerular capillaries were observed compared with those of age-matched controls.
Fig. 1. Immunofluorescence staining of α3(IV) and α5(IV) in rat tissues. (A) Double-staining of α5(IV) with P-cadherin and α3(IV) showed colocalization in podocyte foot processes around cap- illary loops in rat glomeruli at 48 hr of diabetes (magnification
A P-cadherin α5(IV) collagen merged
α3(IV) collagen α5(IV) collagen merged
Controlα3(IV)α5(IV) DiabeticControlDiabetic B
48 hr 4 weeks 10 weeks
Fig. 2. [3H]-Proline incorporation by high glucose and AGE. High glucose increased [3H]-proline incorporation of GEpC significant- ly (*P<0.05).
% of control (B5)
200
150
100
50
0 A5 A30 B5 B30 Aosm
Culture conditions
120.6
150.3
100
* *
155.5
106.3
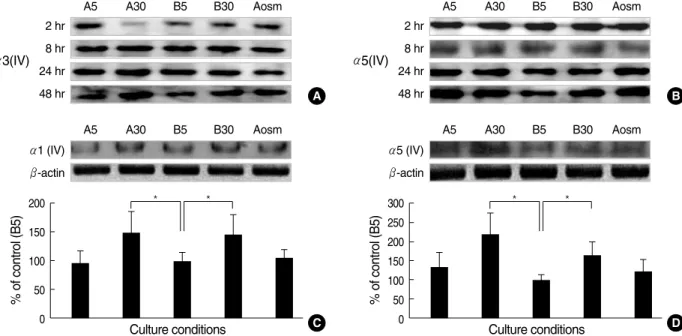
of condition B5 at 2, 8, 24, and 48 hr incubation time. Both α3(IV) and α5(IV) chains, were not changed initially, then, increased at 48 hr by high glucose (Fig. 3A, B). AGE did not showed any additive effect on the novel αchains proteins, although α5(IV) chain protein increased somewhat since 24 hr incubation. Then, we observed the changes of α1(IV) and α5(IV) chains proteins at 48 hr incubation.
Densitometric analysis of α1(IV) chain by Western blot-
ting revealed a 46% increase in high glucose condition (B30) and 50% increase in high glucose and AGE condition (A30) at 48 hr incubation compared to B5 (n=3, P<0.05, both, Fig.
3C). However, these changes were not found in the A5 and osmotic control (Aosm). α5(IV) chain also revealed a 66%
increase in high glucose condition (B30) and 2.2 fold increase in high glucose and AGE condition (A30) compared to B5 (n=3, P<0.05, both, Fig. 3D). However, these changes were
Fig. 3. Effects of glucose and AGE on the α(IV) chains protein in cultured GEpC assayed by Western blotting. (A) Sequential changes of α3(IV) proteins, (B) Sequential changes of α5(IV) proteins ; Both α3(IV) and α5(IV) chains were not changed initially, then, increased at 48 hr by high glucose, (C) High glucose (B30 and A30) increased the amounts of α1(IV) proteins significantly compared with group B5, (D) High glucose (B30 and A30) increased the amounts of α5(IV) proteins significantly compared with group B5. Data on the densitometric analysis of α1(IV) and α5(IV)/β-actin ratio are expressed as mean±SD. Control (100%); the value of B5. *P<0.05 versus control.
2 hr 8 hr 24 hr 48 hr
A5 A30 B5 B30 Aosm
α3(IV)
A
2 hr 8 hr 24 hr 48 hr
A5 A30 B5 B30 Aosm
α5(IV)
B
α1 (IV) β-actin
A5 A30 B5 B30 Aosm
α5 (IV) β-actin
A5 A30 B5 B30 Aosm
C D
% of control (B5)
200 150 100 50
0 Culture conditions
* *
% of control (B5)
300 250 200 150 100 50
0 Culture conditions
* *
Fig. 4. Regulation of α(IV) chains mRNA in cultured GEpC assayed by RT-PCR. Sequential changes of α1(IV) mRNA (A), α3(IV) mRNA (B), α5(IV) mRNA (C). (D) High glucose and AGE (A30) increased the amounts of α1(IV) mRNA significantly at 48 hr incubation compared with group B5. Change of α3(IV) mRNA (E) and α5(IV) mRNA (F) at 48 hr incubation. Data on the densitometric analysis of each α(IV)/GAPDH ratio are expressed as mean±SD. Control (100%); the value of B5. *P<0.05.
2 hr 8 hr 24 hr 48 hr
A5 A30 B5 B30 Aosm
α1(IV)
A
α1(IV) GAPDH
A5 A30 B5 B30 Aosm
D
2 hr 8 hr 24 hr 48 hr
A5 A30 B5 B30 Aosm
α3(IV)
B C
2 hr 8 hr 24 hr 48 hr
A5 A30 B5 B30 Aosm
α5(IV)
% of control (B5)
200 150 100 50
0 Culture conditions
*
α3(IV) GAPDH
A5 A30 B5 B30 Aosm
E
% of control (B5)
200 150 100 50
0 Culture conditions
α5(IV) GAPDH
A5 A30 B5 B30 Aosm
F
% of control (B5)
150
100
50
0 Culture conditions
not found in the A5 and osmotic control (Aosm) as the results of α1(IV) chain. The increased amount of α1 and α5 chains protein in high glucose-added conditions (B30 and A30) was much more than that of A5 and Aosm, implying that high glucose might have more influence on the amount of α1 and α5 chains protein of GEpC than AGE and osmolality.
Gene expression of ααchains of type IV collagen by high glucose and AGE
The expression levels of mRNA for α1(IV), α3(IV), and α5(IV) in each condition were compared with that of condi- tion B5 at 2, 8, 24, and 48 hr incubation time. GAPDH mRNA was not significantly different in all PCR products.
According to incubation time, mRNA expression of each α chain showed the slightly increasing tendency in chain-dif- ferent manners, however, their significances were rare (Fig.
4A-C). Then, we observed the changes of each chains expres- sion at 48 hr incubation.
There were significantly increased α1(IV) chain mRNA only in A30 condition (25%, compared with B5 (P<0.05), however, no significant changes in the other conditions (Fig.
4D). And, there are no significant changes of α3(IV) and α5(IV) chains mRNA in any conditions (Fig. 4E, F). Fig. 4C showed that the expression levels of mRNA for α5(IV) in each con- dition increased compared with those of condition B5 at early stages, 2, 8, and 24, however, not at 48 hr incubation time in Fig. 4F.
DISCUSSION
Diabetic glomerulopathy is characterized by thickening of the GBM and expansion of the mesangial matrix (6, 16). An early feature of diabetic nephropathy is the alteration of the glomerular basement membrane (GBM), which may result in microalbuminuria, subsequent overt proteinuria, and even- tual renal failure (1, 3). As for the GBM, its conspicuous thick- ening in diabetes, perhaps due to accumulation of collagen IV and alterations in its architecture and composition (6, 16, 17), would seem to constitute a more effective barrier to the filtration of proteins but is in fact more porous to proteins (18). The glomerular visceral epithelial cell, called podocyte is also affected by the early pathologic changes in diabetic glomerulopathy, including overproduction of cytokines such as VEGF and TGFβ, widened foot processes width (hyper- trophy), podocytopenia, and the dysregulation of GBM com- ponents, all of which contribute to the initiation of protein- uria and progression of renal disease (18-20). Because the onset and progression of diabetic glomerulosclerosis are delayed in patients who achieve an adequate level of glycemic control (21), hyperglycemia is thought to be an important regulator of glomerular lesion development.
GBM is composed of several macromolecules, including
type IV collagen, laminin, proteoglycan, and entactin (7-9).
Type IV collagen, which includes six genetically distinct iso- forms named α1(IV) through α6(IV) (9-11), is the most abun- dant constituent of the GBM (7-9, 12). These isoforms orga- nize themselves into a unique network, which provides GBM structural stability and unique functionality (7, 12). Differ- ent isoforms of type IV collagen are specific for each glomeru- lar compartment. The novel α3(IV), α4(IV), and α5(IV) chains are predominantly associated with the GBM, while classical α1(IV) and α2(IV) chains are present in the mesangial matrix (9-13, 16).
At all developmental stages of kidney morphogenesis, α1 and α2(IV) chains were seen in basement membranes. Col- lagen α3-5(IV) chains, on the other hand, were not found in fetal nephron at the primary vesicle, S-shaped body and cap- illary loop stages but emerged during later development of the nephron. This is in line with earlier studies on rat tissues suggesting that in the rat, α3-5(IV) chains are first expressed and start replacing α1 and α2(IV) chains in glomerulus at the capillary loop stage (22). In the human kidney, however, this switch seems to appear at a distinctly later stage of develop- ment, reflecting species-specific differences in kidney develop- ment. Human kidney also shows expression of α1 and α2(IV) chains in GBM, which is not seen in developing rat kidney (22, 23).
Dysregulation of GBM collagen chains produces protein- uria and hematuria genetically or acquired as seen in Alport’s syndrome and Goodpasture syndrome, respectively (10, 11).
However, the dysregulation of cellular metabolism of indi- vidual chains of type IV collagen has not been well studied in diabetic nephropathy.
In STZ-induced diabetic rats, the mRNA levels for the α1 (IV) collagen chain increased significantly with age even before morphological thickening of basement membrane occurred (24). Treating the diabetic rats with insulin for 4 weeks ame- liorated the abnormally regulated ECM gene expression in the glomeruli (24). These data suggest that hyperglycemia may play a role in the abnormal ECM gene expression in vivo.
The mRNA levels for the α5(IV) collagen chain also increas- ed significantly in STZ-induced diabetic rats at month 1 but not at month 4, whereas collagen α5(IV) protein was higher at both 1 and 4 months (25). We also found that both novel collagen chains, α3(IV) and α5(IV) chains, increased in the GBM of experimental overt diabetic tissues as seen in Fig. 1.
In the db/db mice, there was a significant reduction of α3(IV) collagen protein in renal cortex but not of α5(IV) collagen subchain in compared with the db/m controls (26). In human diabetic kidney tissue, there was intense staining for α3(IV) NC and α4(IV) NC domain in the GBM but not in the me- sangial matrix of type I and type II diabetic patient tissue with overt diabetic nephropathy (27, 28). In contrast, stain- ing with antibodies to α1(IV) NC and α2(IV) NC domain reacted with mesangial matrix but appeared to diminish sig- nificantly in the GBM in the patients with overt diabetic
nephropathy (27, 28).
In vitro study, Kang et al. (25) reported that collagen α5 (IV)/GAPDH mRNA ratio and protein of cultured mouse podocytes were higher in high glucose for 10 days incubation than in low (normal) glucose. These results are similar to our results on the change of α5 chain mRNA levels at early stages although not significant later, as cultured cells might not be identical. On the other hand, Bai et al. (29) demonstrated using cultured mouse podocytes that high glucose decreased the protein levels of α5(IV) chain significantly during 3-4 days incubation, whereas, increased MMP-9 activity and mRNA levels, suggesting that the change of GBM collagen would be caused by an imbalance in ECM synthesis and degrada- tion. We also found that high glucose induced the increased amount of α1(IV), α3(IV), and α5(IV) chains protein at late stage. On the other hand, high glucose induced the mRNA expression of α5(IV) and partly α1(IV) at early stage but not at late stage. The incoordination between α(IV) chains protein and their mRNA expression at each stage suggest that the increased amount of α5(IV) chains protein in high glucose- added conditions may be induced by transcriptional metabol- ic imbalance at early stage but much more by post-transla- tional modification including structural changes by glycosy- lation mostly at late stage. On the other hand, the other α(IV) chains might be regulated much more by post-translational modification including structural changes by glycosylation and/or metabolic imbalance in time-dependent and isoform- specific manners. Similarly, AGE also induced the increased amount of α1(IV), α3(IV), and α5(IV) chains protein at late stage and the mRNA expression of α5(IV) at early stage and α1(IV) at late stage. These changes induced by AGE also sug- gest that α(IV) chains might be regulated not only by tran- scriptional level but also by post-translational modification including structural changes by glycosylation and/or metabol- ic imbalance in time-dependent and subchain-specific man- ners. Additive effects by AGE were not evident.
Although the mechanisms of increased each αchains of type IV collagen would not be clearly elucidated because of their different expressions, many researchers suggested the roles of angiotensin II (30), TGF-β, PKC-p38 MAPK signaling (25), insulin (24), decreased matrix degradation (28), etc. as the initiator and modulator of type IV collagen dysregulation in diabetic environments. According to the our present and previous studies, diabetic conditions induced the dysregula- tion of glomerular α(IV) chains by transcriptional and post- translational modification with a discrepancy in the species-, strains-, time-, cell-, and/or subchain-dependent manners.
The mechanisms of the changes of type IV collagen αchains would be further elucidated for the regulation of type IV col- lagen biosynthesis.
In conclusion, we suggest that the metabolism of individ- ual α(IV) chains of GBM is differentially regulated in diabet- ic conditions and the change of each αchains would be in- duced by transcriptional level and post-translational modifi-
cation including structural changes by glycosylation and/or metabolic imbalance in time-dependent and isoform-specif- ic manners.
ACKNOWLEDGMENTS
The authors thank Dr. K-D Han for his preparation for STZ-induced diabetic nephropathy and BS Kasinath for study idea.
REFERENCES
1. Sowers JR, Epstein M, Frohlich ED. Diabetes, hypertension, and cardiovascular disease: an update. Hypertension 2001; 37: 1053-9.
2. Sharma K, Ziyadeh FN. Hyperglycemia and diabetic kidney disease.
The case for transforming growth factor-beta as a key mediator. Dia- betes 1995; 44: 1139-46.
3. Cooper ME. Pathogenesis, prevention, and treatment of diabetic nephropathy. Lancet 1998; 352: 213-9.
4. Ziyadeh FN, Sharma K, Ericksen M, Wolf G. Stimulation of colla- gen gene expression and protein synthesis in murine mesangial cells by high glucose is mediated by autocrine activation of transforming growth factor-beta. J Clin Invest 1994; 93: 536-42.
5. Hoffman B, Sharma K, Zhu Y, Ziyadeh FN. Transcriptional activa- tion of transforming growth factor-beta1 in mesangial cell culture by high glucose concentration. Kidney Int 1998; 54: 1107-16.
6. Ziyadeh FN. The extracellular matrix in diabetic nephropathy. Am J Kidney Dis 1993; 22: 736-44.
7. Yurchenco PD, Smirnov S, Mathus T. Analysis of basement mem- brane self-assembly and cellular interactions with native and recom- binant glycoproteins. Methods Cell Biol 2002; 69: 111-44.
8. Aumailley M, Gayraud B. Structure and biological activity of the extracellular matrix. J Mol Med 1998; 76: 253-65.
9. Miner JH. Renal basement membrane components. Kidney Int 1999;
56: 2016-24.
10. Hostikka, SL, Eddy RL, Byers MG, Hoyhtya M, Shows TB, Tryg- gvason K. Identification of a distinct type IV collagen alpha chain with restricted kidney distribution and assignment of its gene to the locus of X chromosome-linked Alport syndrome. Proc Natl Acad Sci USA 1990; 87: 1606-10.
11. Hudson BG, Tryggvason K, Sundaramoorthy M, Neilson EG. Alport’s syndrome, Goodpasture’s syndrome, and type IV collagen. N Engl J Med 2003; 348: 2543-56.
12. Timpl R, Wiedemann H, van Delden V, Furthmayr H, Kuhn K. A network model for the organization of type IV collagen molecules in basement membranes. Eur J Biochem 1981; 120: 203-11.
13. Boutaud A, Borza DB, Bondar O, Gunwar S, Netzer KO, Singh N, Ninomiya Y, Sado Y, Noelken ME, Hudson BG. Type IV collagen of the glomerular basement membrane: evidence that the chain speci- ficity of network assembly is encoded by the noncollagenous NC1 domains. J Biol Chem 2000; 275: 30716-24.
14. Kreisberg JI, Hoover RL, Karnovsky MJ. Isolation and characteri-
zation of rat glomerular epithelial cells in vitro. Kidney Int 1978;
14: 21-30.
15. Ha TS, Song CJ, Lee JH. Effects of advanced glycosylation endprod- ucts on perlecan core protein of glomerular epithelium. Pediatr Ne- phrol 2004; 19: 1219-24.
16. Zhu D, Kim Y, Steffes MW, Groppoli TJ, Butkowski RJ, Mauer SM.
Glomerular distribution of type IV collagen in diabetes by high res- olution quantitative immunochemistry. Kidney Int 1994; 45: 425-33.
17. Wolf G, Chen S, Ziyadeh FN. From the periphery of the glomeru- lar capillary wall toward the center of disease: podocyte injury comes of age in diabetic nephropathy. Diabetes 2005; 54: 1626-34.
18. Isogai S, Mogami K, Shiina N, Yoshino G. Initial ultrastructural changes in pore size and anionic sites of the glomerular basement membrane in streptozotocin-induced diabetic rats and their preven- tion by insulin treatment. Nephron 1999; 83: 53-8.
19. Sharma K, Ziyadeh FN. Biochemical events and cytokine interactions linking glucose metabolism to the development of diabetic nephropa- thy. Semin Nephrol 1997; 17: 80-92.
20. White KE, Bilous RW, Diabiopsies Study Group. Structural alter- ations to the podocyte are related to proteinuria in type 2 diabetic patients. Nephrol Dial Transplant 2004; 19: 1437-40.
21. UK Prospective Diabetes Study Group. Intensive blood-glucose con- trol with sulphonylureas or insulin compared with conventional treat- ment and risk of complications in patients with type 2 diabetes (UK- PDS 33). UK Prospective Diabetes Study (UKPDS) Group. Lancet 1998; 352: 837-53.
22. Miner JH, Sanes JR. Collagen IV alpha 3, alpha 4, and alpha 5 chains in rodent basal laminae: sequence, distribution, association with la- minins, and developmental switches. J Cell Biol 1994; 127: 879-91.
23. Miner JH. Developmental biology of glomerular basement membrane
components. Curr Opin Nephrol Hypertens 1998; 7: 13-9.
24. Fukui M, Nakamura T, Ebihara I, Shirato I, Tomino Y, Koide H. ECM gene expression and its modulation by insulin in diabetic rats. Dia- betes 1992; 41: 1520-7.
25. Kang SW, Natarajan R, Shahed A, Nast CC, LaPage J, Mundel P, Kashtan C, Adler SG. Role of 12-lipoxygenase in the stimulation of p38 mitogen-activated protein kinase and collagen α5(IV) in exper- imental diabetic nephropathy and in glucose-stimulated podocytes.
J Am Soc Nephrol 2003; 14: 3178-87.
26. Cohen MP, Lautenslager GT, Hud E, Shea E, Wang A, Chen S, Shear- man CW. Inhibiting albumin glycation attenuates dysregulation of VEGFR-1 and collagen IV subchain production and the development of renal insufficiency. Am J Physiol Renal Physiol 2007; 292: F789- 95.
27. Kim Y, Kleppel MM, Butkowski R, Mauer SM, Wieslander J, Mi- chael AF. Differential expression of basement membrane collagen chains in diabetic nephropathy. Am J Pathol 1991; 138: 413-20.
28. Yagame M, Kim Y, Zhu D, Suzuki D, Eguchi K, Nomoto Y, Sakai H, Groppoli T, Steffes MW, Mauer SM. Differential distribution of type IV collagen chains in patients with diabetic nephropathy in non- insulin-dependent diabetes mellitus. Nephron 1995; 70: 42-8.
29. Bai Y, Wang L, Li Y, Liu S, Li J, Wang H, Huang H. High ambient glucose levels modulates the production of MMP-9 and α5(IV) col- lagen by cultured podocytes. Cell Physiol Biochem 2006; 17: 57-68.
30. Chen S, Lee JS, Iglesias-de la Cruz MC, Wang A, Izquierdo-Lahuer- ta A, Gandhi NK, Danesh FR, Wolf G, Ziyadeh FN. Angiotensin II stimulates α3(IV) collagen production in mouse podocytes via TGF- beta and VEGF signalling: implications for diabetic glomerulopa- thy. Nephrol Dial Transplant 2005; 20: 1320-8.
![Fig. 2. [ 3 H]-Proline incorporation by high glucose and AGE. High glucose increased [ 3 H]-proline incorporation of GEpC significant-ly (*P<0.05).% of control (B5)200150100500 A5 A30 B5 B30 AosmCulture conditions120.6150.3100**155.5106.3](https://thumb-ap.123doks.com/thumbv2/123dokinfo/5133060.90319/3.892.91.799.744.1046/proline-incorporation-glucose-increased-incorporation-significant-aosmculture-conditions.webp)