ABSTRACT
Purpose: In this study, we aimed to evaluate the rarely reported long-term nutritional results of patients with gastric cancer after curative gastrectomy.
Materials and Methods: We retrospectively reviewed the prospectively collected medical records of 658 patients who underwent radical gastrectomy with curative intent for gastric cancer from January 2008 to December 2009 and had no recurrences. All patients were followed for 5 years. Nutritional statuses were assessed using measurements of body weight, serum hemoglobin, total lymphocyte count (TLC), protein, albumin, cholesterol, and nutritional risk index (NRI).
Results: Patients who underwent total gastrectomy had lower body weights, hemoglobin, protein, albumin, and cholesterol levels. TLC and NRI values after the first postoperative year (P<0.05), and lower hemoglobin and NRI values during the fifth postoperative year than patients who underwent distal gastrectomy (P<0.05). Patients who received adjuvant chemotherapy after gastrectomy had lower hemoglobin, protein, albumin, and cholesterol levels. TLC and NRI values during the first postoperative year, than those who underwent gastrectomy only (P<0.05). Regarding post-distal gastrectomy reconstruction, those who underwent Roux-en-Y had lower cholesterol levels than did those who underwent Billroth-I and Billroth-II reconstruction at the first and fifth years after gastrectomy, respectively (P<0.05).
Conclusions: Patients undergoing total or distal gastrectomy with Roux-en-Y anastomosis or adjuvant chemotherapy after surgery should be monitored carefully for malnutrition during the first postoperative year, and patients undergoing total gastrectomy should be monitored for malnutrition and anemia for 5 years.
Keywords: Stomach neoplasms; Nutrition status; Nutritional risk index
INTRODUCTION
Gastric cancer remains the third leading cause of cancer-related deaths worldwide, despite substantial decreases in incidence in most areas of the world [1]. Currently, Korea has the highest global incidence of gastric cancer (41.4 per 100,000). However, the implementation of nationwide health screening programs and improved diagnostic techniques have led to steady increases in early gastric cancer diagnosis. Accordingly, the proportion of T1 cancers has increased consistently, with such cases now accounting for >60% of all gastric cancers in Korea [2].
Original Article
Received: Dec 19, 2016 Revised: Mar 6, 2017 Accepted: Mar 17, 2017 Correspondence to Do Joong Park
Department of Surgery, Seoul National University Bundang Hospital, Seoul National University College of Medicine, 82 Gumi-ro 173 beon-gil, Bundang-gu, Seongnam 13620, Korea.
Tel: +82-31-787-7099 Fax: +82-31-787-4055 E-mail: [email protected]
Copyright © 2017. Korean Gastric Cancer Association
This is an Open Access article distributed under the terms of the Creative Commons Attribution Non-Commercial License (https://
creativecommons.org/licenses/by-nc/4.0) which permits unrestricted noncommercial use, distribution, and reproduction in any medium, provided the original work is properly cited.
Conflict of Interest
No potential conflict of interest relevant to this article was reported.
Ki Hyun Kim1, Dong Jin Park1, Young Suk Park1, Sang Hoon Ahn1, Do Joong Park1,2, Hyung Ho Kim1,2
1Department of Surgery, Seoul National University Bundang Hospital, Seongnam, Korea
2Department of Surgery, Seoul National University College of Medicine, Seoul, Korea
Actual 5-Year Nutritional Outcomes of
Patients with Gastric Cancer
Malnutrition is among the main postoperative complications of radical subtotal or total gastrectomy for gastric cancer [3-5] and is an important outcome, given the influence of the nutritional status on a patient's quality of life, morbidity, and mortality [6]. Malnutrition plays a particularly important role in the overall survival of patients with malignant tumors: a poorer nutritional status increases infection susceptibility, delays wound healing, impairs blood clotting, induces vessel wall fragility, and directly increases postoperative complications [7-9].
Malnutrition can also promote tumor development by suppressing tumor immunity [10].
Although many researchers consider malnutrition an unavoidable complication, the nutritional consequences of gastrectomy remain poorly investigated. To date, studies of dietary lifestyles after gastric surgery for gastric cancer have largely focused on short- term nutritional outcomes [6,11,12]. In addition, these studies have also concentrated on total gastrectomy; accordingly, little is known about the long-term nutritional outcomes of patients treated via distal gastrectomy. The latter procedure has become increasingly feasible as a result of advances in surgical techniques and chemotherapy, and long-term outcome data are becoming available as a result of the increased population of long-term survivors. The present study aimed to determine whether patients who undergo total or distal gastrectomy, and who do and do not undergo postoperative adjuvant chemotherapy should be monitored for malnutrition.
MATERIALS AND METHODS
Patients
The protocol of this single-center retrospective cohort study was approved by the Internal Review Board of the Seoul National University Bundang Hospital, Seongnam, Korea, an academic hospital affiliated with the Seoul National University College of Medicine (Approval No. L-20151223). The requirement for informed consent from the patients was waived because of the retrospective nature of this study. This study was conducted according to the principles of the Declaration of Helsinki.
The study cohort comprised all consecutive patients with gastric cancer who underwent curative gastrectomy at Seoul National University Bundang Hospital from January 2008 to December 2009. The patients' medical records, which were collected prospectively, were reviewed retrospectively at Seoul National University Bundang Hospital. Only patients who had been followed up for ≥5 years were included. Patients who died, were lost to follow-up, or developed a recurrence within 5 years postoperatively were excluded.
The patients were divided into 2 groups according to whether they underwent total or distal gastrectomy. In a separate analysis, the patients were divided according to whether they did or did not receive postoperative adjuvant chemotherapy, comprising either titanium silicate-1 chemotherapy for 12 months, or a combination of capecitabine and oxaliplatin for 6 months. In a third analysis, patients who underwent distal gastrectomy were divided into 3 groups based on the anastomosis type: Billroth-I, Billroth-II, or Roux-en-Y.
Laboratory assays
The nutritional statuses of the gastric cancer patients were assessed before and 1–5 years after surgery, using measured body weights, total lymphocyte counts (TLCs), and serum hemoglobin, total protein, albumin, cholesterol, and transferrin levels. Anemia was defined
according to the World Health Organization (WHO) criteria as an hemoglobin level <12 g/dL for women, or <13 g/dL for men [13].
Nutritional risk index (NRI) and prognostic nutritional index (PNI)
NRI was calculated using the following formula:NRI=(1.519×serum albumin g/L)+0.417×(present weight/usual weight×100) Although the “usual” weight is generally defined as the stable weight ≥6 months before the illness, this value was not routinely determined for our patients. Therefore, the weight measured at admission for surgery was used as the “usual” weight. Patients were deemed to be malnourished when the NRI score was <97.5 [14].
PNI was calculated using the following formula:
PNI=10×serum albumin value (g/dL)+0.005×TLC in the peripheral blood (per mm3)
Statistical analysis
For subjects whose body weight data were missing from the medical records, we applied multiple imputations (MIs; 5 imputations) using the MI procedure in the Statistical Analysis System (SAS Institute, Cary, NC, USA) [15]. Continuous values are expressed as means with standard deviations.
The mean values of the 2 patient groups were compared using 2-tailed t-tests, and the mean values of 3 patient groups were compared using analysis of variance (ANOVA). Post-hoc comparisons were made using the Bonferroni method. P-values ≤0.05 were generally considered to indicate statistically significant differences. However, to avoid a type I error in post-hoc analyses, a P-value of 0.05/3 (0.017) was set as the threshold for statistical significance. All statistical analyses were performed using SPSS version 21.0 software (IBM SPSS Inc., Chicago, IL, USA).
Human rights and informed consent statements
All procedures were followed in accordance with the ethical standards of the responsible committees on human experimentation (institutional and national), as well as the Helsinki Declaration of 1964 and later versions. Informed consent, or a valid substitute, was obtained from all patients prior to inclusion in the study.
RESULTS
Clinicopathological patient characteristics
During the study period, 821 patients underwent curative gastrectomy for gastric cancer.
Of these, 163 were excluded because they died (n=51), were lost to follow-up (n=28), or developed a recurrence (n=84) within 5 years postoperatively. Accordingly, 658 patients formed the study population.
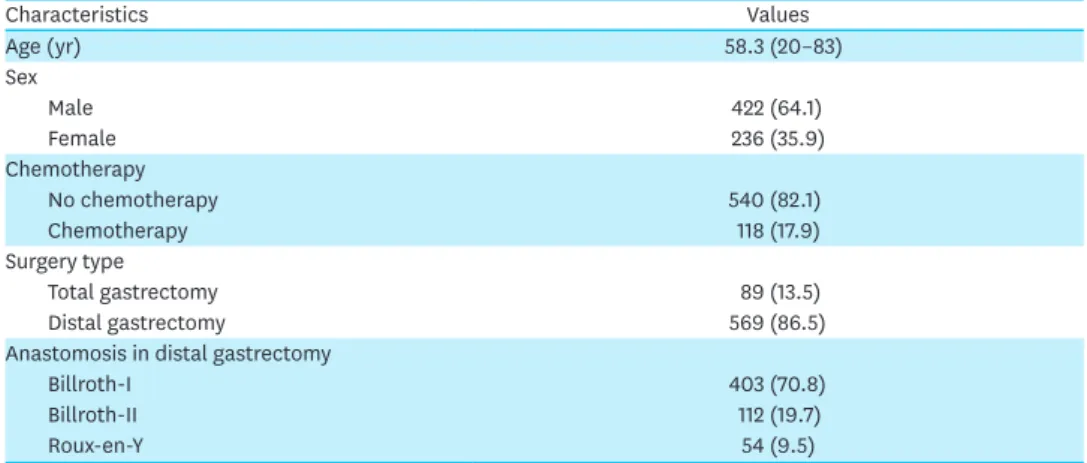
The study cohort included 422 (64.1%) and 236 (35.9%) male and female patients, respectively, with a mean age at diagnosis of 58.3 years (range, 20–83 years) (Table 1). Within the cohort, 118 (17.9%) and 540 (82.1%) did and did not undergo chemotherapy, respectively, and 89 (13.5%) and 569 (86.5%) underwent total and distal gastrectomy, respectively. Of the 565 patients who underwent distal gastrectomy, 403 (70.8%), 112 (19.7%), and 54 (9.5%) underwent Billroth-I, Billroth-II, and Roux-en-Y anastomosis, respectively.
Comparison of the patients who underwent total and distal gastrectomy
Table 2 shows the NRI, body mass index (BMI), PNI, and laboratory values of patients who underwent total and distal gastrectomy before and 1–5 years after surgery. Before surgery, the 2 groups did not differ significantly in terms of any variable. However, 1–5 years after surgery, the total gastrectomy group had significantly lower NRI, BMI, and hemoglobin levels and significantly higher TLCs, compared with the distal gastrectomy group. The former group Table 1. Characteristics of 658 patients who underwent curative resection during the study periodCharacteristics Values
Age (yr) 58.3 (20–83)
Sex
Male 422 (64.1)
Female 236 (35.9)
Chemotherapy
No chemotherapy 540 (82.1)
Chemotherapy 118 (17.9)
Surgery type
Total gastrectomy 89 (13.5)
Distal gastrectomy 569 (86.5)
Anastomosis in distal gastrectomy
Billroth-I 403 (70.8)
Billroth-II 112 (19.7)
Roux-en-Y 54 (9.5)
Values are presented as mean (range) or number (%).
Table 2. Comparison of the laboratory values of patients who did and did not undergo chemotherapy, measured before, and 1–5 years after, curative resection
Variables Preoperative 1 year 2 years 3 years 4 years 5 years
NRI
No chemotherapy NA 104.5±5.2* 104.2±6.1 104.3±5.7 104.0±5.6 103.4±6.0
Chemotherapy NA 102.6±5.8 104.4±5.7 104.7±5.9 104.2±5.8 103.3±5.1
BMI (kg/m2)
No chemotherapy 23.6±2.8 21.7±2.5 21.8±2.6 21.7±2.5 21.8±2.5 21.8±2.6
Chemotherapy 23.7±2.9 21.3±2.5 21.7±2.4 21.7±2.3 21.6±2.2 21.6±2.4
PNI
No chemotherapy 55.1±5.6* 55.1±4.9* 54.2±4.5 53.8±4.6 53.1±4.8 52.5±4.9
Chemotherapy 53.3±7.2 52.8±4.9 54.0±5.0 54.0±5.2 53.4±4.9 52.9±4.3
TLC (×106/L)
No chemotherapy 2,322.7±743.7 2,327.3±711.3* 2,194.0±628.7 2,123.2±628.0 2,037.7±634.2 2,007.1±658.0
Chemotherapy 2,262.0±871.8 2,142.4±678.2 2,241.7±690.5 2,198.2±778.5 2,146.9±694.6 2,082.2±695.5
Hemoglobin (g/dL)
No chemotherapy 13.7±1.8* 13.5±1.4* 13.4±1.6 13.4±1.7 13.3±1.7 13.1±1.8
Chemotherapy 13.0±2.2 12.2±1.4 13.1±1.4 13.0±1.6 12.9±1.5 12.9±1.5
Serum albumin (g/dL)
No chemotherapy 4.3±0.3* 4.3±0.2* 4.3±0.2 4.3±0.3 4.2±0.3 4.2±0.3
Chemotherapy 4.2±0.4 4.2±0.3 4.2±0.3 4.3±0.2 4.2±0.2 4.2±0.2
Total protein (mg/dL)
No chemotherapy 7.0±0.5* 7.1±0.4* 7.0±0.4* 7.0±0.4 7.0±0.4 7.0±0.4
Chemotherapy 6.8±0.6 6.8±0.5 6.9±0.4 7.0±0.4 6.9±0.4 7.0±0.4
Cholesterol (mg/dL)
No chemotherapy 188.3±36.3* 173.8±31.2* 175.1±30.8 175.8±32.3 176.2±31.5 174.4±33.6
Chemotherapy 180.1±35.7 153.7±28.5 169.9±30.0 171.9±31.9 172.2±28.1 177.5±32.9
Transferrin (mg/dL)
No chemotherapy NA 270.2±47.7* 272.3±53.2 272.0±50.5 276.7±50.0 286.9±49.7
Chemotherapy NA 319.0±62.4 262.3±47.1 296.1±59.7 297.8±59.4 294.8±46.5
Data are shown as means±standard deviations. Institutional reference values: TLC, 2,000–4,400 ×106/L; hemoglobin, 13–17 g/dL; serum albumin, 3.3–5.2 g/dL; total protein, 6–8 mg/dL; cholesterol, 0–200 mg/dL; transferrin, 250–380 mg/dL. NRI was calculated using the following formula: 1.519×serum albumin (g/L)+0.417×(present weight/usual weight×100); PNI was calculated using the following formula: 10×serum albumin value (g/dL)+0.005×TLC in the peripheral blood (per mm3).
NRI = nutritional risk index; NA = not applicable; BMI = body mass index; PNI = prognostic nutritional index; TLC = total lymphocyte count.
*A statistically significant difference compared with patients who underwent chemotherapy (P<0.05), as determined by an independent t-test.
also had significantly lower serum albumin and cholesterol levels and significantly higher total protein levels relative to the latter group 1–4 years after surgery; however, by the fifth year, these differences were no longer observed. The total gastrectomy group also developed significantly higher transferrin levels, starting 3 years after surgery. The 2 groups never differed in terms of PNI.
An analysis of the incidence of anemia showed that at all time points after surgery, but not before surgery, patients who underwent total gastrectomy were significantly more likely to have anemia than were those who underwent distal gastrectomy (Fig. 1A). The total gastrectomy group exhibited a sharp increase in the anemia incidence from 27% before surgery to 51.8% 1 year after surgery, followed by a decrease 40.7% at year 2 and subsequent increase to 55.1% at year 5. By contrast, the anemia rates in the distal gastrectomy group only increased slightly over time from 20.1% before surgery to 28.1% at year 5.
An analysis of the incidence of malnourishment showed that patients who underwent chemotherapy were significantly more likely to be malnourished compared to those who did not, at all postoperative time points except during year 3.
A
Preop. 1 year 2 years 3 years 4 years 5 years
50
30 20
0
Incidence of anemia
60
40
10
Interval
*
*
* *
*
*
*
* *
*
27.0 20.1
51.8
25.7
40.7 42.3
48.1 55.1
25.6 28.1 23.6
23.1
Total gastrectomy Distal gastrectomy
B
1 year 2 years 3 years 4 years 5 years
25
15 10
Incidence of malnutrition 0 30
20
5
Interval
24.7
18.3
14.1
10.1 9.2 10.3
13.3 8.8
18.2
24.6
Total gastrectomy Distal gastrectomy
C
Preop. 1 year 2 years 3 years 4 years 5 years
50
30 20
0
Incidence of anemia
70 60
40
10
Interval
* 33.1
62.1
30.6 31.8 33.3 36.8
18.4 21.7 24.4 25.0 28.0 30.9
Chemotherapy No chemotherapy
Chemotherapy No chemotherapy D
1 year 2 years 3 years 4 years 5 years
25
15
10
Incidence of malnutrition 0 20
5
Interval
20.7
11.2 11.9 10.3
8.8 9.8 11.2
12.7 15.1
14.7
Fig. 1. Incidence of anemia and malnutrition 1–5 years postoperatively among patients who underwent total or distal gastrectomy (A and B) or did or did not undergo chemotherapy (C and D). Anemia was defined as a hemoglobin levels <12 g/dL for women or <13 g/dL for men. Malnutrition was defined as a NRI of
<97.5. NRI was calculated using the following formula: 1.519×serum albumin (g/L)+0.417×(present weight/usual weight×100).
Preop. = preoperative; NRI = nutritional risk index.
*P<0.05, as determined by the χ2 test.
Comparison of patients who did and did not undergo chemotherapy
Table 3 shows the NRI, BMI, PNI, and laboratory values of the chemotherapy and non- chemotherapy groups 1–5 years after curative gastrectomy. Before surgery, patients who underwent chemotherapy had a significantly lower PNI, compared to patients who did not, and this difference was maintained for 1 year after surgery. Thereafter, the 2 groups had equivalent PNI values. This pattern was also observed for serum hemoglobin, albumin, and cholesterol levels.The total protein levels exhibited a similar pattern, except that the chemotherapy group also had lower total protein levels 2 years after surgery. The 2 groups did not differ in terms of BMI at any time point. The NRI and TLCs were only lower in the chemotherapy group 1 year after surgery.
An analysis of the incidence of anemia per the above definition found that the chemotherapy and no-chemotherapy groups did not differ significantly in terms of the anemia incidence before surgery. However, 1 year after surgery, the chemotherapy group exhibited a sharp increase in anemia from 33.1% (before surgery) to 62.1%. Thereafter, anemia rates dipped to 30.6% at year 2, followed by an increase to 36.8% at year 5 (Fig. 1B). By contrast, the anemia rates in the chemotherapy group only increased slightly, from 18.4% before surgery to 30.9%
at year 5. The 2 groups differed significantly at year 1.
An analysis of the incidence of malnutrition, defined as a NRI <97.5, found that chemotherapy patients were significantly more likely to be malnourished 1 year after surgery, compared to the no-chemotherapy patients (20.7% vs. 8.8%) (Fig. 1C). At year 2, Table 3. Comparison of the laboratory values of patients who underwent distal or total gastrectomy, measured before, and 1–5 years after, curative resection
Variables Preoperative 1 year 2 years 3 years 4 years 5 years
NRI
Distal gastrectomy NA 104.4±5.3* 104.2±6.0* 104.3±5.7* 104.0±0.2* 103.3±5.7*
Total gastrectomy NA 101.0±5.6 101.5±6.0 101.5±5.3 101.4±5.4 100.6±6.2
BMI (kg/m2)
Distal gastrectomy 23.6±2.8 21.7±2.5* 21.8±2.5* 21.8±2.4* 21.8±2.4* 21.9±2.5*
Total gastrectomy 23.7±2.9 20.8±2.6 20.9±2.5 21.0±2.4 21.0±2.4 21.0±2.4
PNI
Distal gastrectomy 54.7±5.7 54.7±4.9 54.1±4.4 53.7±4.5 53.1±4.7 52.5±4.6
Total gastrectomy 55.2±7.2 54.7±5.7 54.6±5.6 54.6±6.0 53.7±5.4 53.0±5.5
TLC (×106/L)
Distal gastrectomy 2,292.8±738.1 2,262.1±684.6* 2,168.1±684.6* 2,084.4±620.0* 2,013.5±610.8* 1,984.7±629.9* Total gastrectomy 2,432.4±931.5 2,485.6±820.6 2,408.1±820.6 2,447.9±721.4 2,313.6±777.5 2,235.3±812.0 Hemoglobin (g/dL)
Distal gastrectomy 13.6±1.9 13.3±1.5* 13.4±1.6* 13.4±1.7* 13.3±1.7* 13.3±1.7*
Total gastrectomy 13.6±1.9 12.6±1.4 12.9±1.3 12.5±1.5 12.5±1.5 12.1±1.7
Serum albumin (g/dL)
Distal gastrectomy 4.3±0.3 4.3±0.2* 4.3±0.2* 4.3±0.2* 4.3±0.2* 4.2±0.3
Total gastrectomy 4.3±0.3 4.2±0.3 4.2±0.3 4.2±0.3 4.2±0.3 4.1±0.3
Total protein (mg/dL)
Distal gastrectomy 7.0±0.5 7.1±0.4* 7.1±0.5* 7.1±0.4* 7.1±0.4* 7.0±0.4
Total gastrectomy 7.0±0.6 6.8±0.5 6.9±0.5 6.9±0.4 6.9±0.5 7.0±0.4
Cholesterol (mg/dL)
Distal gastrectomy 187.5±36.6 171.5±32.4* 175.4±30.7* 177.2±32.3* 177.5±30.6* 176.1±34.2
Total gastrectomy 183.0±34.7 161.0±25.1 166.8±29.5 162.5±28.8 164.0±29.9 169.1±28.8
Transferrin (mg/dL)
Distal gastrectomy NA 271.0±48.1 271.6±53.3 270.5±49.5* 274.8±48.8* 284.0±49.3*
Total gastrectomy NA 270.4±50.5 275.0±50.7 291.6±58.1 294.7±57.1 312.6±43.8
Data are shown as means±standard deviations. Institutional reference values: TLC, 2,000–4,400 ×106/L; hemoglobin, 13–17 g/dL; serum albumin, 3.3–5.2 g/dL; total protein, 6–8 mg/dL; cholesterol, 0–200 mg/dL; transferrin, 250–380 mg/dL. NRI was calculated using the following formula: 1.519×serum albumin (g/L)+0.417×(present weight/usual weight×100); PNI was calculated using the following formula: 10×serum albumin value (g/dL)+0.005×TLC in the peripheral blood (per mm3).
NRI = nutritional risk index; NA = not applicable; BMI = body mass index; PNI = prognostic nutritional index; TLC = total lymphocyte count.
*A statistically significant difference compared with patients who underwent chemotherapy (P<0.05), as determined by an independent t-test.
the malnutrition rate of the chemotherapy group decreased by half to 11.9%, and the rate of the no-chemotherapy group increased to 11.2%. Thereafter, the 2 groups maintained similar rates and slight increases over time to 15.1% and 14.7% at year 5, respectively.
Comparison of patients who underwent Billroth-I, Billroth-II, and Roux-en-Y anastomosis after distal gastrectomy
The 3 anastomosis groups did not differ in terms of NRI, PNI, BMI, TLCs, and serum albumin levels preoperatively or during the 5-year follow-up period (data not shown). Table 4 lists the total protein, cholesterol, and transferrin values of the Billroth-I, Billroth-II, and Roux-en-Y groups before and 1–5 years after curative gastrectomy. An ANOVA, followed by a Bonferroni post-hoc analysis, showed that preoperatively, the 3 groups did not differ significantly in terms of total protein, cholesterol, and transferrin values. After surgery, the Billroth-I group had significantly higher total protein levels than the Billroth-II group at all time points, as well as higher cholesterol levels at years 1 and 4, and significantly lower transferrin levels at year 5.
DISCUSSION
This study measured the nutritional statuses, including BMI, laboratory values, and the nutritional evaluation tools such as NRI and PNI [14,16-18], of patients for 5 years after radical treatment for gastric cancer. The NRI was designed to predict surgery-related complications in malnourished patients. As this index correlates with malnutrition [19], it has been used to assess the nutritional statuses of patients with head and neck [20,21] and gastrointestinal cancers [16,17,22]. Although the NRI is based on a simple calculation, it is a useful nutritional status screening tool because it employs objective variables (body weight and serum albumin levels) that are important indicators of malnutrition [23-25]. The present study showed that the total gastrectomy group had significantly lower NRI values 1–5 years after surgery.
Similarly, the total gastrectomy group had significantly higher malnutrition rates (NRI
<97.5%) than did the distal gastrectomy group at all time points after surgery, except year 3. Therefore, although patients who undergo total gastrectomy do adapt somewhat after surgery, the operation is associated with a poorer long-term nutritional status. Accordingly, these patients should be monitored closely and given appropriate nutritional support for at least 5 years after surgery.
Table 4. Comparison of the laboratory values of patients who underwent Billroth-I, Billroth-II, or Roux-en-Y anastomosis, measured before, and 1–5 years after, distal gastrectomy
Variables Preoperative 1 year 2 years 3 years 4 years 5 years
Total protein (mg/dL)
Billroth-I 7.1±0.5 7.1±0.4* 7.1±0.4* 7.1±0.4* 7.1±0.3* 7.1±0.4*
Billroth-II 6.9±0.6 6.9±0.5* 6.9±0.4* 6.9±0.4* 6.9±0.5* 6.9±0.4*
Roux-en-Y 6.8±0.6 7.04±0.3 7.0±0.3 7.0±0.4 7.0±0.3 7.0±0.4
Cholesterol (mg/dL)
Billroth-I 190.9±36.6 174.5±32.9* 178.7±30.6 182.2±32.3 181.4±30.1* 180.1±34.1
Billroth-II 186.0±34.2 163.3±29.6* 169.2±26.5 174.0±32.1 167.4±26.6* 169.4±31.1
Roux-en-Y 180.2±35.0 158.9±32.8 166.8±32.9 166.7±29.5 170.1±30.8 165.7±36.8
Transferrin (mg/dL)
Billroth-I NA 267.5±46.4 267.7±52.5 267.7±53.5 270.0±47.2 276.8±48.8*
Billroth-II NA 281.3±54.9 281.0±60.6 277.9±53.5 285.0±51.8 298.3±43.5*
Roux-en-Y NA 276.6±42.8 278.3±39.8 274.1±53.5 290.0±49.9 305.1±55.0
Data are expressed as means±standard deviations. Institutional reference values: total protein, 6–8 mg/dL; cholesterol, 0–200 mg/dL; transferrin, 250–380 mg/dL.
NA = not applicable.
*P<0.05/3, or a significant statistical difference.
The present study also showed that patients who underwent chemotherapy had significantly lower NRI values and malnutrition rates 1 year after surgery, than those treated with gastrectomy alone. Therefore, the nutritional statuses of patients who undergo chemotherapy should also be monitored closely to ensure appropriate nutritional support for at least 1 postoperative year.
The PNI reflects the prognosis of curative gastrectomy [26,27]. The early detection of recurrences and continuation of effective chemotherapy are critical for prolonging the long-term survival of patients with gastric cancer who undergo curative gastrectomy;
similarly, supportive treatments such as nutritional therapy might also assist gastric cancer patients with low PNI values. However, in the present study, only the chemotherapy group had significantly lower PNI values both before and 1 year after surgery, compared with the no-chemotherapy group. By contrast, the total and distal gastrectomy groups did not differ in terms of PNI at any time point. This finding reflects the fact that all study patients lacked evidence of recurrence. Accordingly, in the absence of recurrence, PNI is more effective for predicting outcomes than for determining the nutritional status. We therefore assume that PNI does not directly reflect the nutritional status.
The present study found that the total gastrectomy group had a significantly higher TLC and plasma transferrin level, compared with the distal gastrectomy group. Various studies have yielded conflicting results regarding the ability of the TLC to reflect the nutritional status [28,29]. In our study, however, the TLC was not a suitable marker of malnutrition relative to the extent of gastrectomy. We note that elements such as aging and chemotherapy can affect the results, and that many factors should be considered when determining whether the TLC reflects the nutritional status.
Transferrin is an iron-binding blood plasma glycoprotein that controls free iron levels in biological fluids [30]. Increased plasma transferrin levels are often seen in patients with iron deficiency-related anemia [31]. Indeed, an analysis of the anemia incidence in the total and distal gastrectomy groups showed that whereas the 2 groups had similar rates of anemia before surgery, total gastrectomy was associated with a significant postoperative increase in anemia that was maintained for 5 years. This finding suggests that total gastrectomy patients should be monitored for anemia for at least 5 postoperative years and appropriate interventions should be applied, if necessary.
The chemotherapy group experienced a similar sharp increase in the anemia incidence 1 year after surgery, followed by a decrease to the incidence observed in the no-
chemotherapy group. Therefore, patients who undergo chemotherapy should be carefully monitored for anemia for at least 1 year after surgery.
Regarding distal gastrectomy, the present study did not find that the type of anastomosis affected the postoperative nutritional status. However, we did find that Billroth-I anastomosis was associated with higher cholesterol levels after surgery, compared with Billroth-II
anastomosis.
To the best of our knowledge, our study was the first to examine the nutritional statuses of gastric cancer patients who underwent curative gastrectomy and did not develop recurrences within 5 years after surgery. We determined that patients who undergo total gastrectomy should be monitored for malnutrition and anemia for at least 5 years
after surgery, whereas the patients who undergo chemotherapy should be monitored for malnutrition and anemia for at least 1 year after surgery. Such monitoring will likely improve the quality of life of those who undergo curative gastrectomy. However, this study was limited by its reliance on retrospective data, which could have introduced information bias. In addition, this was a single-center study, and may therefore have been prone to selection bias. Prospective large-scale studies that examine nutritional statuses during long postoperative periods and use more objective tools, such as subjective global assessment [32] and nutritional risk screening (NRS 2002) [33], are warranted.
ACKNOWLEDGEMENTS
The authors thank the Medical Research Collaborating Center at Seoul National University Bundang Hospital for conducting the statistical analyses.
REFERENCES
1. Ferlay J, Soerjomataram I, Dikshit R, Eser S, Mathers C, Rebelo M, et al. Cancer incidence and mortality worldwide: sources, methods and major patterns in GLOBOCAN 2012. Int J Cancer 2015;136:E359-E386.
PUBMED | CROSSREF
2. Information Committee of Korean Gastric Cancer Association. Korean Gastric Cancer Association Nationwide Survey on gastric cancer in 2014. J Gastric Cancer 2016;16:131-140.
PUBMED | CROSSREF
3. Saito A, Noguchi Y, Yoshikawa T, Doi C, Fukuzawa K, Matsumoto A, et al. Gastrectomized patients are in a state of chronic protein malnutrition analyses of 23 amino acids. Hepatogastroenterology 2001;48:585-589.
PUBMED
4. Powell-Tuck J. Nutritional consequences of gastrointestinal disease. Baillieres Clin Gastroenterol 1988;2:715-727.
PUBMED | CROSSREF
5. Braga M, Vignali A, Gianotti L, Cestari A, Profili M, Carlo VD. Immune and nutritional effects of early enteral nutrition after major abdominal operations. Eur J Surg 1996;162:105-112.
PUBMED
6. Bae JM, Park JW, Yang HK, Kim JP. Nutritional status of gastric cancer patients after total gastrectomy.
World J Surg 1998;22:254-260.
PUBMED | CROSSREF
7. Pacelli F, Bossola M, Rosa F, Tortorelli AP, Papa V, Doglietto GB. Is malnutrition still a risk factor of postoperative complications in gastric cancer surgery? Clin Nutr 2008;27:398-407.
PUBMED | CROSSREF
8. Sierzega M, Niekowal B, Kulig J, Popiela T. Nutritional status affects the rate of pancreatic fistula after distal pancreatectomy: a multivariate analysis of 132 patients. J Am Coll Surg 2007;205:52-59.
PUBMED | CROSSREF
9. Schwegler I, von Holzen A, Gutzwiller JP, Schlumpf R, Mühlebach S, Stanga Z. Nutritional risk is a clinical predictor of postoperative mortality and morbidity in surgery for colorectal cancer. Br J Surg 2010;97:92-97.
PUBMED | CROSSREF
10. Gao Y, Zhou S, Jiang W, Huang M, Dai X. Effects of ganopoly (a Ganoderma lucidum polysaccharide extract) on the immune functions in advanced-stage cancer patients. Immunol Invest 2003;32:201-215.
PUBMED | CROSSREF
11. Rey-Ferro M, Castaño R, Orozco O, Serna A, Moreno A. Nutritional and immunologic evaluation of patients with gastric cancer before and after surgery. Nutrition 1997;13:878-881.
PUBMED | CROSSREF
12. Katsube T, Konnno S, Murayama M, Kuhara K, Sagawa M, Yoshimatsu K, et al. Changes of nutritional status after distal gastrectomy in patients with gastric cancer. Hepatogastroenterology 2008;55:1864-1867.
PUBMED
13. Cable CT, Colbert CY, Showalter T, Ahluwalia R, Song J, Whitfield P, et al. Prevalence of anemia after Roux-en-Y gastric bypass surgery: what is the right number? Surg Obes Relat Dis 2011;7:134-139.
PUBMED | CROSSREF
14. Veterans Affairs Total Parenteral Nutrition Cooperative Study Group. Perioperative total parenteral nutrition in surgical patients. N Engl J Med 1991;325:525-532.
PUBMED | CROSSREF
15. Schafer JL. Multiple imputation: a primer. Stat Methods Med Res 1999;8:3-15.
PUBMED | CROSSREF
16. Ryu SW, Kim IH. Comparison of different nutritional assessments in detecting malnutrition among gastric cancer patients. World J Gastroenterol 2010;16:3310-3317.
PUBMED | CROSSREF
17. Sato N. Muscle strength in patients with gastrointestinal carcinoma--an important role of muscle strength as a nutritional parameter. Nihon Geka Gakkai Zasshi 1986;87:1511-1525.
PUBMED
18. Onodera T, Goseki N, Kosaki G. Prognostic nutritional index in gastrointestinal surgery of malnourished cancer patients. Nihon Geka Gakkai Zasshi 1984;85:1001-1005.
PUBMED
19. Galvan O, Joannidis M, Widschwendter A, Bonatti H, Sprinzl GM, Rehak P, et al. Comparison of different scoring methods for assessing the nutritional status of hospitalised patients. Wien Klin Wochenschr 2004;116:596-602.
PUBMED | CROSSREF
20. Salas S, Deville JL, Giorgi R, Pignon T, Bagarry D, Barrau K, et al. Nutritional factors as predictors of response to radio-chemotherapy and survival in unresectable squamous head and neck carcinoma.
Radiother Oncol 2008;87:195-200.
PUBMED | CROSSREF
21. Mayaleh HA, Vayer C, Amsellem C, Bouvet A, Duval N, Poiree B, et al. Interest of peri-operative immunonutrition in head and neck cancers. Rev Laryngol Otol Rhinol (Bord) 2009;130:235-240.
PUBMED
22. Barret M, Malka D, Aparicio T, Dalban C, Locher C, Sabate JM, et al. Nutritional status affects treatment tolerability and survival in metastatic colorectal cancer patients: results of an AGEO prospective multicenter study. Oncology 2011;81:395-402.
PUBMED | CROSSREF
23. Antoun S, Rey A, Béal J, Montange F, Pressoir M, Vasson MP, et al. Nutritional risk factors in planned oncologic surgery: what clinical and biological parameters should be routinely used? World J Surg 2009;33:1633-1640.
PUBMED | CROSSREF
24. Lien YC, Hsieh CC, Wu YC, Hsu HS, Hsu WH, Wang LS, et al. Preoperative serum albumin level is a prognostic indicator for adenocarcinoma of the gastric cardia. J Gastrointest Surg 2004;8:1041-1048.
PUBMED | CROSSREF
25. Loh KW, Vriens MR, Gerritsen A, Borel Rinkes IH, van Hillegersberg R, Schippers C, et al. Unintentional weight loss is the most important indicator of malnutrition among surgical cancer patients. Neth J Med 2012;70:365-369.
PUBMED
26. Schiesser M, Kirchhoff P, Müller MK, Schäfer M, Clavien PA. The correlation of nutrition risk index, nutrition risk score, and bioimpedance analysis with postoperative complications in patients undergoing gastrointestinal surgery. Surgery 2009;145:519-526.
PUBMED | CROSSREF
27. Geng Y, Qi Q, Sun M, Chen H, Wang P, Chen Z. Prognostic nutritional index predicts survival and correlates with systemic inflammatory response in advanced pancreatic cancer. Eur J Surg Oncol 2015;41:1508-1514.
PUBMED | CROSSREF
28. Kuzuya M, Kanda S, Koike T, Suzuki Y, Iguchi A. Lack of correlation between total lymphocyte count and nutritional status in the elderly. Clin Nutr 2005;24:427-432.
PUBMED | CROSSREF
29. Rocha NP, Fortes RC. Total lymphocyte count and serum albumin as predictors of nutritional risk in surgical patients. Arq Bras Cir Dig 2015;28:193-196.
PUBMED | CROSSREF
30. Crichton RR, Charloteaux-Wauters M. Iron transport and storage. Eur J Biochem 1987;164:485-506.
PUBMED | CROSSREF
31. Macedo MF, de Sousa M. Transferrin and the transferrin receptor: of magic bullets and other concerns.
Inflamm Allergy Drug Targets 2008;7:41-52.
PUBMED | CROSSREF
32. Detsky AS, McLaughlin JR Jr, Baker JP, Johnston N, Whittaker S, Mendelson RA, et al. What is subjective global assessment of nutritional status? JPEN J Parenter Enteral Nutr 1987;11:8-13.
PUBMED | CROSSREF
33. Kondrup J, Allison SP, Elia M, Vellas B, Plauth MEducational and Clinical Practice Committee, European Society of Parenteral and Enteral Nutrition (ESPEN). ESPEN guidelines for nutrition screening 2002. Clin Nutr 2003;22:415-421.
PUBMED | CROSSREF