A survey of the satisfaction of patients who have undergone implant surgery with and
without employing a computer-guided implant surgical template
Shin-Young Youk1+, Jee-Ho Lee2+, Ji-Man Park1*, Seong-Joo Heo3, Hyun-Ki Roh4, Eun-Jin Park1, Im Hee Shin5
1Department of Prosthodontics, Ewha Womans University, Seoul, Republic of Korea
2Department of Oral and Maxillofacial Surgery, Asan Medical Center, Seoul, Republic of Korea
3Department of Prosthodontics & Dental Research Institute, Seoul National University, Seoul, Republic of Korea
4Department of Prosthodontics, S-PLANT Dental Hospital, Seoul, Republic of Korea
5Department of Medical Statistics, Catholic University of Daegu School of Medicine, Daegu, Republic of Korea
PURPOSE. This study aims to investigate the degree of subjective pain and the satisfaction of patients who have undergone an implant treatment using a computer-guided template. MATERIALS AND METHODS. A survey was conducted for 135 patients who have undergone implant surgery with and without the use of the computer- guided template during the period of 2012 and 2013 in university hospitals, dental hospitals and dental clinics that practiced implant surgery using the computer-guided template. Likert scale and VAS score were used in the survey questions, and the independent t-test and One-Way ANOVA were performed (α=.05). RESULTS. The route that the subjects were introduced to the computer-guided implant surgery using a surgical template was mostly advices by dentists, and the most common reason for which they chose to undergo such surgery was that it was accurate and safe. Most of them gave an answer that they were willing to recommend it to others. The patients who have undergone the computer-guided implant surgery felt less pain during the operation and showed higher satisfaction than those who have undergone conventional implant surgery. Among the patients who have undergone computer-guided implant surgery, those who also had prior experience of surgery without a
computer-guided template expressed higher satisfaction with the former (P<.05). CONCLUSION. In this study, it could be seen that the patients who have undergone computer-guided implant surgery employing a surgical template felt less pain and had higher satisfaction than those with the conventional one, and the dentist’s description could provide the confidence about the safety of surgery. [J Adv Prosthodont 2014;6:395-405]
KEY WORDS: Dental implant; Computer-guided template; Patient satisfaction; Pain
INTRODUCTION
Implant treatment that makes a restoration from an edentu- lous state by installing an artificial tooth has been rapidly made available to the extent that approximately more than one million cases of implant surgery are carried out every year in the US and more than 30 types of implants are installed in over 50,000 cases in Korea.1,2 In the 1970s when dental implant surgery was carried out by a Brånemark sys- tem, it was performed by elevating a flap and even to date, the implant is installed by lifting a flap in many cases.3 However, if implant surgery is carried out with the flap lift- ing, dehiscence and inflammation in the incision site can
Corresponding author: Ji-Man Park
Department of Prosthodontics, School of Medicine, Ewha Womans University, 911-1 Mok-5-dong, Yangcheon-gu, Seoul, 158-710, Republic of Korea
Tel. 82 2 2650 5631: e-mail, [email protected]
Received 12 February, 2014 / Last Revision 21 July, 2014 / Accepted 28 July, 2014
© 2014 The Korean Academy of Prosthodontics
This is an Open Access article distributed under the terms of the Creative Commons Attribution Non-Commercial License (http://creativecommons.
org/licenses/by-nc/3.0) which permits unrestricted non-commercial use, distribution, and reproduction in any medium, provided the original work is properly cited.
+Shin-Young Youk and Jee-Ho Lee equally contributed to the works described in this manuscript.
This research was supported by Basic Science Research Program through the National Research Foundation of Korea (NRF) funded by the Ministry of Science, ICT & Future Planning (2013R1A1A1076022).
occur and the bone loss, pain or edema around the implant may be caused.4-8
Recently, flapless implant surgery that installs an implant without lifting a flap has been introduced and avail- able.9 It has been suggested that by eliminating incision and suturing, this technique could achieve rapid healing of mucosa, shallower gingival sulcus, less bone loss and higher stability of the implant.10,11 However, since surgery is car- ried out without considering the shape of alveolar bone in flapless implant surgery, it is difficult to install the implant to an appropriate bone position. A computer-guided tem- plate is fabricated using a dental cone beam tomography and a treatment planning program in order to assist in determining the location and direction of the implant, which is to be installed accordingly.12 Therefore, the shape of a patient’s jawbone can be evaluated three-dimensionally before surgery, which subsequently enables the evaluation of relevant important anatomical structures, and bone mass and density. In addition, it can help installing the implant in the desirable location where prosthesis can function prop- erly. Accordingly, by using a computer-guided template, advantages of flapless implant surgery can be exploited while its disadvantages as a blind technique are comple- mented to a certain degree.13
As implant surgery employing the computer-guided template have been increasingly available, studies on the accuracy of the guide system such as the comparison of the accuracy of computer-guided template,14-17 the impact of drilling for the implant on the heat generation in alveolar bone when using the computer-guided template18,19 and the complications due to the low accuracy of guide system20 have been carried out.
Recently, interests in conceptualizing the quantification of the recovery from the symptoms and the patients’ quality of life have been increasing.21 In 1998 Toronto Symposium, a consensus that the satisfaction of patients with the treat- ment had to be included in scales to measure the success of the implant treatment was reached and the subjective evalu- ation by patients has been included as one of the important factors for the successful implant surgery.22,23 McGrath et al.24 reported the increasing trend of patient-reported outcome measures (PROMS) through a systematic review of relevant previous studies, and Erkapers et al.25 investigated the satis- faction of patients with the immediate implant at 24 hours after surgery through a questionnaire. In a study on the relationship of the intravenous sedation with the anxiety of patients before surgery and the satisfaction of surgeons, it was suggested that the satisfaction of patients was lower if the anxiety of patients was higher before surgery, and it was not related to the satisfaction of surgeons.26 In a survey of the satisfaction with implant surgery itself, willingness of recommendations, pain and cost for the comparison of the pre- and post-surgery satisfactions of patients who have undergone implant surgery, the satisfaction with implant surgery itself was shown to be the highest among them.27 In a survey of the overall satisfaction of 100 patients who visited a clinic with the cost of the implant treatment, com-
fort, esthetics, chewing, gingival health, food impaction, phonetics, screw loosening and the implant itself, the low- est satisfaction was shown with the cost, and the food impaction and esthetics also displayed the low satisfaction.28 These earlier studies compared either the satisfaction with implant surgery and other surgery, or pre- and post-surgery satisfactions, and investigated the satisfaction with implant surgery itself, willingness of recommendation, pain and other factors.
Most of studies on the computer-guided template to date have been performed on the safety through the analy- sis of the accuracy with which implant could be installed at a planned site by determining anatomical structures such as the inferior alveolar nerve, and there have been very few studies that analyzed the satisfaction from the perspective of patients who have undergone implant surgery using the computer-guided template. This study aims to investigate the degree of subjective pain and the satisfaction of patients who have undergone implant surgery using the computer-guided template.
MATERIALS AND METHODS
The subjects for this study consisted of adults between the ages of 20 and 69 years, who have undergone implant sur- gery in dental hospitals or dental clinics in Seoul, where implant surgery was performed using the computer-guided template, and voluntarily agreed on the purpose of this clinical study. Patients with mental illness or alcoholism, or those with clinical conditions considered being unsuitable for this test under the medical judgment of investigators or personnel responsible for the test were excluded. A survey was conducted on 135 people who had undergone implant surgery irrespective of using the computer-guided template during the period of 2012 and the first half of 2013. The study protocol was approved by Institutional Review Board (IRB) in Ewha Womans University (IRB No. ECT 13-13- 04).The questionnaire was composed of 4 main sections containing a total of 25 questions; 5 questions for general characteristics such as gender, age, education level, and occupations, 5 questions for monthly incomes, 6 questions for general health such as current physical condition, dis- ease status and reasons for the choice of the hospital, and dental history, 12 questions for implant surgery such as implant sites, the number of implants and the number of hospital visits, and 2 questions for measuring the degree of pain and satisfaction.
Questions associated with the implant included which site they had implants installed in, whether the number of implants would act as a factor in choosing implant surgery, how often they visited hospital, and also whether they thought it was a right choice to have implant surgery. The first question was whether they were aware of the comput- er-guided template, and then depending on whether they had an experience of it, questions were varied. Patients who had experienced implant surgery with the computer-guided
template were asked to fill in a questionnaire about reasons for choosing it, the satisfaction with choosing it, concerns about the cost, whether they would recommend it to others and whether they would get the help of it again in next implant treatment. At the end of the questionnaire, the degree of pain during implant surgery and the satisfaction were asked irrespective of using the computer-guided tem- plate, and thereby it was attempted to compare patients who have undergone implant surgery with the computer- guided template with those who have without it.
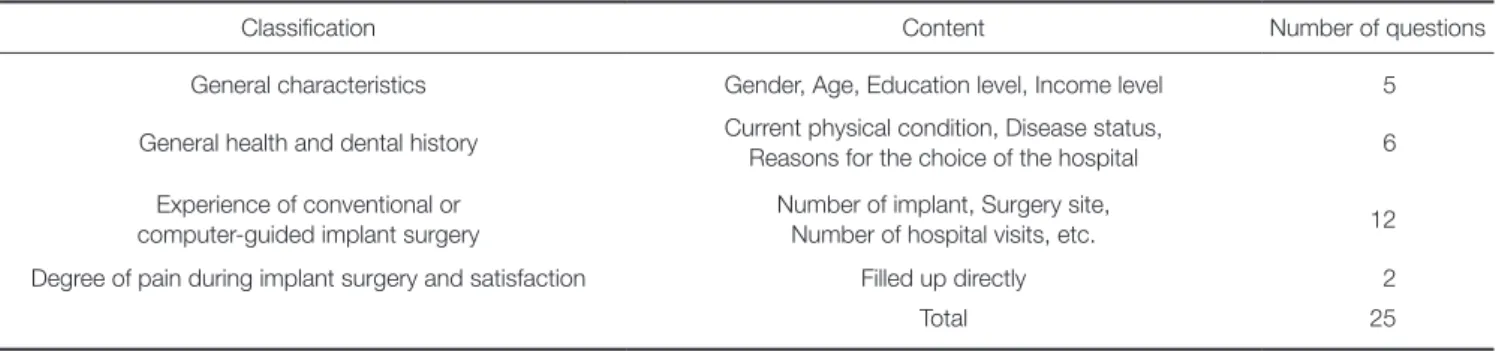
Questions were scored by 5-point scale (strongly agree=5 point, agree=4 point, neutral=3 point, disagree=2 point, strongly disagree=1 point). For questions asking the degree of pain during implant surgery and the satisfaction, investigators directly measured the area marked on the Visual Analogue Scale (VAS) with a ruler and recorded it to one decimal place (Table 1).
Among subjects who agreed to participate, those who complied with the clinical research plan were included in the final analysis. The collected data were analyzed by a sta- tistical program, IBM SPSS 19.0 according to the purpose of data analysis, and the independent t-test and one-way ANOVA were performed to determine VAS Score and the relationship between the satisfaction and variables. The maximum level of statistical significance was set at .05.
RESULTS
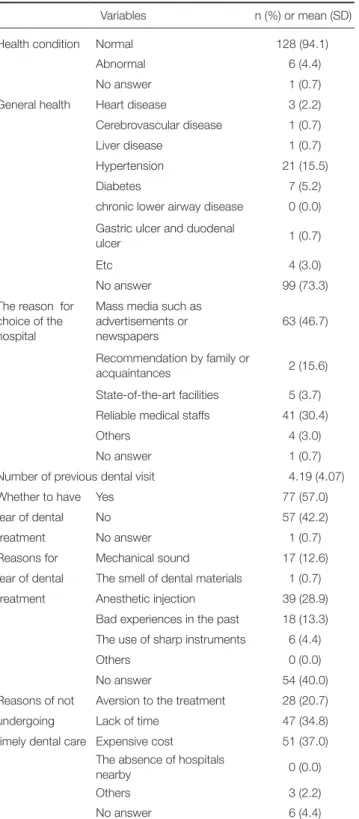
Demographic analysis of the patients enrolled in this study is shown in the Table 2. The general health and dental his- tory of research subjects is described in the Table 3.
The overall information of implant surgery, descrip- tions of implant surgery and the satisfaction, and the recog- nition and experience of the computer-guided template is shown in Table 4. Question about the sites and number of implants showed that the most common implant site was a lower molar (mandibular molar region) for 80 (50.3%) and the average number of teeth treated with implant surgery was 2.82. Also for the number of hospital visits during implant surgery, the answer from 61 participants (45.2%) was 11 - 16 times and 5 - 10 times from 47 participants Table 1. Major components of the questionnaire and its contents
Classification Content Number of questions
General characteristics Gender, Age, Education level, Income level 5
General health and dental history Current physical condition, Disease status,
Reasons for the choice of the hospital 6
Experience of conventional or computer-guided implant surgery
Number of implant, Surgery site,
Number of hospital visits, etc. 12
Degree of pain during implant surgery and satisfaction Filled up directly 2
Total 25
Table 2. General characteristics
Variables n (%) or mean (SD)
Gender Male 79 (58.5)
Female 56 (41.5)
Age 42.68 (10.98)
Occupations Agriculture, forestry, fishery
or self-employed 13 (9.6)
Professional 42 (31.1)
Professor, teacher, civil servant 13 (9.0) Technician, sales and service
worker 12 (8.9)
Office worker 22 (16.3)
Housewife 21 (15.6)
Student (high school, college,
graduate school) 8 (5.9)
Unemployed 0 (0.0)
No answer 4 (3.0)
Education Up to high school graduation 12 (18.5)
levels University students 9 (6.7)
University graduates 90 (66.7)
Graduate students and in
possession of a graduate degree 10 (7.4)
No answer 1 (0.7)
Average Less than 2 million won 38 (28.1)
monthly 2-3 million won 42 (31.1)
income 3-4 million won 32 (23.7)
4-5 million won 8 (5.9)
More than 5 million won 7 (5.2)
No answer 8 (5.9)
63 (46.7%) ‘agree’. Results of questions regarding the rec- ognition, experience, and satisfaction of the computer- guided template were as follows. To the question of wheth- er they were aware of it, answers from 39 participants (28.8%) were ‘yes’ and those from 92 (68.1%) were ‘no’, which indicated that there were more people who were not aware of it yet. To a question of whether they have under- gone surgery with a computer-guided template, 37 partici- pants gave an answer ‘yes’ and 90 (66.7%) gave ‘no’, which showed that the number of people who were aware of the computer-guided template was similar to those who have undergone surgery using it.
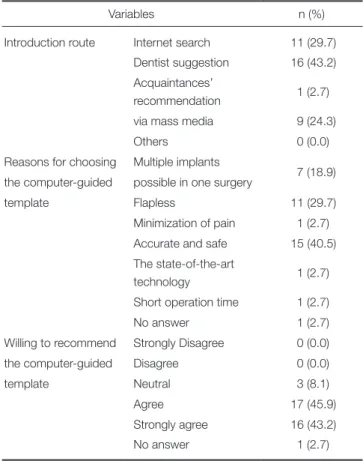
Introduction route to the computer-guided template, reasons for the choice of it, and willingness of recommen- dation is shown in Table 5. Questions regarding the intro- Table 3. General health and dental history (n=135)
Variables n (%) or mean (SD)
Health condition Normal 128 (94.1)
Abnormal 6 (4.4)
No answer 1 (0.7)
General health Heart disease 3 (2.2)
Cerebrovascular disease 1 (0.7)
Liver disease 1 (0.7)
Hypertension 21 (15.5)
Diabetes 7 (5.2)
chronic lower airway disease 0 (0.0) Gastric ulcer and duodenal
ulcer 1 (0.7)
Etc 4 (3.0)
No answer 99 (73.3)
The reason for choice of the hospital
Mass media such as advertisements or newspapers
63 (46.7)
Recommendation by family or
acquaintances 2 (15.6)
State-of-the-art facilities 5 (3.7) Reliable medical staffs 41 (30.4)
Others 4 (3.0)
No answer 1 (0.7)
Number of previous dental visit 4.19 (4.07)
Whether to have Yes 77 (57.0)
fear of dental No 57 (42.2)
treatment No answer 1 (0.7)
Reasons for Mechanical sound 17 (12.6)
fear of dental The smell of dental materials 1 (0.7)
treatment Anesthetic injection 39 (28.9)
Bad experiences in the past 18 (13.3) The use of sharp instruments 6 (4.4)
Others 0 (0.0)
No answer 54 (40.0)
Reasons of not Aversion to the treatment 28 (20.7)
undergoing Lack of time 47 (34.8)
timely dental care Expensive cost 51 (37.0) The absence of hospitals
nearby 0 (0.0)
Others 3 (2.2)
No answer 6 (4.4)
Table 4. Implant surgery and computer-guided template
Variables n (%) or mean (SD)
Implant surgery site Maxillary molar 53 (33.3) Maxillary anterior 12 (7.5) Mandibular molar 80 (50.3) Mandibular anterior 14 (8.8)
No answer 2 (1.2)
Average number of placed implants per patient 2.82 (2.54) Number of hospital visits Less than 5 times 14 (10.4)
5-10 times 47 (34.8)
11-16 times 61 (45.2)
16-20 times 8 (5.9)
More than 20 times 3 (2.2)
No answer 2 (1.5)
Implant satisfaction Strongly disagree 0 (0.0)
Disagree 0 (0.0)
Neutral 13 (9.6)
Agree 86 (63.7)
Strongly agree 34 (25.2)
No answer 2 (1.5)
Description of implants Strongly disagree 0 (0.0)
Disagree 0 (0.0)
Neutral 52 (38.5)
Agree 63 (46.7)
Strongly agree 18 (13.3)
No answer 2 (1.5)
Awareness of the Yes 39 (28.8)
computer-guided template No 92 (68.1)
No answer 4 (3.0)
Experience of a computer- Yes 37 (27.4)
guided template No 90 (66.7)
No answer 8 (5.9)
(34.8%). A question of whether they thought it was a right choice to take implant surgery showed that the answer
‘agree’ from 86 people (63.7%), and ‘strongly agree’ from 34 people (25.2%). As for a question of whether they were given a full description of implant surgery by dentists before surgery, 52 respondents (38.5%) were ‘neutral’, and
Table 5. Introduction route to the computer-guided template, reasons of choosing it, and willingness of recommendation (n=37*)
Variables n (%)
Introduction route Internet search 11 (29.7) Dentist suggestion 16 (43.2) Acquaintances’
recommendation 1 (2.7)
via mass media 9 (24.3)
Others 0 (0.0)
Reasons for choosing Multiple implants
7 (18.9) the computer-guided possible in one surgery
template Flapless 11 (29.7)
Minimization of pain 1 (2.7) Accurate and safe 15 (40.5) The state-of-the-art
technology 1 (2.7)
Short operation time 1 (2.7)
No answer 1 (2.7)
Willing to recommend Strongly Disagree 0 (0.0)
the computer-guided Disagree 0 (0.0)
template Neutral 3 (8.1)
Agree 17 (45.9)
Strongly agree 16 (43.2)
No answer 1 (2.7)
* Survey for 37 participants who have experienced the computer-guided template among a total of 135.
Table 6. Questions about the satisfaction with the computer-guided template in the order of Likert’s scale score
Question Mean (SD) n (%)
Strongly do not agree Do not agree Neutral Agree Strongly agree (P-value)
6 4.417 (0.554) 0 (0.0) 0 (0.0) 1 (2.8) 19 (52.8) 16 (44.4) 15.5 (0.000)*
5 4.333 (0.535) 0 (0.0) 0 (0.0) 1 (2.8) 22 (61.1) 13 (36.1) 18.5 (0.000)*
7 4.333 (0.586) 0 (0.0) 0 (0.0) 2 (5.6) 20 (55.6) 14 (38.9) 14 (0.001)*
1 4.200 (0.473) 0 (0.0) 0 (0.0) 1 (2.9) 26 (74.3) 8 (22.9) 28.514 (0.000)*
4 4.167 (0.507) 0 (0.0) 0 (0.0) 2 (5.6) 26 (72.2) 8 (22.2) 26 (0.000)*
2 4.139 (1.018) 0 (0.0) 3 (8.3) 7 (19.4) 8 (22.2) 18 (50.0) 13.556 (0.004)*
8 3.778 (0.832) 2 (5.6) 1 (2.8) 2 (5.6) 29 (80.6) 2 (5.6) 82.611 (0.000)*
3 3.694 (0.577) 0 (0.0) 0 (0.0) 13 (36.1) 21 (58.3) 2 (5.6) 15.167 (0.001)*
* : Statistically significant with P<.05
6: It was more comfortable when I underwent surgery with the computer-guided template, 5: I was relaxed during computer-guided implant surgery, 7: Implant surgery using the computer-guided template was satisfactory, 1: Before computer-guided implant surgery, I was satisfied with the decision, 4: After computer-guided implant surgery, I was less anxious, 2: The cost of implant surgery employing the computer-guided template was more expensive, 8: For the next chance, I would like to undergo computer-guided implant surgery again, 3: I fully understand the process of implant surgery employing the computer-guided template.
duction route to the computer-guided template, the reasons for choosing it, and willingness of recommendation gave following results. As for the route through which partici- pants were introduced to implant surgery using the com- puter-guided template, 11 respondents (29.7%) pointed out the internet search, 16 (43.2%) the dentist’s suggestion, 1 (2.7%) recommendations by acquaintances, and 9 (24.3%) mass media. The most frequently answered reason for choosing it was ‘accurate and safe’, followed by ‘flapless’
and ‘multiple implants possible in one surgery’. As for a question whether they were willing to recommend implant surgery using the computer-guided template to others, 3 respondents (8.1%) gave an answer ‘neutral’, 17 (45.9%) gave ‘agree’, 16 (43.2%) gave ‘strongly agree’, and 1 (2.7%) gave no answer.
The degree of satisfaction at the time of undergoing implant surgery employing the computer-guided template was represented in the order of the average value of the Likert scale, as shown in Table 6. The reliability (Cronbach’s α) of 8 questions about the satisfaction of patients who had undergone computer-guided implant surgery was 0.530. As for the response to the question of whether they felt less discomfort during implant surgery using the com- puter-guided template, 19 patients (52.8%) gave an answer
‘agree’, which was the highest rate, followed by ‘strongly agree’ with 16 patients (44.4%). The highest number of patients, 22 (61.1%), ‘agreed’ to the question of whether they felt relaxed during computer-guided implant surgery, followed by ‘strongly agree’ with 13 patients (36.1%).
Responses to the question of whether they were satisfied with computer-guided implant surgery showed that 20 patients (55.6%) gave ‘agree’, which was the highest rate followed by ‘strongly agree’ with 14 patients (38.9%).
Responses to the question of whether they were satisfied with their decision to undergo computer-guided surgery
showed that ‘agree’ was the highest rate answer with 26 patients (74.3%), followed by ‘strongly agree’ with 8 patients (22.9%). To the question of whether they felt less anxiety about surgery after undergoing computer-guided implant, ‘agree’ was the highest rate answer with 26 patients (72.2%), followed by ‘strongly agree’ with 8 patients (22.2%). To the question of whether they were concerned about the cost for implant surgery using the computer- guided template, 18 patients (50.0%) gave the answer
‘strongly agree’, which was the highest rate, followed by
‘agree’ with 8 patients (22.2%). To the question of whether they would use the computer-guided template at next implant treatment, the highest rate answer was ‘agree’ with 29 patients (80.6%). Finally, to the question of whether
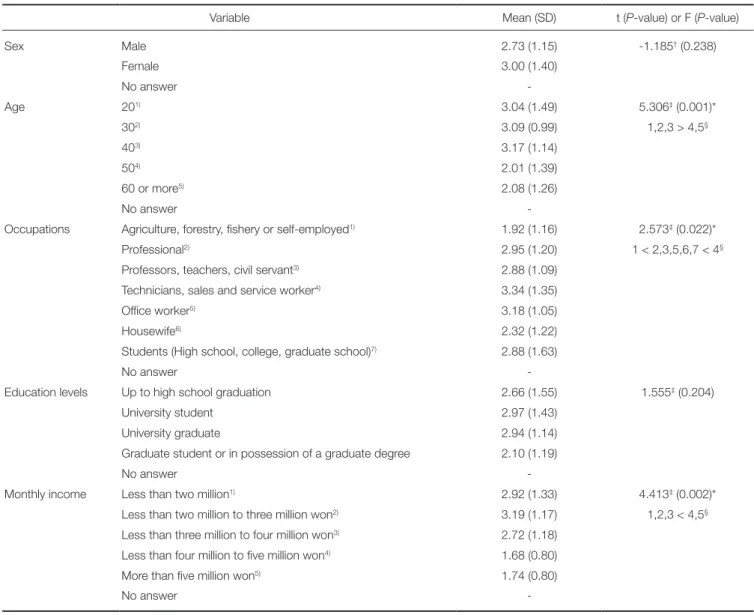
Table 7. VAS scores of the degree of pain during surgery according to general characteristics (n=135)
Variable Mean (SD) t (P-value) or F (P-value)
Sex Male 2.73 (1.15) -1.185† (0.238)
Female 3.00 (1.40)
No answer -
Age 201) 3.04 (1.49) 5.306‡ (0.001)*
302) 3.09 (0.99) 1,2,3 > 4,5§
403) 3.17 (1.14)
504) 2.01 (1.39)
60 or more5) 2.08 (1.26)
No answer -
Occupations Agriculture, forestry, fishery or self-employed1) 1.92 (1.16) 2.573‡ (0.022)*
Professional2) 2.95 (1.20) 1 < 2,3,5,6,7 < 4§
Professors, teachers, civil servant3) 2.88 (1.09)
Technicians, sales and service worker4) 3.34 (1.35)
Office worker5) 3.18 (1.05)
Housewife6) 2.32 (1.22)
Students (High school, college, graduate school)7) 2.88 (1.63)
No answer -
Education levels Up to high school graduation 2.66 (1.55) 1.555‡ (0.204)
University student 2.97 (1.43)
University graduate 2.94 (1.14)
Graduate student or in possession of a graduate degree 2.10 (1.19)
No answer -
Monthly income Less than two million1) 2.92 (1.33) 4.413‡ (0.002)*
Less than two million to three million won2) 3.19 (1.17) 1,2,3 < 4,5§ Less than three million to four million won3) 2.72 (1.18)
Less than four million to five million won4) 1.68 (0.80)
More than five million won5) 1.74 (0.80)
No answer -
* : Statistically significant with P<.05.
† : Result of two sample t-test.
‡ : Result of one way ANOVA.
§ : Result of multiple comparison by Tukey.
Superscript numbers in parenthesis mean the references for post hoc analysis.
they chose the implant surgical methods after fully under- standing it, 21 patients (58.3%) answered ‘agree’, which was the highest rate, followed by ‘neutral’ with 13 patients (36.1%).
The degree of pain with implant surgery according to the general characteristics of research subjects is shown in Table 7. In relation to the pain felt during implant surgery, there was statistically significant difference in the average VAS scores within the age groups, occupations, and the monthly incomes. Results according to the age groups showed that patients in their 50s or older felt less pain than those in their 20s-40s, with the scores shown to be 3.04 for 20s, 3.09 for 30s, 3.17 for 40s, 2.01 for 50s, and 2.08 for 60s or older (P<.05). Scores depending on occupations are as
follows; 1.92 for occupations in agricultural, forestry and fishery sectors or self-employed, 2.95 for professionals, 2.28 for professors, teachers and civil servants, 3.34 for technicians, sales and service workers, 3.18 for office work- ers, 2.32 for housewives and 2.88 for students (high school, university, graduate school). It was shown that employees in agricultural, forestry and fishery sectors or self-employed persons felt less pain than technicians, sales, service and office workers (P<.05). Scores depending on the monthly incomes are as follows; 2.92 for less than 2 million won, 3.19 for 2-3 million won, 2.72 for 3-4 million won, 1.68 for 4-5 million won and 1.74 for more than 5 million won. It was shown that patients earning more than 4 million won of the monthly income felt less pain than those earning less
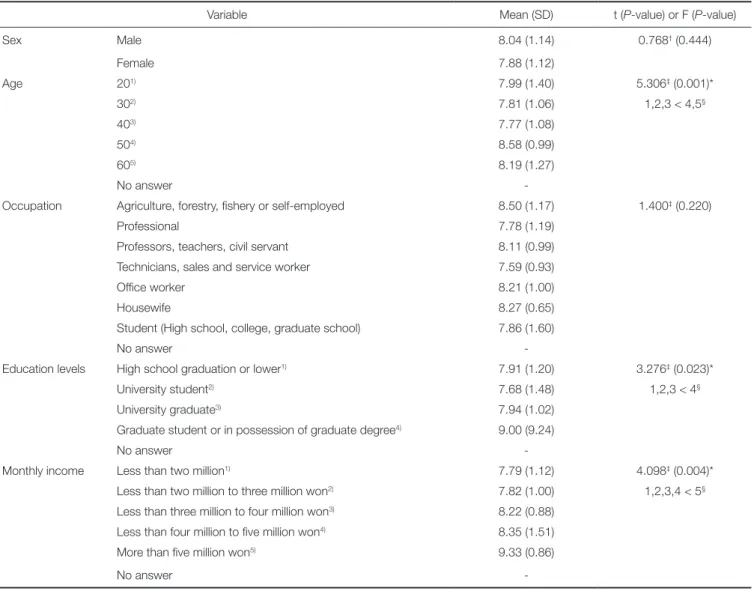
Table 8. VAS scores of the satisfaction with the implant according to general characteristics (n=135)
Variable Mean (SD) t (P-value) or F (P-value)
Sex Male 8.04 (1.14) 0.768† (0.444)
Female 7.88 (1.12)
Age 201) 7.99 (1.40) 5.306‡ (0.001)*
302) 7.81 (1.06) 1,2,3 < 4,5§
403) 7.77 (1.08)
504) 8.58 (0.99)
605) 8.19 (1.27)
No answer -
Occupation Agriculture, forestry, fishery or self-employed 8.50 (1.17) 1.400‡ (0.220)
Professional 7.78 (1.19)
Professors, teachers, civil servant 8.11 (0.99)
Technicians, sales and service worker 7.59 (0.93)
Office worker 8.21 (1.00)
Housewife 8.27 (0.65)
Student (High school, college, graduate school) 7.86 (1.60)
No answer -
Education levels High school graduation or lower1) 7.91 (1.20) 3.276‡ (0.023)*
University student2) 7.68 (1.48) 1,2,3 < 4§
University graduate3) 7.94 (1.02)
Graduate student or in possession of graduate degree4) 9.00 (9.24)
No answer -
Monthly income Less than two million1) 7.79 (1.12) 4.098‡ (0.004)*
Less than two million to three million won2) 7.82 (1.00) 1,2,3,4 < 5§ Less than three million to four million won3) 8.22 (0.88)
Less than four million to five million won4) 8.35 (1.51)
More than five million won5) 9.33 (0.86)
No answer -
* : Statistically significant with P<.05.
† : Result of two sample t-test.
‡ : Result of one way ANOVA.
§ : Result of multiple comparison by Tukey.
Superscript numbers in parenthesis mean the references for post hoc analysis.
than 2-4 million won (P<.05).
Analysis associated with the satisfaction with the implant showed that there was statistically significant differ- ence in the average VAS scores in the age groups, the edu- cation levels, and the monthly incomes (Table 8). Scores according to the age groups were 7.99 for 20s, 7.81 for 30s, 7.77 for 40s, 8.58 for 50s and 8.19 for 60s or older, which indicated that patients in their 50s or older felt higher satis- faction with implant surgery than those in their 20s-40s. As for the education levels, scores were 7.91 for high school graduation or lower, 7.68 for university students, 7.94 for university graduates and 9.00 for graduate school students or persons with a graduate degree, which showed that patients who were in graduate school or possessed a gradu-
Table 10. The survey of the satisfaction of patients who have experienced both computer-guided surgery and conventional surgery (n=16)
Variables n (%)
Satisfaction Yes 15 (93.8)
No 1 (6.2)
Table 9. The degree of pain and the satisfaction of patients who have experienced both computer-guided surgery and conventional surgery in VAS score (n=16)
Variable Mean (SD)
Degree of pain 1.244 (0.812)
Satisfaction 8.919 (0.854)
Fig. 1. Boxplot showing the relationship between the experience of computer-guided surgery and the degree of pain in VAS score. The patients who chose computer- guided surgery felt less pain than those who had surgery without a computer-guided template.
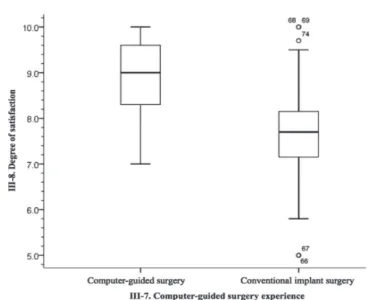
Fig. 2. Boxplot showing the relationship between the experience of computer-guided surgery and the satisfaction in VAS score. The patients who chose computer-guided surgery were more satisfied than those who had surgery without a computer-guided template.
ate degree felt higher satisfaction than those who had lower levels of education. Scores according to the monthly incomes were 7.79 for less than 2 million won, 7.82 for 2-3 million won, 8.22 for 3-4million won, 8.35 for 4-5 million won and 9.33 for more than 5 million won, which indicated that patients who earned more than 5 million won felt high- er satisfaction than those earning 2-5 million won.
The comparison of VAS scores that represent the degree of subjective pain from the perspectives of patients with or without the experience of computer-guided surgery was done (Fig. 1). In the visual analogue scale (VAS) with the maximum value of 10, patients who have undergone implant surgery without the computer-guided template gave a score of 3.34 on average, and those who have undergone computer-guided implant surgery gave a score of 1.14 on average, which indicated that patients who have had implant surgery with the computer-guided template felt less pain (P<.05). The average satisfaction that patients felt sub- jectively according to the experience of computer-guided template was evaluated (Fig. 2). Patients who have under-
gone implant surgery without it scored 7.66, while those with it scored 8.95, which showed higher level of satisfac- tion of patients who have undergone computer-guided implant surgery. The analysis showed that there were statis- tically significant differences in the degree of pain and the satisfaction between the computer-guided surgery group and the conventional surgery group (P<.05).
Satisfaction of patients who have experienced both con- ventional implant surgery and computer-guided surgery is shown in Table 9. Among 37 patients who have undergone computer-guided implant surgery, there were 16 patients who also had prior experience of traditional implant sur- gery before that with the computer-guided template. A sur- vey was conducted on 16 patients who have experienced both surgeries, and 15 patients (93.8%) gave ‘yes’ while 1 patient (6.2%) gave ‘no’ to the question of whether they had higher satisfaction with computer-guided surgery than conventional surgery (Table 10). Average values of the degree of pain and the satisfaction of 16 patients who have experienced both surgeries were 1.2 and 8.9, respectively.
DISCUSSION
The computer-guided implant surgical template is used in order to determine the site where an implant is installed within the mouth during surgery. As mentioned earlier, since the use of the computer-guided template results in faster healing of the mucous membrane and does not require the lifting of the periosteum, the depth of the gin- gival sulcus around the implant is reduced and the less bone loss occur. Subsequently, the implant stability is guaran- teed.10,11 Therefore, cases of computer-guided implant sur- gery have been increasing in recent years.29-31 In this study, the level of subjective pain during implant surgery and the satisfaction of patients according to the implant site, the number of implants, willingness of recommendations, the satisfaction with the computer-guided template and the use of it were assessed through the survey. VAS has been main- ly used in the pain research and has advantages of the easy application to patients, the easy statistical process compared to the subjectively classified survey responses, little or no communication failure and comparability with other studies.32
The mandibular molar accounted for 50.3% of implant sites, which was the highest rate, followed by the maxillary molar with 33.3%. Most of implants were installed in the mandibular molar region since the tooth loss occurs more frequently in the mandible than other regions.33 As for the number of hospital visits, 11-16 times was the most com- mon with 45.3%. Most of patients were satisfied with the description by dentists before implant surgery and the post- surgery progress.
28.8% of patients were aware of the computer-guided implant surgery while 68.1% of patients were not, which showed that more patients did not know it. However, the number of people who were aware of it and the number of people who received computer-guided implant surgery were almost identical, as 27.4% of patients have undergone sur- gery with it and 66.7% of patients have not. It is consid- ered that most of patients who had prior knowledge of the computer-guided template felt the need for a guide and subsequently chose computer-guided implant surgery. If patients recognize the computer-guided template through the full explanation, it will become one of the most impor- tant factors for choice of a treatment.
The highest rated answer for the introduction route to the computer-guided template was “the advice from the dentist”, accounting for 11.9%. Therefore, it is considered that dentists who frequently practice the computer-guided implant surgery provide patients with the information about the implant operation guide. As for the reasons to choose the computer-guided template, ‘accurate and safe’
practice was the most common reason, followed by ‘flap- less surgery that does not require an incision in the gum’.
On the contrary, ‘installation of multiple implants at a time’, ‘state-of-the-art technology’, and ‘short operation time’ were not considered to be reasons, and it is consid- ered that the safety and postoperative pain are more impor- tant factors for consideration from the perspective of
patients undergoing implant surgery. It is considered that patients who have experienced the computer-guided implant surgery have a good impression of the guide, as it was shown that 11.9% and 12.6% gave the responses
‘Strongly Agree’ and ‘Agree’, respectively for the question of whether they would recommend the implant surgery using a guide to their acquaintances.
The question that received the highest score among the 8 questions about the satisfaction with the computer-guided template according to the average score in Likert scale was
‘less discomfort during surgery’, followed by ‘comfortable during surgery’, ‘satisfied with computer-guided surgery immediately after the operation’ and ‘satisfied with a deci- sion of computer-guided surgery’. It can be inferred from the results that computer-guided surgery caused actually less discomfort compared to traditional surgery from the perspective of patients. It is considered that emotional dis- tress was also reduced during surgery. On the contrary, the question about the cost of computer-guided surgery scored 4.13, which indicated that patients felt the economic bur- den. However, the question about the willingness of using the computer-guided template again in the future implant treatments scored 3.8, which clearly showed that patients were generally satisfied with computer-guided surgery despite the economic burden.
Regarding the degree of pain in implant surgery accord- ing to variables, significant results were obtained only in the age and the monthly incomes. For the degree of pain, patients in their 50-60s or older were shown to feel less pain than patients in their 20-40s. Since the age group in which periodontal diseases begin to occur is mainly 40s due to many tooth losses,34 it is considered that the age groups who can experience more improvement of masticatory function after restoring the missing tooth are likely to have greater expectations for implant surgery and thus feel less pain. As for the monthly income, the group earning more than five million won of the monthly income showed high- er satisfaction than the group earning less than five million won. Shin et al.35 noted that dental care is considered expen- sive due to many treatments not covered by insurance, and patient who received treatments covered by insurance showed higher satisfaction with the cost than those who received non-covered treatments. Likewise in this study, it is considered that patients earning more than five million won of the monthly income could have higher satisfaction than those earning less than five million won, since the former can afford the treatment. The degree of subjective pain shown as VAS score suggested that patients who received computer-guided implant surgery felt less pain with the score of 1.41, while those who underwent conventional surgery without the computer-guided template scored 3.34.
The fear of treatment was identified as the most important factor of making patients not visit the dentistry,36 and one of the most important reasons for delaying or cancelling the appointment of dental care.37 In addition, a study also suggested that the fear of pain was considered to be the most uncomfortable aspect in visiting the dentist.38 The
results of this study imply that the computer-guided tem- plate may play a role in motivating patients who do not want to receive dental treatments due to the fear of pain to have a treatment, and become an alternative way that enables dentists to recommend the implant to patients with dental phobia.
Scores in the visual analog scale of the satisfaction with implant surgery were 7.66 from patients who have under- gone traditional implant surgery and 8.95 from those who have received computer-guided implant surgery, indicating that the latter showed higher satisfaction. In previous stud- ies on the satisfaction with overall implant surgery, Ganzberg et al.39 suggested that patient satisfaction was 84.1% through VAS, Garip et al.40 reported 95% of the sat- isfaction through 3-point Likert scale of ‘excellent, good, and poor’, and 52.2% of the satisfaction through 4-point scale was reported in another study.26 While the satisfaction with overall implant surgery appeared to be high in these studies, there was big difference between the studies depending on the design of the questionnaire.
Unlike previous studies on overall implant surgery that showed higher satisfaction, this study attempted to investi- gate the difference in the satisfaction depending on the dif- ferent implant surgical methods: the one with or without a computer-guided template. As a result, patients’ satisfaction with computer-guided implant surgery was shown to be higher and accordingly, it is recommended to suggest the use of the computer-guided template along with pre-surgi- cal description in order to enhance patients’ satisfaction with implant surgery.
Among 37 patients who have undergone computer- guided implant surgery, 16 patients have also had prior experience of traditional implant surgery without the guide, and 15 of them revealed that they had higher satisfaction with computer-guided surgery than with the traditional sur- gery. Although there is a limitation in comparing the two implant surgical methods as implants were not installed during the same period and in the identical sites, it is very suggestive since the results were based on patients who have experienced both ways of surgery. Through these results, it can be considered that the satisfaction with implant surgery through a guide can be higher with the experience.
Since this study was carried out only with patients who visited dental hospitals or dental clinics in limited areas, and subsequently samples were not collected by a statistical sampling method, this study has a certain limitation that the results cannot be generalized. In addition, since the com- puter-guided template is still not in general use, there are not many patients who have undergone computer-guided implant surgery, which limited the number of available research subjects and subsequently the sample size was small. There was a limitation in the comparative analysis due to the substantially small ratio of these research sub- jects compared to that of patients who have undergone conventional implant surgery without the computer-guided template. In the future research, factors that may affect data
need to be controlled by choosing target institutions through a statistical sampling method, and the data that could complement and generalize the previous studies by enlarging the sample size with increased number of research subjects should be acquired. Finally, if the clinical- ly measurable objective testing method is additionally com- bined with the patients’ subjective judgments, more objec- tive results can be derived.
CONCLUSION
From this study, ‘dentist’s suggestion’ was the most fre- quently answered introduction route to computer-guided surgery and ‘accurate and safe’ was the most frequently answered reason for choosing computer-guided implant surgery. Also, patients who had experienced both comput- er-guided and conventional treatments revealed that they felt less pain and higher satisfaction with computer-guided surgery.
It is considered that the quality of treatment can be enhanced in implant surgery and a wide range of options may be provided to patients, if sufficient information of the computer-guided implant surgery is provided to patients prior to surgery.
ACKNOWLEDGEMENTS
We thank to Prof. Shin for providing statistical alanysis in this study.
REFERENCES
1. Hong SJ, Paik JW, Kim CS, Choi SH, Lee KW, Chai JK, Kim CK, Cho KS. The Study of Implant Patient’s Type and Implant Distribution. J Korean Acad Periodontol 2002;32:
539-54.
2. Baek JW. Dental Implant. Korean society for Engineering Education 2002;1:87-90.
3. Brånemark PI, Hansson BO, Adell R, Breine U, Lindström J, Hallén O, Ohman A. Osseointegrated implants in the treat- ment of the edentulous jaw. Experience from a 10-year peri- od. Scand J Plast Reconstr Surg Suppl 1977;16:1-132.
4. Rahman AU, Rehman TU, Qureshi I, Hashim M, Warris N, Mateen S. Pre surgical perception of pain, post surgical pain and its management for patients undergoing dental implant therapy. J Pak Dent Assoc 2012;21:5-11.
5. Jaffin RA, Kumar A, Berman CL. Immediate loading of im- plants in partially and fully edentulous jaws: a series of 27 case reports. J Periodontol 2000;71:833-8.
6. Canullo L, Fedele GR, Iannello G, Jepsen S. Platform switch- ing and marginal bone-level alterations: the results of a ran- domized-controlled trial. Clin Oral Impl Res 2010;21:115-21.
7. Cannizzaro G, Leone M, Consolo U, Ferri V, Esposito M.
Immediate functional loading of implants placed with flap- less surgery versus conventional implants in partially edentu- lous patients: a 3-year randomized controlled clinical trial. Int J Oral Maxillofac Implants 2008;23:867-75.
8. Van der Zee E, Oosterveld P, Van Waas MA. Effect of GBR and fixture installation on gingiva and bone levels at adjacent teeth. Clin Oral Implants Res 2004;15:62-5.
9. Brodala N. Flapless surgery and its effect on dental implant outcomes. Int J Oral Maxillofac Implants 2009;24:118-25.
10. Jeong SM, Choi BH, Kim J, Xuan F, Lee DH, Mo DY, Lee CU. A 1-year prospective clinical study of soft tissue condi- tions and marginal bone changes around dental implants af- ter flapless implant surgery. Oral Surg Oral Med Oral Pathol Oral Radiol Endod 2011;111:41-6.
11. Becker W, Wikesjö UM, Sennerby L, Qahash M, Hujoel P, Goldstein M, Turkyilmaz I. Histologic evaluation of implants following flapless and flapped surgery: a study in canines. J Periodontol 2006;77:1717-22.
12. Azari A, Nikzad S. Flapless implant surgery: review of the lit- erature and report of 2 cases with computer-guided surgical approach. J Oral Maxillofac Surg 2008;66:1015-21.
13. Sudbrink SD. Computer-guided implant placement with im- mediate provisionalization: a case report. J Oral Maxillofac Surg 2005;63:771-4.
14. Lee JH, Park JM, Kim SM, Kim MJ, Lee JH, Kim MJ. An as- sessment of template-guided implant surgery in terms of ac- curacy and related factors. J Adv Prosthodont 2013;5:440-7.
15. Park JM, Yi TK, Jung JK, Kim Y, Park EJ, Han CH, Koak JY, Kim SK, Heo SJ. Accuracy of 5-axis precision milling for guided surgical template. J Korean Acad Prosthodont 2010;
48:294-300.
16. Valente F, Schiroli G, Sbrenna A. Accuracy of computer-aid- ed oral implant surgery: a clinical and radiographic study. Int J Oral Maxillofac Implants. 2009;24:234-42.
17. Fortin T, Bosson JL, Coudert JL, Isidori M. Reliability of preoperative planning of an image-guided system for oral im- plant placement based on 3-dimensional images: an in vivo study. Int J Oral Maxillofac Implants 2003;18:886-93.
18. Misir AF, Sumer M, Yenisey M, Ergioglu E. Effect of surgi- cal drill guide on heat generated from implant drilling. J Oral Maxillofac Surg 2009;67:2663-8.
19. Marković A, Mišić T, Miličić B, Calvo-Guirado JL, Aleksić Z, Ðinić A. Heat generation during implant placement in low- density bone: effect of surgical technique, insertion torque and implant macro design. Clin Oral Implants Res 2013;24:
798-805.
20. Jeong SM, Yoo JH, Fang Y, Choi BH, Son JS, Oh JH1. The effect of guided flapless implant procedure on heat genera- tion from implant drilling. J Craniomaxillofac Surg 2013;
S1010-5182(13).
21. Kim KW, Lee KS, Kang PS, Kim WS, Lee HK. Comparison of chewing ability and quality of life before and after the dental implantation. J Korean Acad Prosthodont 2009;47:
215-21.
22. Attard NJ, Zarb GA. Implant prosthodontic management of partially edentulous patients missing posterior teeth: the Toronto experience. J Prosthet Dent 2003;89:352-9.
23. Zarb GA, Albrektsson T. Consensus report: towards opti- mized treatment outcomes for dental implants. J Prosthet Dent 1998;80:641.
24. McGrath C, Lam O, Lang N. An evidence-based review of
patient-reported outcome measures in dental implant re- search among dentate subjects. J Clin Periodontol 2012;39:
193-201.
25. Erkapers M, Ekstrand K, Baer RA, Toljanic JA, Thor A.
Patient satisfaction following dental implant treatment with immediate loading in the edentulous atrophic maxilla. Int J Oral Maxillofac Implants 2011;26:356-64.
26. González-Lemonnier S, Bovaira-Forner M, Peñarrocha- Diago M, Peñarrocha-Oltra D. Relationship between preop- erative anxiety and postoperative satisfaction in dental im- plant surgery with intravenous conscious sedation. Med Oral Patol Oral Cir Bucal 2010;15:e379-82.
27. Han JH, Kim KE. Comparison of Expectation and Satisfaction of Implant Patients in Pre-post Implant Therapy.
J Dent Hyg Sci 2011;11:121-7.
28. Heo YY, Heo SJ, Chang MW, Park JM. The patients› satisfac- tion following implant treatment. J Korean Acad Prosthodont 2008;46:569-76.
29. Choi BH, Jeong SM, Kim J, Engelke W. Flapless implantology.
1st ed. London; Quintessence Publishing Co; 2010. p. 66-71.
30. Van Assche N, van Steenberghe D, Guerrero ME, Hirsch E, Schutyser F, Quirynen M, Jacobs R. Accuracy of implant placement based on pre-surgical planning of three-dimen- sional cone-beam images: a pilot study. J Clin Periodontol 2007;34:816-21.
31. Horwitz J, Zuabi O, Machtei EE. Accuracy of a computer- ized tomography-guided template-assisted implant placement system: an in vitro study. Clin Oral Implants Res 2009;20:
1156-62.
32. Huskisson EC. Measurement of pain. Lancet. 1974;2:1127-31.
33. Meskin LH, Brown LJ. Prevalence and patterns of tooth loss in U.S. employed adult and senior populations, 1985-86. J Dent Educ 1988;52:686-91.
34. Kim GU, Cho SM. A Study on the Factors Giving Effects to Patient’s Satisfaction in the Selection of Implant Operation. J Korea Acad-Ind Coop Soc 2010;11:4354-9.
35. Shin HC, Choi HS. The Impact of Physician Behaviors on Patient Satisfaction. Korean J Fam Med 1994;15:1157-70.
36. Kvale G, Berg E, Nilsen CM, Raadal M, Nielsen GH, Johnsen TB, Wormnes B. Validation of the Dental Fear Scale and the Dental Belief Survey in a Norwegian sample.
Community Dent Oral Epidemiol 1997;25:160-4.
37. Han SH. Anxiety and fear of dental patient. J Korean Dent Assoc 1993;31:1-8.
38. Kim KW, Nam CH. A Study of Students’ Knowledge Level of Dental Health Care. J Korean Soc School Health 2000;13:
295-317.
39. Ganzberg S, Pape RA, Beck FM. Remifentanil for use during conscious sedation in outpatient oral surgery. J Oral Maxillofac Surg 2002;60:244-50.
40. Garip H, Gürkan Y, Toker K, Göker K. A comparison of midazolam and midazolam with remifentanil for patient-con- trolled sedation during operations on third molars. Br J Oral Maxillofac Surg 2007;45:212-6.