INTRODUCTION
Anaphylaxis is a possibly fatal allergic reaction with a rapid on- set.1 It is the most severe form of allergic reactions and should be considered a medical emergency. The exact incidence of ana- phylaxis from all triggers is unknown and is increasing accord- ing to recently published data.2-5 Data from Siriraj Hospital (Thai- land) found that the annual occurrence of anaphylaxis increased from 9.16 per 100,000 admitted patients in 1999 to 55.45 per 100,000 admitted patients in 2004.6 In this series, drugs were the most common cause of anaphylaxis followed by food. Seafood (especially shrimp) is the most common cause of food-induced anaphylaxis in Thai children.6
The diagnosis of anaphylaxis is based primarily on clinical history.1 In some circumstances, the inability to confirm a clini- cal diagnosis was due to an unusual presentation that likely contributes to the under-recognition and under-treatment of anaphylaxis.2
The Utility of Serum Tryptase in the Diagnosis of Food-Induced Anaphylaxis
Patcharaporn Wongkaewpothong,
1Punchama Pacharn,
2Chaweewan Sripramong,
2Siribangon Boonchoo,
2Surapon Piboonpocanun,
3Nualanong Visitsunthorn,
2Pakit Vichyanond,
2Orathai Jirapongsananuruk
2*
1Department of Pediatrics, School of Medicine, Institute of Medicine, Suranaree University of Technology, Nakhonratchasima, Thailand
2Division of Allergy and Immunology, Department of Pediatrics, Faculty of Medicine Siriraj Hospital Mahidol University, Bangkok, Thailand
3Institute of Molecular Biosciences, Mahidol University, Nakhonpathom, Thailand
Currently, products of mast cell activation (such as total trypt- ase) can be measured in clinical laboratories as markers of ana- phylaxis; however, these tests have clinical relevance limitations.7 Even in optimally timed samples, serum total tryptase levels are seldom elevated in patients with food-induced anaphylaxis.8 Nevertheless, food is the most common trigger of anaphylaxis in most age groups.9 The proportion of food-induced anaphy- laxis was 15-57% of patients with anaphylaxis presenting to the emergency department.10
The development of a laboratory test with improved sensitivi- ty and specificity is required to support the clinical diagnosis of Purpose: This study investigates the utility of serum tryptase for the confirmation of shrimp-induced anaphylaxis. Methods: Patients with a his- tory of shrimp allergy and positive skin prick tests (SPT) to commercial shrimp extract were recruited for shrimp challenges. Serum total tryptase was obtained at baseline and 60 min (peak) after the onset of symptoms. Results: Thirty-nine patients were challenged. There were 12 patients with anaphylaxis, 20 with mild reactions and 7 without symptoms (control group). Characteristic features and baseline tryptase were not different among the 3 groups. The peak tryptase levels were higher than the baseline in anaphylaxis and mild reaction groups (P<0.05). The delta-tryptase (peak mi- nus baseline) and the tryptase ratio (peak divided by baseline) in the anaphylaxis group were higher than the mild reaction and control groups (P<0.01). The optimum cut-off for peak tryptase to confirm anaphylaxis was 2.99 µg/L with 50% sensitivity, 85% specificity, 3.33 positive likelihood ratio (LR) and 0.59 negative LR. The manufacturer’s cut-off for peak tryptase was >11.4 μg/L with 17% sensitivity, 100% specificity, infinity positive LR and 0.83 negative LR. The best cut-off for delta-tryptase was ≥0.8 µg/L with 83% sensitivity, 93% specificity, 11.86 positive LR and 0.18 nega- tive LR. The best cut-off for tryptase ratio was ≥1.5 with 92% sensitivity, 96% specificity, 23 positive LR and 0.08 negative LR. Conclusions: The peak tryptase level should be compared with the baseline value to confirm anaphylaxis. The tryptase ratio provide the best sensitivity, specificity, positive and negative LR than a single peak serum tryptase for the confirmation of shrimp-induced anaphylaxis.
Key Words: Anaphylaxis; food; tryptase; shrimp
This is an Open Access article distributed under the terms of the Creative Commons Attribution Non-Commercial License (http://creativecommons.org/licenses/by-nc/3.0/) which permits unrestricted non-commercial use, distribution, and reproduction in any medium, provided the original work is properly cited.
Correspondence to: Orathai Jirapongsananuruk, MD, Division of Allergy and Immunology, Department of Pediatrics, Siriraj Hospital Mahidol University 2 Prannok Rd, Bangkoknoi, Bangkok, 10700, Thailand.
Tel: +662-419-7000 X5670; Fax: 662-418-4223; Email: [email protected] Received: March 5, 2013; Revised: June 6, 2013; Accepted: July 4, 2013
•There are no financial or other issues that might lead to conflict of interest.
Allergy Asthma Immunol Res. 2014 July;6(4):304-309.
http://dx.doi.org/10.4168/aair.2014.6.4.304 pISSN 2092-7355 • eISSN 2092-7363
anaphylaxis. Consecutive measurements of total serum tryptase during an anaphylaxis episode and after the complete resolution of the anaphylaxis are reported to be better than a single speci- men at the peak level.11,12 However, the role of a consecutive measurement approach to verify food-induced anaphylaxis has not been fully investigated.
This study investigates the utility of consecutive total tryptase measurements for the confirmation of shrimp-induced ana- phylaxis in children.
MATERIALS AND METHODS Subjects
The study was approved by the Institutional Review Board, Siriraj Hospital, Mahidol University, Thailand. Informed con- sent was obtained from parents or patients over the age of 18.
Patients over 5 years of age who came to the pediatric allergy clinic of Siriraj Hospital with a history of shrimp allergy were asked to participate in this study. Patients who had underlying diseases such as cardiovascular, chronic renal, lung and liver diseases were excluded; in addition, patients with a history of a severe anaphylactic reaction from seafood were also excluded from this study due to an ethical issue. Patients were asymp- tomatic on the days of skin tests and food challenges.
Skin-test procedure
Skin prick tests (SPT) were performed on all patients with a commercial shrimp extract (Center Laboratory, Port Washing- ton, NY, USA). Histamine phosphate (10 mg/mL) and glycerin- ated saline were used as positive and negative control, respec- tively.13 SPTs were performed using single use metal lancets on the back of the patients. Antihistamines were discontinued ≥7 days prior to skin tests. The size of wheal and flare reactions were recorded in millimeters (mm). The mean wheal diameter (MWD) was calculated from the sum of the largest measurement across the wheal and the wheal measurement perpendicular to the former and divided by two. SPT was considered positive if the MWD was ≥3 mm compared to negative control.
Food-challenged procedure
Food challenge to shrimp was performed in patients with SPT positive to a commercial shrimp extract. An open food challenge test was done according to a previously reported protocol.13 In- creased doses of lyophilized shrimp in capsules were given to patients every 15 min until the cumulative dose (15.5 g) was reached; however, young patients who could not swallow cap- sules were allowed to skip this process. To identify oral-mucosa reactions, 2 g of cooked shrimp was wiped on the inner lips and placed in the mouth without chewing and spat out after 5 min.
Fifteen min later, increased doses of cooked shrimp were given to patients every 15 min until the cumulative dose (63 g) was reached. Vital signs and symptoms were recorded every 15
min. Food challenges were considered positive if there were symptoms or signs of allergic reaction.
Blood samples were collected before the challenge test (base- line tryptase) and 60 min after the onset of allergic symptoms or after test completion (peak tryptase). For the comparative analysis of total tryptase data, we divided patients into 3 groups according to the challenge’s results: patients who developed anaphylaxis (anaphylaxis group), patients who had mild aller- gic reactions (mild reaction group) and patients who had a neg- ative challenge (control group).
Definition of anaphylaxis
In this study, anaphylaxis was defined according to recent cri- teria.1 Anaphylaxis was diagnosed in a patient when 2 or more of the following clinical criteria occurred after exposure to a likely allergen: 1) skin or mucosal tissue involvement 2) respira- tory compromise 3) reduced blood pressure or associated symp- toms or 4) gastrointestinal symptoms.
The definition of mild allergic reaction was an acute allergic reaction that could not fulfill the diagnostic criteria of anaphy- laxis.
Serum tryptase measurement
After centrifugation at 1,500 g for 10 min, sera were frozen at -80˚C until testing. Total tryptase levels were measured by Uni- CAP Tryptase fluoroenzyme immunoassay according to the manufacturer’s instructions (Pharmacia, Uppsala, Sweden).
According to the manufacturer, the 95 upper percentile of the total tryptase level in healthy children and adults was 11.4 µg/L.14
Delta-tryptase and tryptase ratio values represented the change in serum tryptase levels induced by an acute allergic reaction.
Delta-tryptase values for each individual were calculated from the peak minus baseline tryptase levels. The tryptase ratio val- ues of each individual were calculated from the peak tryptase divided by baseline tryptase levels.
Data collection and analysis
Data were expressed as individual values or the mean±SD for groups. Median and range were used for non-normally distrib- uted data. Data of 3 groups (anaphylaxis, mild reaction and control group) were initially analyzed by a Kruskal-Wallis test and pairwise comparisons utilized a Mann-Whitney U-test.
Differences in total tryptase values before and after a challenge test in each group were analyzed by a Wilcoxon signed-rank test.
Differences were considered significant at a P value of ≤0.05.
For the peak tryptase, sensitivity and specificity to diagnose anaphylaxis were determined using the manufacturer’s recom- mended cut-off (≤11.4 µg/L) and alternate cut-off according to a receiver-operating characteristics (ROC) curve analysis. A ROC curve analysis helped determine an optimal diagnostic cut-off for a change from baseline tryptase (delta-tryptase and tryptase ratio); subsequently, this approach was compared to peak trypt-
ase by an examination of the areas under the respective ROC curves. We calculated the likelihood ratio (LR) to determine the validity of a diagnostic test. The positive LR was the sensitivity divided by (1-specificity). The negative LR was the (1-sensitivi- ty) divided by specificity. A high LR >10 or a low LR <0.1 had a significant impact on likelihood.
RESULTS Demographic data
Thirty-nine patients were included in this study. After an open shrimp challenge, anaphylaxis were documented in 12/39 pa- tients (30.8%, anaphylaxis group) and mild allergic reactions were documented in 20/39 patients (51.3%, mild reaction group).
Seven patients had no symptoms after exposure to both species of shrimp (17.9%, control group). All patients with positive chal- lenges developed symptoms during the challenge or immedi- ately after the test completion; in addition, neither biphasic nor persistent anaphylaxis was observed. All of the patients in the mild reaction group had cutaneous involvement only. The most common symptom of the anaphylaxis group was the cutane- ous system (100%) followed by the gastrointestinal (83.3%) and respiratory system (58.3%). None of the patients had cardiovas-
cular symptoms. All patients in the anaphylaxis group indicat- ed moderate severity in accordance to the anaphylaxis grading system of Brown.15
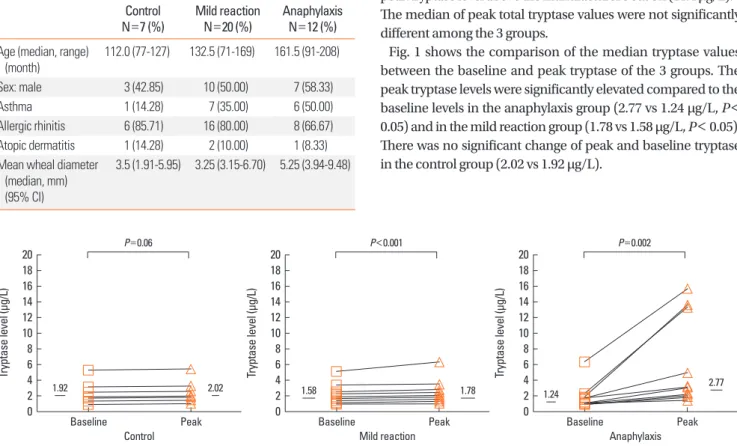
Table 1 summarizes the demographic data and allergic co- morbidities of the 3 groups. There was no significant difference in the data among the 3 groups.
The median of MWD of commercial shrimp extract was 3.5 mm (IQR 3 mm, 95% CI 1.91-5.95 mm) for the control group, 3.25 mm (IQR 4.25 mm, 95% CI 3.15-6.70 mm) for the mild re- action group and 5.25 mm (IQR 5.5 mm, 95% CI 3.94-9.48) for the anaphylaxis group. There was no statistically significant dif- ference in MWD among the 3 groups.
Consecutive total tryptase measurement
The median of the baseline total tryptase was 1.92 µg/L (IQR 1.83 µg/L, 95% CI 1.08-3.76 µg/L) for the control group, 1.58 µg/
L (IQR 0.84 µg/L, 95% CI 1.30-2.22 µg/L) for the mild reaction group and 1.24 µg/L (IQR 0.91 µg/L, 95% CI 0.84-2.84 µg/L) for the anaphylaxis group. The median of baseline total tryptase values were not significantly different among the 3 groups.
The median of peak total tryptase was 2.02 µg/L (IQR 1.73 µg/
L, 95% CI 1.14-3.87 µg/L) for the control group, 1.78 µg/L (IQR 0.93 µg/L, 95% CI 1.49-2.60 µg/L) for the mild reaction group and 2.77 µg/L (IQR 9.7 µg/L, 95% CI 2.09-9.23 µg/L) for the ana- phylaxis group. Only 3 patients in the anaphylaxis group had a peak tryptase level above the manufacturer’s cut off (11.4 µg/L).14 The median of peak total tryptase values were not significantly different among the 3 groups.
Fig. 1 shows the comparison of the median tryptase values between the baseline and peak tryptase of the 3 groups. The peak tryptase levels were significantly elevated compared to the baseline levels in the anaphylaxis group (2.77 vs 1.24 µg/L, P<
0.05) and in the mild reaction group (1.78 vs 1.58 µg/L, P< 0.05).
There was no significant change of peak and baseline tryptase in the control group (2.02 vs 1.92 µg/L).
Table 1. Demographic data among the 3 groups of patients Control
N=7 (%) Mild reaction
N=20 (%) Anaphylaxis N=12 (%) Age (median, range)
(month) 112.0 (77-127) 132.5 (71-169) 161.5 (91-208)
Sex: male 3 (42.85) 10 (50.00) 7 (58.33)
Asthma 1 (14.28) 7 (35.00) 6 (50.00)
Allergic rhinitis 6 (85.71) 16 (80.00) 8 (66.67)
Atopic dermatitis 1 (14.28) 2 (10.00) 1 (8.33)
Mean wheal diameter (median, mm) (95% CI)
3.5 (1.91-5.95) 3.25 (3.15-6.70) 5.25 (3.94-9.48)
Fig. 1. The change in the total tryptase in control, mild reaction and anaphylaxis groups during shrimp challenges. Baseline and peak tryptase values are designated by closed squares and closed triangulars, respectively. Horizontal bars indicate medians. NS: not significant.
Tryptase level (μg/L)
Baseline Control 1.92
P=0.06
2.02 Peak 20
18 16 14 12 10 8 6 4 2 0
Tryptase level (μg/L)
Baseline
Mild reaction 1.58
P<0.001
1.78 Peak 20
18 16 14 12 10 8 6 4 2 0
Tryptase level (μg/L)
Baseline
Anaphylaxis 1.24
P=0.002
2.77 Peak 20
18 16 14 12 10 8 6 4 2 0
Delta-tryptase and tryptase ratio values among the 3 groups The delta-tryptase and tryptase ratio were calculated. The me- dian of the delta-tryptase was 0.07 µg/L (IQR 0.11 µg/L, 95% CI 0.03-0.14 µg/L) for the control group, 0.16 µg/L (IQR 0.28 µg/L, 95% CI 0.11-0.45 µg/L) for the mild reaction group and 1.42 µg/
L (IQR 7.28 µg/L, 95% CI 0.95-6.69 µg/L) for the anaphylaxis group.
The median of the tryptase ratio was 1.02 (IQR 0.03, 95% CI 1.00-1.07) for the control group, 1.10 (IQR 0.27, 95% CI 1.05-1.31) for the mild reaction group and 2.22 (IQR 1.34, 95% CI 1.72-4.02) for the anaphylaxis group.
Fig. 2 shows the change in the total tryptase using the delta- tryptase and tryptase ratio among the 3 groups. The delta-trypt- ase values in the anaphylaxis group were significantly higher than in the mild reaction and control groups (1.42 vs 0.16 µg/L, P<0.001 and 1.42 vs 0.07 µg/L, P<0.001, respectively; Fig. 2A).
Similarly, the tryptase ratio values in the anaphylaxis group were significantly higher than in the mild reaction and control groups (2.22 vs 1.02, P<0.001 and 2.22 vs 1.02, P<0.001, respec- tively; Fig. 2B).
ROC curve analysis
ROC curve analysis for tryptase measurements are presented in Fig. 3. ROC established the best cutoff of the peak tryptase at 2.99 µg/L whereas the manufacturer’s cut-off was 11.4 µg/L. The delta-tryptase and tryptase ratio values performed significantly better than the peak tryptase values (P=0.009 using the delta- tryptase and P=0.015 using the tryptase ratio). The best cut-off to confirm anaphylaxis was ≥0.8 µg/L for the delta-tryptase and ≥1.5 for the tryptase ratio. There was no significant sensi- tivity and specificity difference to confirm the diagnosis of ana- phylaxis between these 2 values. Table 2 summarizes the sensi- tivity, specificity, positive and negative LR of the peak tryptase, delta-tryptase and tryptase ratio using the best cut-off points; in addition, it shows that the tryptase ratio provided the best posi- tive and negative LR.
DISCUSSION
Patients with a history of anaphylaxis were excluded from our prospective study due to ethical concerns; however, anaphylax- is was found in 30% of the patients. The severity of anaphylaxis was moderate and all patients responded well to emergency treatment. This was supported by a previous study which dem- onstrated that children with only previous mild reactions to food may suffer more severe reactions16 and that most fatal-anaphy- lactic reactions are unpredictable.17
Fig. 2. (A) Box plot of the delta-tryptase values (peak minus baseline tryptase) in control, mild reaction and anaphylaxis groups. (B) The box plot of tryptase ratio val- ues (peak divided by baseline tryptase) in the control, mild reaction and anaphylaxis groups.
Delta-tryptase (μg/L)
Anaphylaxis Mild reaction
Control
P<0.001 P<0.001 12
8
4
0
A
Tryptase ratio (μg/L)
Anaphylaxis Mild reaction
Control
P<0.001 P<0.001 12
8
4
0
B
Table 2. Sensitivity, specificity, positive and negative likelihood ratio of the peak tryptase, delta-tryptase and tryptase ratio using optimum cut-off points and the peak tryptase value (>11.4 µg/L) recommended by the manufacturer
Cut-off Sensitivity Specificity Positive likelihood
ratio
Negative likelihood
ratio
Peak tryptase >11.4 μg/L 0.17 1.00 ∞ 0.83
Peak tryptase ≥2.99 μg/L 0.50 0.85 3.33 0.59
Delta tryptase ≥0.8 μg/L 0.83 0.93 11.86 0.18
Tryptase ratio ≥1.5 0.92 0.96 23 0.08
Fig. 3. Receiver-operator characteristics (ROC) curve analysis of peak serum tryptase, delta-tryptase and tryptase ratio for the diagnosis of anaphylaxis.
Sensitivity
1.0 0.8 0.6 0.4 0.2
00.0 0.2 0.4 0.6 0.8 1.0
1-Specificity
Delta-tryptase Peak-tryptase Tryptase ratio Reference line
The most common presentation of anaphylaxis in our study was cutaneous manifestation. The gastrointestinal (GI) involve- ment in our series was 83% (similar to other series) and indicat- ed that the GI system was involved the most often in food-in- duced anaphylaxis.9 The GI symptoms in this study include nausea, vomiting, abdominal pain and diarrhea; therefore, the diagnostic criteria used at least 2 out of 4 organ involvements for the diagnosis of anaphylaxis since GI symptoms can be non- specific. None of our patients had cardiovascular symptoms upon challenges. This could be due to the close observation and immediate treatment after the onset of symptoms. In addition, other series also demonstrated that hypotension and shock are less common as early manifestations of childhood anaphylaxis.18
Human tryptases in the circulation consist mainly of mature or active β-tryptases and inactive pro-tryptases (α and β). The baseline levels of serum tryptase consist of pro-α and pro-β tryptases; however, mature β-tryptases are released by the de- granulation of mast cells.19 The widely available tryptase assay from the Phadia ImmunoCAP system measures all forms of cir- culating tryptase. After the onset of anaphylaxis, serum tryptase reached its peak levels at 1-2 hr and returned to baseline 24 hr after the complete resolution of symptoms.10,20 A clinical setting allowed a baseline tryptase sample to be collected at 24-48 hr after the symptoms resolve; therefore, we were able to obtain a baseline tryptase level prior to an anaphylaxis episode.
The tryptase level was considered elevated for only a small subset of patients in food induced anaphylaxis. Yunginger et al.
reported that only 6/8 of food-induced anaphylactic victims had an elevation of tryptase, compared to 9/9 of hymenoptera stings and 2/2 fatalities caused by diagnostic agents.21 Sampson et al. reported serial measurements of tryptase in five cases of food-induced anaphylaxis; however, they failed to detect trypt- ase in serum samples.8 A recent study by Sala-Cunill et al. dem- onstrated that peak tryptase levels were significantly higher in patients with drug induced anaphylaxis versus food-induced anaphylaxis.22 This study also showed that peak levels of trypt- ase depended on the anaphylaxis severtity.22 A lower peak trypt- ase level in food-induced anaphylaxis (compared to other forms of anaphylaxis) could be explained by the study of Schwartz et al. They reported that mucosal mast cells contained less trypt- ase compared to skin mast cells. Gut mucosal mast cells were expected to play a major role in food-induced anaphylaxis and might result in less tryptase released into circulation.23
Our study found a significant increase in the peak compared to baseline tryptase levels in patients with a mild reaction and the anaphylaxis group after shrimp challenges. However, only 3 patients had a peak tryptase level above the manufacturer’s cut off. It was likely that the anaphylaxis conditions of our patients were in the moderate severity and the peak tryptase levels were not as high as severe anaphylaxis.22,24 Nevertheless, other patients with anaphylaxis could have missed this severe allergic reaction if we relied on a single peak tryptase value that lacked adequate
sensitivity.
Consecutive tryptase measurements were suggested by a number of studies. In a series described by Brown et al., a serial tryptase measurement was significantly elevated in patients with anaphylaxis.11 Peak tryptase levels had a sensitivity of 36%
and a specificity of 93% using the recommended cut-off range whereas the delta-tryptase ≥2.0 μg/L had a sensitivity of 73%
and a specificity of 98%. Enrique et al. investigated the useful- ness of a reaction-tryptase/baseline-tryptase ratio and found that the ratio was 2.85 in anaphylactic and 1.29 in non-anaphy- lactic groups.25 A recent study by Borer-Reinhold et al. reported that a relative tryptase increase to ≥135% of the baseline value suggested anaphylaxis even if the peak tryptase was below 11.4 ng/mL.26
Our study supported the above studies to use a delta-tryptase or tryptase ratio instead of a single peak tryptase value for the confirmation of anaphylaxis. We demonstrated (through the use of an ROC to determine the best cut-off) that the delta-tryptase or tryptase ratio provided a higher sensitivity, specificity, posi- tive LR and lower negative LR compared to a single peak trypt- ase value. Among all the values, the tryptase ratio provided the best positive and negative LR followed by delta-tryptase.
The strength of our prospective study was that each case clear- ly satisfied the recent definition of anaphylaxis with unequivo- cal signs of a systemic mediator release in a control situation.
Limitations of our study were the small number of cases and the single measurement of total tryptase levels at 60 min after the onset of symptoms. Some authors suggest serial tryptases for optimum results since anaphylaxis to food allergens can de- velop more slowly or be biphasic24,27; however, this procedure cannot be applied under routine conditions.
In conclusion, we recommend that the measurement of the peak tryptase should be compared with baseline values. The calculations of tryptase ratio and/or delta-tryptase values are more helpful than a single peak serum tryptase for the diagno- sis of shrimp-induced anaphylaxis.
REFERENCES
1. Sampson HA, Muñoz-Furlong A, Campbell RL, Adkinson NF Jr, Bock SA, Branum A, Brown SG, Camargo CA Jr, Cydulka R, Galli SJ, Gidudu J, Gruchalla RS, Harlor AD Jr, Hepner DL, Lewis LM, Li- eberman PL, Metcalfe DD, O’Connor R, Muraro A, Rudman A, Schmitt C, Scherrer D, Simons FE, Thomas S, Wood JP, Decker WW. Second symposium on the definition and management of anaphylaxis: summary report--Second National Institute of Allergy and Infectious Disease/Food Allergy and Anaphylaxis Network symposium. J Allergy Clin Immunol 2006;117:391-7.
2. Lieberman P, Camargo CA Jr, Bohlke K, Jick H, Miller RL, Sheikh A, Simons FE. Epidemiology of anaphylaxis: findings of the American College of Allergy, Asthma and Immunology Epidemiology of Ana- phylaxis Working Group. Ann Allergy Asthma Immunol 2006;97:
596-602.
3. Koplin JJ, Martin PE, Allen KJ. An update on epidemiology of ana-
phylaxis in children and adults. Curr Opin Allergy Clin Immunol 2011;11:492-6.
4. Lin RY, Anderson AS, Shah SN, Nurruzzaman F. Increasing ana- phylaxis hospitalizations in the first 2 decades of life: New York State, 1990 -2006. Ann Allergy Asthma Immunol 2008;101:387-93.
5. Poulos LM, Waters AM, Correll PK, Loblay RH, Marks GB. Trends in hospitalizations for anaphylaxis, angioedema, and urticaria in Australia, 1993-1994 to 2004-2005. J Allergy Clin Immunol 2007;120:
878-84.
6. Jirapongsananuruk O, Bunsawansong W, Piyaphanee N, Visitsun- thorn N, Thongngarm T, Vichyanond P. Features of patients with anaphylaxis admitted to a university hospital. Ann Allergy Asthma Immunol 2007;98:157-62.
7. Simons FE, Frew AJ, Ansotegui IJ, Bochner BS, Golden DB, Finkel- man FD, Leung DY, Lotvall J, Marone G, Metcalfe DD, Müller U, Rosenwasser LJ, Sampson HA, Schwartz LB, van Hage M, Walls AF.
Risk assessment in anaphylaxis: current and future approaches. J Allergy Clin Immunol 2007;120:S2-24.
8. Sampson HA, Mendelson L, Rosen JP. Fatal and near-fatal anaphy- lactic reactions to food in children and adolescents. N Engl J Med 1992;327:380-4.
9. Beyer K, Eckermann O, Hompes S, Grabenhenrich L, Worm M.
Anaphylaxis in an emergency setting - elicitors, therapy and inci- dence of severe allergic reactions. Allergy 2012;67:1451-6.
10. Lemon-Mulé H, Nowak-Wegrzyn A, Berin C, Knight AK. Patho- physiology of food-induced anaphylaxis. Curr Allergy Asthma Rep 2008;8:201-8.
11. Brown SG, Blackman KE, Heddle RJ. Can serum mast cell tryptase help diagnose anaphylaxis? Emerg Med Australas 2004;16:120-4.
12. Shanmugam G, Schwartz LB, Khan DA. Prolonged elevation of se- rum tryptase in idiopathic anaphylaxis. J Allergy Clin Immunol 2006;
117:950-1.
13. Jirapongsananuruk O, Sripramong C, Pacharn P, Udompunturak S, Chinratanapisit S, Piboonpocanun S, Visitsunthorn N, Vichyanond P. Specific allergy to Penaeus monodon (seawater shrimp) or Mac- robrachium rosenbergii (freshwater shrimp) in shrimp-allergic children. Clin Exp Allergy 2008;38:1038-47.
14. Thermo Fisher Scientific Inc (SE). ImmunoCAP tryptase. Direc- tions for use [Internet]. Uppsala: Thermo Fisher Scientific Inc.;
2012 [cited 2013 Jan 12]. Available from: http://www.phadia.com/
da/Products/Allergy-testing-products/ImmunoCAP-Assays/Im-
munoCAP-Tryptase/.
15. Brown SG. Clinical features and severity grading of anaphylaxis. J Allergy Clin Immunol 2004;114:371-6.
16. Vander Leek TK, Liu AH, Stefanski K, Blacker B, Bock SA. The nat- ural history of peanut allergy in young children and its association with serum peanut-specific IgE. J Pediatr 2000;137:749-55.
17. Pumphrey R. Anaphylaxis: can we tell who is at risk of a fatal reac- tion? Curr Opin Allergy Clin Immunol 2004;4:285-90.
18. Braganza SC, Acworth JP, McKinnon DR, Peake JE, Brown AF. Pae- diatric emergency department anaphylaxis: different patterns from adults. Arch Dis Child 2006;91:159-63.
19. Brown SG, Stone SF. Laboratory diagnosis of acute anaphylaxis. Clin Exp Allergy 2011;41:1660-2.
20. Stone SF, Cotterell C, Isbister GK, Holdgate A, Brown SG; Emergen- cy Department Anaphylaxis Investigators. Elevated serum cyto- kines during human anaphylaxis: Identification of potential medi- ators of acute allergic reactions. J Allergy Clin Immunol 2009;124:
786-92.e4.
21. Yunginger JW, Squillace DL, Jones RT, Helm RM. Fatal anaphylac- tic reactions induced by peanuts. Allergy Proc 1989;10:249-53.
22. Sala-Cunill A, Cardona V, Labrador-Horrillo M, Luengo O, Esteso O, Garriga T, Vicario M, Guilarte M. Usefulness and limitations of se- quential serum tryptase for the diagnosis of anaphylaxis in 102 pa- tients. Int Arch Allergy Immunol 2013;160:192-9.
23. Schwartz LB, Irani AM, Roller K, Castells MC, Schechter NM. Quan- titation of histamine, tryptase, and chymase in dispersed human T and TC mast cells. J Immunol 1987;138:2611-5.
24. Caughey GH. Tryptase genetics and anaphylaxis. J Allergy Clin Im- munol 2006;117:1411-4.
25. Enrique E, García-Ortega P, Sotorra O, Gaig P, Richart C. Usefulness of UniCAP-Tryptase fluoroimmunoassay in the diagnosis of ana- phylaxis. Allergy 1999;54:602-6.
26. Borer-Reinhold M, Haeberli G, Bitzenhofer M, Jandus P, Hausmann O, Fricker M, Helbling A, Müller U. An increase in serum tryptase even below 11.4 ng/mL may indicate a mast cell-mediated hyper- sensitivity reaction: a prospective study in Hymenoptera venom al- lergic patients. Clin Exp Allergy 2011;41:1777-83.
27. Ordoqui E, Zubeldia JM, Aranzábal A, Rubio M, Herrero T, Tornero P, Rodriguez VM, Prieto A, Baeza ML. Serum tryptase levels in ad- verse drug reactions. Allergy 1997;52:1102-5.