Paper
곡면형상의 알루미늄 하니콤/CFRP 샌드위치 패널에 관한 실험적 연구
롸르네* · 박용빈* · 권진회*
†· 최진호**
Experimental Testing of Curved Aluminum Honeycomb/CFRP Sandwich Panels
Rene Roy
*, Yong-Bin Park*, Jin-Hwe Kweon*
†, Jin-ho Choi**
ABSTRACT:This paper presents the fabrication and 3-point flexion testing of carbon fiber reinforced polymer (CFRP) composite face/aluminum honeycomb core sandwich panels. Specimen sandwich panels were fabricated with three honeycomb types (3.18 mm, 4.76 mm, and 6.35 mm cell size) and three panel radii (flat, r = 1.6 m, r = 1.3 m). The curved sandwiches were fabricated normally with the core in the W-direction. The tensile mechanical properties of the CFRP 2 × 2 twill fabric face laminate were evaluated (modulus, strength, Poisson’s ratio). The measured values are comparable to other CFRP fabric laminates. The flat sandwich 3-point flexion test core shear strength results were 11- 30% lower than the manufacturer published data; the test set-up used may be the cause. With a limited sample size, the 1.3 meter panel curvature appeared to cause a 0.8-3.8% reduction in ultimate core shear strength compared to a flat panel.
초 록: 본 논문에서는 탄소섬유강화플라스틱 면재와 알루미늄 샌드위치 심재를 가지는 복합재 샌드위치의 제조와 3절점 굽힘 실험에 대해 연구하였다. 시편은 3가지 하니컴 종류(3.18 mm, 4.76 mm, 6.35 mm의 셀 크기)와 3가지 곡 률 반지름(평판, r = 1.6 m, r = 1.3 m)을 가지도록 제작하였다. 샌드위치 곡률의 기준은 W-방향을 기준으로 제작 하 였다. CFRP 2 × 2 트윌의 인장에서 기계적 물성치(탄성계수, 강도, 푸아송 비)를 측정하여 그 값들을 다른 CFRP 섬 유 적층판의 값과 비교하였다. 실험결과 평판 샌드위치 패널의 3절점 굽힘 실험에서 심재의 전단강도는 공개된 데 이터에 비해 11-30% 낮게 나왔다. 제한된 시편 크기에서 1.3미터 곡률을 가지는 패널은 평판 패널에 비해 심재의 극 한 전단강도가 0.8-3.8% 감소한 것으로 나타났다.
Key Words: 샌드위치(sandwich), 하니컴(honeycomb), 탄소섬유강화플라스틱(carbon fiber reinforced polymer), 곡률 (curvature), 굽힘(flexion)
1. INTRODUCTION
Sandwich panel construction is notably attractive for the high specific flexural rigidity it provides. Sandwich panels are typically composed of two thin faces that cover a light core material. The faces are usually stiff and strong and take up ten-
sile and compressive stress in bending. The core maintains a distance between the two faces and mainly sustains shear stress [1]. Aluminum honeycomb is a common core material in sandwich panels. It provides a very high strength/density ratio and is available in different hexagonal cell size (typ. 3.18- 9.53 mm) and density (i.e. aluminum foil thickness, typ.
접수: 2012년 12월 05일, 수정: 2013년 3월 18일, 게재승인: 2013년 3월 18일
*Department of Aerospace and System Engineering, Research Center for Aircraft Parts Technology, Gyeongsang National University
*†Department of Aerospace and System Engineering, Gyeongsang National University, Corresponding author(E-mail: [email protected])
**School of Mechanical Engineering, Gyeongsang National University
0.0178-0.102 mm) [2]. For example, comparing similar 3.18 mm cell size and 128-129 kg/m3 density aluminum and Nomex® type honeycomb cores, the aluminum core has 54.7-72.4%
higher directional shear strengths [2,3]. The strength charac- teristics of aluminum honeycomb sandwich panels has been studied through experimental tests and analytical models [4], and also with finite element analysis [5]. Fatigue of the core and the face/core adhesive bond joint are also important phe- nomena to consider [5]. Aluminum honeycomb cores have been applied for example in aerospace, marine and industrial applications. Polymer composite laminates are also a common face material used in sandwich construction. Carbon fiber reinforced polymer (CFRP), notably the carbon/epoxy variant, are widely used as high performance composite materials.
They provide high stiffness/density and strength/density ratios. The combination of aluminum honeycomb/CFRP can therefore produce a high performance low weight sandwich structure. Galvanic corrosion degradation of this sandwich can however be a concern [6]. This would arise from the dissimilar galvanic potential values of the aluminum and the CFRP (par- ticularly the carbon fibers). This concern can be lessened by using a glass/epoxy fabric as the first ply in contact with the core. Additionally, aluminum honeycomb cores with enhanced corrosion resistance are available [7].
In this study, aluminum honeycomb/CFRP composite sand- wich panels were fabricated and tested in flexion. The tensile mechanical properties of the face laminate, a carbon/epoxy twill 2 × 2 fabric, were also evaluated. Sandwich panel spec- imens with three radii (flat, r = 1.6 m, r = 1.3 m) and three honeycomb types (3.18 mm-72.1 kg/m3, 4.76 mm-70.5 kg/m3, 6.35 mm-68.9 kg/m3) were fabricated. Quasi-static 3-point flexural load testing of the panels was performed and the results are reported. The main objectives of this study were to characterize the tensile mechanical properties of the carbon/
epoxy fabric composite laminate; compare the core shear strength of the fabricated sandwich panels to manufacturer data; and verify the effect of curvature on the core shear strength of the sandwich. This study focused on initial mate- rial mechanical properties; galvanic corrosion concerns were disregarded.
2. EXPERIMENTAL DESCRIPTION
2.1 Materials
The aluminum honeycomb core material used was of the type PAMG-XR1 5052 with perforated walls manufactured by Plascore Inc., USA [2]. It’s an aerospace and military grade 5052 aluminum honeycomb core with a corrosion resistant coating. Three cell sizes with different wall thickness yielding similar honeycomb density were tested (Table 1). All honey- combs tested had a nominal height of 10 mm. The facing material was made from carbon/epoxy 2 × 2 twill fabric prepregs, the Sky Flex WSN-3KT manufactured by SK Chem-
icals Ltd., South Korea (www.skchemicals.com). An epoxy adhesive film, Hysol EA9696 (Henkel Co. USA) was used to bond the faces to the core. It had an aerial weight of 293 g/m2 for a theoretical thickness of 0.253 mm (with ρ = 1.16 g/cm3).
2.2 Sandwich panel fabrication
Sandwich panel test samples were fabricated using vacuum bag molding in an autoclave oven. Three different molds were used: a flat 10.9 mm thick steel plate and two 40 mm thick alu- minum plates with machined radii of 1.3 and 1.6 meter (Fig.
1). The raw panels fabricated had an area of 230 × 300 mm.
The first process step was to cure the bottom face alone.
Both faces had 4-ply stacking sequence of [0/452/0]. The bag- ging material sequence used was as follows: mold treated with Frekote 700-NC release agent (Henkel AG & Co. Germany), prepreg stack, peel-ply fabric, release film, breather, and bag.
Vacuum was applied to the bag along with the cure cycle pre- sented in Fig. 2. The coupon specimens for the laminate tensile tests were also fabricated in this way. This face laminate had an average thickness of 0.91 mm.
The next step was to add the honeycomb core alone to the bottom face. This was done alone to observe any distortions to the core from curvature. The face was first lightly sanded with grit #1000 sandpaper to remove any residue from the peel-ply fabric. An adhesive film was then applied followed by the core
Table 1. Aluminum honeycomb cores tested [2]
Cell size [mm]
Wall thickness [mm]
Density [kg/m3]
W-direction shear strength (plate shear method) [MPa]
3.18 0.0254 72.1 1.52
4.76 0.0381 70.5 1.48
6.35 0.0508 68.9 1.45
Fig. 1. Molds with 230 × 300 mm raw panels.
Fig. 2. Carbon/epoxy prepreg cure cycle parameters.
with the honeycomb’s W-direction lengthwise (for direction definition, see [8]). This was put under vacuum bag and cured at 120oC for 2 hours with only the vacuum generated pressure.
During fabrication, the cores could easily be shaped to the mold curvature with light hand pressure. While minimal, the 6.35 mm cell core appeared slightly more susceptible to hon- eycomb hexagon distortion during this process. An attempt was made to apply the core with its L-direction lengthwise in the curved molds. While still possible, it required more hand pressure and caused some localized distortions of the core at interval distances (Fig. 3). A suitable honeycomb core with enhanced forming capability could be more appropriate in this case [8].
The last sandwich fabrication step was to add an adhesive film and the top face laminate on the honeycomb in place. The laminate was stacked and pressed by hand on a table before being placed. The assembled sandwich was put into vacuum bag with the same bagging material sequence as in the first step. The same prepreg temperature cure cycle was used (Fig.
2). In an attempt to minimize face waviness, only a 1 atm auto- clave pressure was applied starting at the beginning of the ramp up to 120oC. The vacuum was released when the pres- sure reached 0.5 atm. Further cure cycle study at this step, along with comparative face waviness and porosity analysis, is possible for this material combination [9,10].
2.3 Test set-up
The tensile properties of the carbon/epoxy fabric composite laminate were evaluated by ASTM D3039 [11]. Specimens in the 0o (warp), 45o, and 90o (fill) directions were cut from a 4-ply laminate ([0]4) with a diamond blade saw. Overall specimen dimensions were 25 mm (W) × 250 mm (L) × 0.91 mm (t).
Pairs of glass/epoxy laminate tabs measuring individually 25 mm × 50 mm × 1.5 mm were fixed to the specimens with epoxy adhesive. A 2-element 90o cross rosette strain gage was installed on the smooth (mold side) surface of the specimens at the center after light sanding the surface with grit #1000 sandpaper. The gage used were model UFCA-2-17-3L (2 mm gage length) on the 0o and 45o specimens, and model FCA-3- 11-1L (3 mm gage length) on the 90o specimens, manufactured by Tokyo Sokki Kenkyujo Co., Ltd. The 3 mm gage length gage was used to verify any influence on measurement scatter.
The tensile tests were performed using a universal tension test-
ing press model Instron 5582 from Illinois Tool Works Inc.
with a 100 kN load cell. Load was applied through a constant head displacement rate of 2 mm/min.
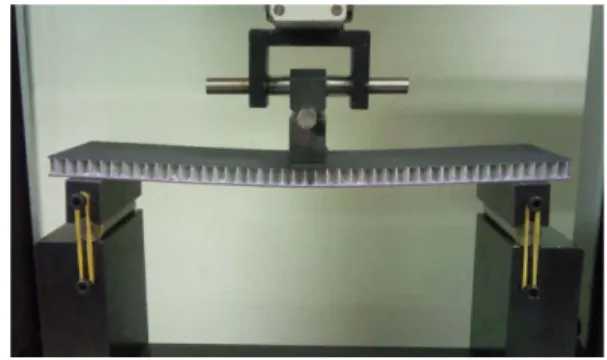
Sandwich panel specimens were tested in 3-point flexion following the ASTM C393 standard [12]. Specimens were cut to nominal dimensions of 70 mm (W) × 290 mm (L) with the face orientation [0/452/0] in the length direction. The manu- factured total sandwich height averaged 11.67 mm, which is lower than merely adding the faces and core height (10 + 2 · 0.91 = 11.82 mm). This is most likely caused by some com- paction of the last face cured on top of the honeycomb core.
The flexion tests were performed using a universal testing press model LR 10K from Lloyd Instruments Ltd. equipped with a 10 kN load cell. Load was applied with a constant head displacement rate of 2 mm/min. The specimen was supported with and the mid-span load was applied through steel blocks measuring 80 mm by 20 mm. A 3.5 mm thick rubber pad was also used under the mid-span load block. This set-up is meant to prevent systematic crushing of the core at the contact points. The mid-span load block also had a pivot joint. The distance between support block center lines was 250 mm, giv- ing a free span length of 230 mm. This span length was chosen to promote a core shear failure mode. The smooth (mold side) surface of the sandwich was placed at the bottom tension side.
This also meant that the curved panels were placed on the sup- ports with “pre-curvature”.
3. RESULTS AND ANALYSIS
3.1 CFRP laminate
The fabricated CFRP specimens had one slightly textured surface caused by the use of a peel-ply fabric on the bag side.
The twill 2 × 2 fabric has better drapability than a comparable plain weave fabric, making it more attractive to be used in components with complex 3D geometries [13,14]. For that reason, the use of caul plates was avoided as it might generally be less practical to use in those cases. The peel-ply fabric pro- vided an even textured surface but appeared to absorb slightly too much resin, which can be detrimental to the properties of the laminate. For that reason its use is not ideal for all appli- cations. Nonetheless, the average obtained ply thickness of Fig. 3. Honeycomb distortion from bending in the L-direction.
Fig. 4. 3-Point flexion test set-up.
0.2275 mm was in line with the manufacturer published value of 0.227 mm [15]. The average cured ply areal weight, mea- sured from a 4-ply 206.5 mm × 275.75 mm laminate, was 326.32 ± 0.39 g/m2. This is lower than the manufacturer pub- lished value of 336 g/m2, which may be due to resin absorption by the peel-ply.
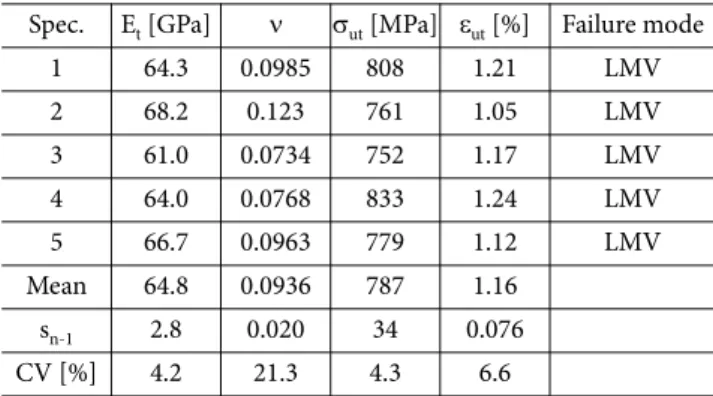
The tensile test results for CFRP laminate are presented in Tables 2, 3 and 4. The 0o and 90o direction specimens showed linear elastic behaviors up to failure, while the 45o direction specimens failed after going through a non-linear transition with large strains. The tensile modulus (Et) and Poisson’s ratio (ν) were calculated from a linear regression of the stress/strain and strain ratio (εy/εx) slopes respectively in the strain range of 0.1-0.3%. A transition point was determined for the 45o direc-
tion specimen by a 0.05% strain offset of the stress/strain slope; a transition strength (σtr) and transition strain (εtr) were determined at this point. The failure mode is reported as per ASTM D3039 [11]: failure type (lateral (L), angled (A)), failure area (gage (G), within one width length from the tab (W), multiple (M)), and failure location (top (T), bottom (B), var- ious (V)). The failure often occurred simultaneously at mul- tiple locations, including near or at the tabs, which is undesirable.
Consequently, the tensile ultimate strength (σut) and tensile ultimate strain (εut) values should be interpreted with caution (actual values could be higher). The specimen thickness used (4-ply, t = 0.91 mm) was meant to represent the actual face thickness of the sandwich to be tested. While this is permitted by the standard, for example a specimen thickness of 2.5 mm is recommended for a balanced and symmetric laminate and was found by experience to produce desirable failure modes.
The thinner specimen used may have been more susceptible to failure near the tabs. The 90o direction specimens, which used longer 3 mm gage length strain gages, had slightly higher Pois- son’s ratio coefficient of variation (CV). This is a little sur- prising, but on an absolute basis, the Poisson’s ratio standard deviations (sn-1) measured are acceptable for most engineering practice (sn-1≈ 0.02-0.04). Using laminated plate theory for an orthotropic material, the in-plane shear modulus (G0-90) can be estimated from the average moduli in the three directions (E0, E45, E90) and the average Poisson’s ratio of directions 0°
and 90° (ν0-90) (equation 1). The properties obtained are in the range of other carbon/epoxy prepreg fabric materials tensile properties in the fabric warp and fill directions (Table 5).
(1)
3.2 Sandwich flexion
Fig. 5 shows typical stress/displacement plots for the three core types. A more or less definite shear stress plateau occurred at the maximum stress levels. Diagonal shear buckling on the honeycombs was visible on both sides of the load point with increasing load level. This would eventually lead to the hon- eycomb collapse on one of either side, with a corresponding transition point in stress/displacement curve. After that, increasing local bending of the top face at the collapsed region
G0 90– 4 E45 --- 1
E0 ---
– 1
E90 ---
– 2ν0 90– E0 ---
⎝ + ⎠
⎛ ⎞–1 3.63 GPa
= =
Table 2. 0o (warp) direction CFRP static tension test results Spec. Et [GPa] ν σut [MPa] εut [%] Failure mode
1 64.3 0.0985 808 1.21 LMV
2 68.2 0.123 761 1.05 LMV
3 61.0 0.0734 752 1.17 LMV
4 64.0 0.0768 833 1.24 LMV
5 66.7 0.0963 779 1.12 LMV
Mean 64.8 0.0936 787 1.16
sn-1 2.8 0.020 34 0.076
CV [%] 4.2 21.3 4.3 6.6
Table 3. 90o (fill) direction CFRP static tension test results Spec. Et [GPa] ν σut [MPa] εut [%] Failure mode
1 63.1 0.0394 829 1.26 LMV
2 67.6 0.116 844 1.19 LMV
3 63.6 0.0725 796 1.19 LMV
4 65.7 0.104 837 1.22 LMV
5 67.2 0.138 785 1.09 LMV
Mean 65.5 0.0939 818 1.19
sn-1 2.0 0.039 26 0.061
CV [%] 3.1 41.1 3.2 5.1
Table 4. 45o direction CFRP static tension test results Spec. Et
[GPa] ν σtr
[MPa]
σut
[MPa]
εtr
[%]
εut
[%]
Failure mode 1 13.9 0.842 65.8 202 0.510 11.4 AGT 2 13.7 0.839 61.7 200 0.493 11.7 AGT 3 12.4 0.813 59.4 192 0.520 11.3 AWB 4 12.8 0.795 60.6 189 0.515 11.6 AWT 5 13.2 0.833 61.8 199 0.512 12.4 AWT Mean 13.2 0.824 61.8 197 0.510 11.7
sn-1 0.62 0.020 2.4 5.8 0.010 0.46
CV [%] 4.7 2.4 3.9 2.9 2.0 3.9
Table 5. Mechanical properties of carbon/epoxy fabric materials Fabric type/
Property
Current results
Satin [16]
Plain weave [17]
Plain weave [18]
2×2 twill [19]
Et(warp) [GPa] 64.8 77 70 56 52
Et(fill) [GPa] 65.5 75 68 55 49
σut(warp) [GPa] 787 963 888 918 563
σut(fill) [GPa] 818 838 803 775 613
νwarp-fill 0.0936 0.07 0.045 0.042 0.042
Gwarp-fill 3.63 6.5 4.7 4.2 2.9
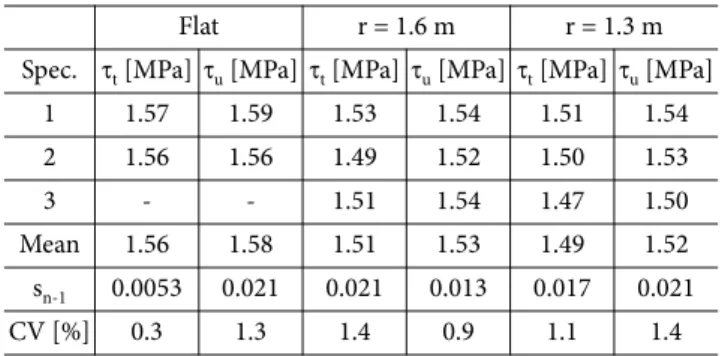
was observed. The final failure was from bending failure of the top face, occasionally accompanied with some de-bonding of the bottom face in the same region. Individual test results of transition point shear stress (τt) and ultimate shear stress (τu)
are listed in Tables 6, 7 and 8. The transition point was deter- mined by a 0.1 mm deflection offset of the stress/displacement slope.
Consideration of the testing conditions is required to com- pare the measured core shear strengths with the manu- facturer data (Table 1). A correction factor for the core thick- ness (Kt) and the test method (Km) are multiplied to the man- ufacturer strengths: Kt= 1.08 (10 mm vs 15.88 mm) and Km= 1.07 (flexion vs plate shear) [8]. This brings the man- ufacturer predicted core shear strengths to 1.76, 1.71, and 1.68 MPa for the 3.18, 4.76, and 6.35 mm cores respectively. The measured flat panel ultimate shear strengths are therefore lower than the manufacturer data by 11.35%, 25.7%, and 30.3% for the 3.18, 4.76, and 6.35 mm cores respectively. The use of a pivoted mid-span load point might be a factor causing these lower strengths. As we observed, the core would collapse on one side, then the deflection appeared to favor that weak side and the mid-span load block would pivot slightly. With a fixed load point, the stress could possibly have been kept dis- tributed more evenly on both sides.
While considering the small test sample evaluated, the results point to a small reduction in core shear strength caused by panel curvature. From flat to a radius of 1.3 meter, the mea- sured ultimate core shear strength reductions are 2.5%, 3.8%, and 0.8% for the 3.18, 4.76, and 6.35 mm cores respectively.
4. CONCLUSIONS
CFRP fabric faced aluminum honeycomb core sandwich panels were fabricated. Molding of curved sandwich panels, with radii of 1.3 m and 1.6 m, and with the core in the W- direction, was possible with little additional effort. The tensile mechanical properties of the CFRP prepreg 2 × 2 twill fabric laminate were evaluated; they are in the range of other CFRP prepreg fabric materials. The fabricated panels were tested in 3-point flexion. The measured shear strengths were 11-30%
lower than the manufacturer published data; this may be caused by the test set-up used. While considering the small test sample, the 1.3 meter panel curvature caused a 0.8-3.8%
reduction in ultimate core shear strength. Further tests are envisaged with different sandwich fabrication methods and a revised flexion test set-up.
ACKNOWLEDGEMENTS
This work was supported by Priority Research Centers Pro- gram through the National Research Foundation of Korea (NRF) funded by the Ministry of Education, Science and Technology (2012-048078). The authors also gratefully acknowledge the Ministry of knowledge Economy (MKE), Korea Institute for Advancement of Technology (KIAT) and Dongnam Leading Industry Office through the Leading Industry Development for Economic Region.
Fig. 5. Representative Shear/deflection plots.
Table 6. 3.18 mm core flexion test results
Flat r = 1.6 m r = 1.3 m
Spec. τt [MPa]τu [MPa]τt [MPa]τu [MPa]τt [MPa]τu [MPa]
1 1.57 1.59 1.53 1.54 1.51 1.54
2 1.56 1.56 1.49 1.52 1.50 1.53
3 - - 1.51 1.54 1.47 1.50
Mean 1.56 1.58 1.51 1.53 1.49 1.52
sn-1 0.0053 0.021 0.021 0.013 0.017 0.021
CV [%] 0.3 1.3 1.4 0.9 1.1 1.4
Table 7. 4.76 mm core flexion test results
Flat r = 1.6 m r = 1.3 m
Spec. τt [MPa]τu [MPa]τt [MPa]τu [MPa]τt [MPa]τu [MPa]
1 1.27 1.31 1.28 1.31 1.17 1.23
2 1.29 1.34 1.25 1.28 1.20 1.29
3 1.26 1.29 1.26 1.29 1.21 1.27
Mean 1.27 1.31 1.27 1.30 1.19 1.26
sn-1 0.015 0.029 0.013 0.015 0.018 0.030
CV [%] 1.2 2.2 1.1 1.2 1.5 2.4
Table 8. 6.35 mm core flexion test results
Flat r = 1.6 m r = 1.3 m
Spec. τt [MPa]τu [MPa]τt [MPa]τu [MPa]τt [MPa]τu [MPa]
1 1.16 1.26 1.14 1.26 1.13 1.23
2 1.21 1.29 1.12 1.24 1.15 1.26
3 1.12 1.25 1.10 1.22 1.17 1.26
Mean 1.17 1.26 1.12 1.24 1.15 1.25
sn-1 0.047 0.021 0.021 0.017 0.019 0.020
CV [%] 4.0 1.7 1.8 1.4 1.7 1.6
REFERENCES
1. Wahl, L., Maas, S., Waldmann, D., Zürbes, A., and Frères, P.,
“Shear Stresses in Honeycomb Sandwich Plates: Analytical Solution, Finite Element Method and Experimental Verifica- tion,” Journal of Sandwich Structures and Materials, Vol. 14, No.
4, 2012, pp. 449-468.
2. PAMG-XR1 5052 Aluminum Honeycomb, Plascore Inc., Zeeland, USA, 2012.
3. PN2 Aerospace Grade Aramid Fiber Honeycomb, Plascore Inc., Zeeland, USA, 2012.
4. Paika, J.K., Thayamballib, A.K., and Kima, G.S., “The Strength Characteristics of Aluminum Honeycomb Sandwich Panels,” Thin-Walled Structures, Vol. 35, No. 3, 1999, pp. 205-231.
5. Jen, Y.M., and Chang, L.Y., “Evaluating Bending Fatigue Strength of Aluminum Honeycomb Sandwich Beams Using Local Parameters,” International Journal of Fatigue, Vol. 30, No.
6, 2008, pp. 1103-1114.
6. Campbell, F.C., Structural Composite Materials, ASM Interna- tional, Materials Park, USA, 2010.
7. PAMG-XR1 5056 Aluminum Honeycomb, Plascore Inc., Zeeland, USA, 2012.
8. HexWeb Honeycomb Attributes and Properties, Hexcel Com- posite Materials, Pleasanton, USA, 1999.
9. Lopes-Tavares, S.S., Optimisation of Low Pressure Processing for Honeycomb Sandwich Structures, Ph.D Thesis, École Polytech- nique Fédérale de Lausanne, Switzerland, 2009.
10. Kratz, J., Processing Composite Sandwich Structures using Out- of-Autoclave Technology, Ph.D Thesis, McGill University, Can- ada, 2009.
11. ASTM D3039 Standard Test Method for Tensile Properties of Polymer Matrix Composites Materials, ASTM International, West Conshohocken, USA, 2000.
12. ASTM C393 Standard Test Method for Flexural Properties of Sandwich Constructions, ASTM International, West Consho- hocken, USA, 2000.
13. Hübner, M., Diestel, O., Sennewald, C., Gereke, T., and Cherif, C., “Simulation of the Drapability of Textile Semi-Finished Products with Gradient-Drapability Characteristics by Varying the Fabric Weave,” Fibres & Textiles in Eastern Europe, Vol. 20, No. 5, 2012, pp. 88-93.
14. Rozant, O., Bourban, P.-E., and Månson, J.-A.E., “Drapability of Dry Textile Fabrics for Stampable Thermoplastic Preforms,” Composites: Part A, Vol. 31, No. 11, 2000, pp. 1167-1177.
15. www.skchemicals.com/english2/product/special/ind/flex 16. Abot, J.L., Yasmin, A., Jacobsen, A.J., and Daniel, I.M., “In-
plane Mechanical, Thermal and Viscoelastic Properties of a Satin Fabric Carbon/Epoxy Composite,” Composites Science and Technology, Vol. 64, No. 2, 2004, pp. 263-268.
17. Tencate TC250 Resin System, TenCate Advanced Composites, Morgan Hill, USA, 2012.
18. Tomblin, J., Sherraden, J., Seneviratne, W., and Raju, K.S., “A- Basis and B-Basis Design Allowables for Epoxy-Based Prepreg TORAY T700SC-12K-50C/#2510 Plain Weave Fabric,” National Institute for Aviation Research, Wichita State University, USA, 2002.
19. Cruz, J.R., Shah, C.H., and Postyn, A.S., “Properties of Two Carbon Composite Materials Using LTM25 Epoxy Resin,” NASA Langley Research Center, USA, 1996.
![Table 1. Aluminum honeycomb cores tested [2]](https://thumb-ap.123doks.com/thumbv2/123dokinfo/4794069.277391/2.892.458.821.185.291/table-aluminum-honeycomb-cores-tested.webp)