INTRODUCTION
The importance of long-term ecological monitor-
ing researches in lentic ecosystems, based on glo- bal and national (regional) scale, have been emp- hasized due to approaching global warming (tem- perature changes) as well as rapid regional eutr-
─
─ 476 ─ ─
* Corresponding author: Tel: +82-42-821-6408, Fax: +82-42-822-9690, E-mail: [email protected]
Initial Preliminary Studies in National Long-Term Ecological Research (LTER) Stations of Daechung Reservoir
Lee, Sang-Jae, Jae Hoon Lee, Jong Im Kim, Geung-Hwan La
1, Min-Ae Yoem
2, Woongghi Shin, Hyun-Woo Kim
1, Min-Ho Jang
2and Kwang-Guk An*
(Department of Biology, College of Biological Sciences and Biotechnology, Chungnam National University, Daejeon 305-764, Korea
1
Department of Environmental Education, Sunchon National University, Suncheon 540-742, Korea
2
Department of Biology Education, Kongju National University, Gongju 314-701, Korea)
Major objective of our study was to introduce initial researches of national long-term ecological monitoring studies on Daechung Reservoir, as one of the representative lentic reservoir ecosystems in Korea. For the long-term ecological research (LTER), we conducted preliminary field monitoring during 2008~ ~2009 and analyzed biologi- cal parameters such as phytoplankton, zooplankton, and freshwater fish along with chemical water quality and empirical model analysis. According to phytoplankton surveys, major taxa have varied largely depending on seasons and sites sampled. Over- all phytoplankton data showed that cyanophyta dominated in the summer period and diatoms dominated in the winter. In zooplankton analysis, 25 species including 20 rotifers, 3 cladocerans and 2 copepods were collected during the survey. The relative abundance of rotifers (86.5%) was always greater than that of cladocerans (6.3%) or copepods (5.1%). There were distinct spatial and inter-annual changes in the abunda- nce of zooplankton in the reservoir, displaying similar patterns in three sites with the exception of S3 during the study. According to fish surveys, 8 families and 39 species were observed during 2008~ ~2009. The most dominant fish was an exotic species of Lepomis macrochirus (23%), indicating an severe influence of exotic species to the ecosystem. TP averaged 17.9 μμg L
-1(6~ ~80 μμg L
-1), which was judged as a mesotrophy, and showed a distinct longitudinal gradients. TN averaged 1.585 mg L
-1during the study and judged as hypereutrophic condition. Unlike TP, TN didn’t show any large seasonal and spatial variations. Under the circumstances, nitrogen limitation may not happen in this system, indicating that nitrogen control is not effective in the water- shed managements. These data generated in the LTER station will provide key infor- mation on long-term biological and water quality changes in relation to global warm- ing and some clues for efficient reservoir ecosystem managements.
Key words : ecological study, LTER, national long-term ecological monitoring station,
Daechung Reservoir
ophication and flow modification. World-wide and regional ecolological monitoring studies of natural lake and reservoir ecosystems (Zilov, 2001; straˇsk- rábová et al., 2005; White et al., 2008) showed that water resources are rapidly eutrophied over the time by nitrogen and / or phosphorus inputs from the watershed due to intense agricultural activiti- es, rapid urbanization, and increased human pop- ulation. Such nutrient enrichments in the water- bodies were often influenced by regional modifica- tions of flow regime (flow reduction or increases), land-use patterns, and use of the water resource and overall these factors influenced up to human health throughout the drinking water-use as well as physical habitat and aquatic organisms.
Also, global influence (not regional) by climate changes and global warming (Vitousek, 1994; Burn and Simonovic, 1996; Rosa et al., 2002) was consid- ered as important factor regulating or modifying the functions of lake and reservoir ecosystems.
Global warming influencing the weather condition such as air temperature and light quantity is caus- ed by CO
2increases in the atmosphere, and this altered seasonal and temporal dynamics of chemi- cal conditions of nitrogen and phosphorus (Wang et al., 2009), phytoplankton (Yoshimura et al., 2009), zooplankton (Helland et al., 2007), macroinverte- brate (Durance and Ormerod, 2007), and fish (Dud- geon et al., 2006) in lake and reservoir ecosystems.
Under such circumstances, accelerated eutrophi- cation and reduced biodiveristy in lentic ecosys- tems were diagnostic evidence over the world (Fer- rari et al., 2007; Komatsu et al., 2007). For these reasons, long-term ecological monitoring research- es are widely conducted as global and national (regional) scales in United States (US LTER Net- work, 1998; Jensen et al., 2007), Canada (White et al., 2008) and England (Johnes, 1999) and now national-level long-term ecological monitoring in Korean government is in stating point.
Generally, long-term ecological research is defin- ed as a study on time-serial monitorings of various ecological parameters at the same region or ecore- gion using a same methodology. Last several dec- ades, few studies related to the long-term ecologi- cal monitoring were conducted in Korea, and only several researches over the period of less than 5~
6 years have conducted in Korea. Long-term res- earches on freshwater ecosystem in Korea were usually confined to chemical water quality and water amount, some parameters associated with ecological structure and functions. In early 2000,
some interests for long-term ecological research increased in relation with climate changes and global warming in Korea. As consequences, long- term ecological monitoring researches on forest, freshwater, estuary, and ocean were in progress all over the country. To coexist with human being and nature, it is necessary to understand struc- tures and functions of aquatic ecosystems. Thus, the priority in long-term ecological researches was to analyze patterns and changes of various ecolog- ical parameters over the period. Most previous studies in North American and European lakes and reservoirs have wide ranges from microtaxa such as phytoplankton and zooplankton to higher consumer such as macroinvertebrates and fishes (Dudgeon et al., 2006; Durance and Ormerod, 2007;
Helland et al., 2007; Yoshimura et al., 2009).
Korean government designated some long-term ecological monitoring stations such as terrestrial ecosystems (forests), aquatic ecosystems (wetlands, reservoirs), and estuary ecosystems in cope with global warming in the future. Daechung Reservoir, which is a study station in this paper, is one of the national long-term ecological monitoring stations designated in 2008 by the Ministry of Environ- ment, Korea. Over 95% of all Korean lakes includ- ing Daechung Reservoir is man-made lake (reser- voir) and were built since 1950s. So, the station represents lentic ecosystems in Korea and is most important source of drinking water. The reservoir were formed to be different fundamentally, com- pared to natural lakes. Thus, the reservoir system has morphological (structural) and functional dif- ferences, compared with natural lakes (Thornton, 1990; Wetzel, 1990), so long term national moni- torings were required for lake conservation and protection in Korea.
Major objectives of our study was to introduce the initial researches of national long-term ecolog- ical monitoring station, which is Daechung Reser- voir as one of the most representative reservoirs in Korean freshwater ecosystem. For the accumu- lation of long-term ecological information, we con- ducted preliminary field monitorings during 2008
~2009 and analyzed biological parameters such
as phytoplankton, zooplankton, and freshwater
fish along with chemical water quality and empir-
ical model analysis. These data generated in this
station may provide some key information on long-
term water quality and ecological changes in rela-
tion to global warming and some clues for efficient
reservoir ecosystem managements.
MATERIALS AND METHODS
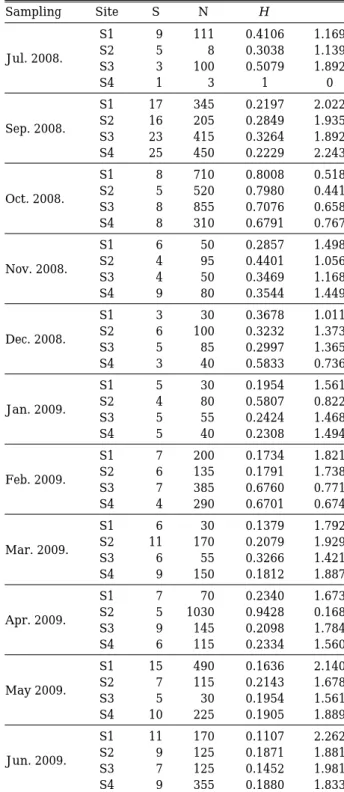
1. Descriptions of sampling sites and periods Daechung Reservoir is a large dam reservoir, which was built in 1980 and supplies mainly drink- ing-water to Daejeon and Cheongju cities as well as mid-downstream region of the Geum River. The reservoir has surface area of 72.8 km
2, total length of 80 km, and watershed area of 4,134 km
2. For the long-term ecological monitoring purposes, we ch- oose 4 regular sites (Fig. 1) of Daechung Reservoir Station, which were considered longitudinal gra- dients from the up-reservoir to down-reservoir (dam) within the reservoir and in these sites we monitored spatial and temporal dynamics of phy- toplankton and zooplankton and water quality parameters. In addition to the regular sites, we added 3 more sites including two inflowing tribu- taries of Annae Stream and Annam Stream, and
one mainstem inflowing site of Geum River. The sites of S5, S6, and S7 added are as follows; S5:
Janggye bridge, Janggye-ri, Annae-myeon, Okche- on-gun, Chungcheongbuk-do (N36�22 ′16.7′′ E127�
38 ′12.8′′), S6: Yeonju-ri, Annam-myeon, Okcheon- gun, Chungcheongbuk-do (N36�20 ′48.7′′ E127�39′
51.2 ′′) and S7: Ewon-ri, Ewon-myeon, Okcheon- gun, Chungcheongbuk-do (N36�14 ′25.3′′ E127�40′
14.5 ′′). The sampling sites for long term ecological research (LTER) are as follows;
S1: Dam site, Micheon-ri, Moonweui-myeon, Cheonwon-gun, Chuncheongbuk-do (N36�30 ′ 39.6 ′′ E127�29′57.6′′).
S2: Wheonam large bridge, Saeum-ri, Boeun- gun, Chungcheongbuk-do (N36�25 ′57.6′′
E127�33 ′1.5′′).
S3: Banga-sil, Daejeong-ri, Gunbuk-myeon, Okcheon-gun, Chungcheongbuk-do (N36�23 ′ 16.8 ′′ E127�32′54.5′′).
S4: Chudong intake tower, Dong-gu, Daejeon
Fig. 1. Map showing the sampling sites (S1~S4) of phytoplankton, zooplankton, and water quality in Daechung Reservoir.
For the fish survey, we added more sites (S5~S7), which is described in the section of “sampling sites”.
Daechung Reservoir
Annae Stream Dam
S1
127�30′ 127�36′ 127�42′
36�30′
36�24′
36�18′
0 2.25 4.5 km 1 : 225,000
S2
S3
S4 S5
S6
S7
Annam Stream
N
city (N36�22 ′15.0′′ E127�28′44.3′′). Inflow streams
The samplings were conducted during 2008~
2009 as an initial part of long-term ecological research (LTER). During the study period, phyto- plankton surveys and water quality analysis were conducted once per month, while zooplankton and fish surveys were 4~5 times a year.
2. Analytical methods 1) Phytoplankton analysis
We collected 1 L water from the surface layer in the four LTER sampling sites and the samples were fixed using Lugol’s solution for standing crop analysis of the phytoplankton. Initial 1 L water were concentrated by 50 mL according to natural precipitation method.
The quantitative sampling of phytoplankton were conducted by phytoplankton net of 20 μm mesh-size and the cell counting of phytoplankton were measured by optical plastic plankton counter (MATSUNAMI Class ind. LTD, Japan). We also measured cell numbers of cyanophyta, chlorophy- ta, distoms, dinoflagellate and cryptophyta using photo microscope (Nikon ECLIPS 80i, Japan) un- der the 200 magnification. Also, we analyzed com- munity structures of phytoplankton using species dominance index (Simpson, 1949) and species div- ersity index (Shannon and Weaver, 1949) and com- pared them in the sampling sites. The equations for two indices are as follows:
( I ) Simpson’s dominance index N
i2λ = = » mmmmmmmmmm -N N (N-1)
(N= =the total number of i-th species; N
i= =the to- tal number of i-th species)
(II) Shannon-Weaver diversity index H ′= =- » P
iLog
10P
i(P
i= = N
i/ N)
2) Zooplannkton analysis
We collected 20 L surface water near 0.5 m depth using a 3.21 Van Dorn water sampler for zooplank- ton analysis. This water was filtered through a 35 μm mesh net, and the zooplanktons retained were preserved with 10% formalin (final concen- tration 4%). Large-size (0.2 mm and exclusively
copepods and cladocerans) and small-size zooplan- ktons (0.2 mm and mostly nauplii and rotifers) were counted separately because they differed sub- stantially in their numerical densities. Large zoo- plankton was counted using an inverted micro- scope at 2550 magnification. Small zooplankton was counted at 100400 magnification. Zooplankton taxa were identified to genus or species (except for juvenile copepods) after taxa indentification ap- proaches of Koste (1978), Smirnov and Timms (1983), Koste and Shiel (1987) and Bayly (1992).
3) Fish collections
For the fish sampling, kick-net (4×4 mm) and casting-net (5×5 mm) were used. All fishes were identified at the sampling locations and then imm- ediately released, except for same ambiguous fish- es for the identification. Ambiguous specimens to identify were preserved in 10% formalin solution and bring it to the laboratory to further taxa and species identification. Fish classification were fol- lowed by approaches of Kim and Park (2002) and Nelson (1994). For the community structure analy- sis, we calculated for species dominance index (Magurran, 1988), species diversity index (Pielou, 1969), species evenness index (Pielou, 1969), and species richness index (Margalef, 1958).
4) Empirical models
For the analysis of physicochemical water qual-
ity data, we applied the monthly data from water
quality monitoring sites conducted by the ministry
of environment, Korea (MEK). According to Korean
monsoon characteristics usually the rainfall cen-
tralizing in the summer, we also analyzed the pre-
cipitation effect on water quality using rainfall
data obtained from Daejeon Meteorological Stati-
on, Korea. Also, we developed empirical models
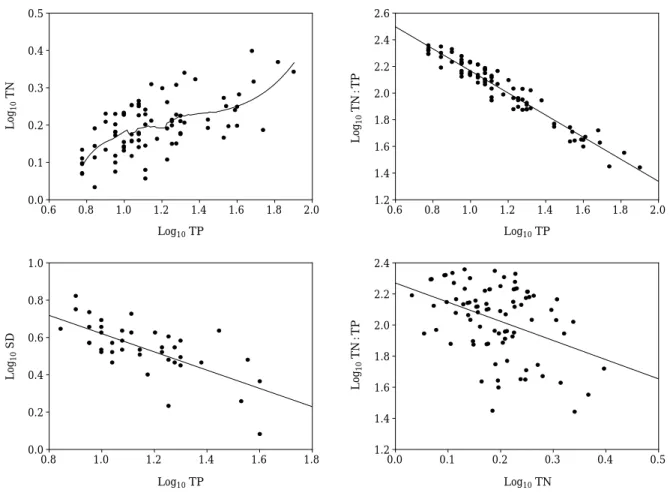
using major trophic variables such as total phos-
phorus (TP), total nitrogen (TN), TN : TP ratios,
and chlorophyll-a (CHL). To predict and assess the
nutrient status we analyzed empirical relations
of Log
10-transformed TP-TN, TP-N : P ratios, TN-
N : P ratios, TP-SD, and TN-SD. We also conduct-
ed correlation and regression analysis using water
quality variables among the sampling sites and
seasons using SPSS statistical package (Window
version 12.0). Through the statistical analysis,
we analyzed the relations and primary factors
regulating trophic sate and key nutrients regulat-
ing the phytoplankton productions in the long-term
sites.
RESULTS AND DISCUSSION
1. Species fauna and community structures of phytoplankton
During the study, seasonal and spatial variati- ons were showed in dominant species. In 2008, minimum number of species were observed on July in the Site 4 (S4), whereas maximum were observed at all sites in September (Table 1). Rela- tive abundance analysis of phytoplankton commu- nity showed that cyanophyta dominated the phyto- plankton community by 59% and 57%, respective- ly in July and September and that cyanophyta and diatom dominated the phytoplankton commu- nity by 47% and 50%, respectively during the June.
In other seasons of January~May and October~
November, diatoms dominated the community by 77% (Fig. 2). In 2009, relative abundance of cyan- ophyta was minimum (1.8%), increased by 47% in June, and then peaked by 59% in July. The diatom peak rapidly decreased by 7.9% in October 2009.
When the standing crop of diatoms peaked on October 2008, total cell number was 2.1×10
3cells
∙mL
-1and the diatom was made of 88% of the total phytoplankton compositions
The season when the abundance of diatoms was highest (96.7%) was April 2009 and the stand- ing crop was 1.3×10
3cells∙mL
-1. chlorophyta showed consistant appearance during the study period, but the relative abundance of chlorophyta was relatively low (9.2), Compared to other taxa.
flagellate algae such as dinophyta and cryptophy- ta had minor abundance (¤5% of the total) except
for short period of July 2008 (35.1%). According to analysis of dominant taxa in each sampling site,
J S O N D J F M A M J
Relative abundance of major phytoplankton community (%) 0 20 40 60 80 100
Cyanophyta Chlorophyta Diatom
Dinophyta Cryptophyta
Fig. 2. Relative abundance of dominant phytoplankton taxa sampled during 2008~2009.
Table 1. Total number of phytoplankton species (S, cell∙
mL
-1), cell number (N, cell∙mL
-1), and commu- nity indices of species dominance index (H ′, cell∙
mL
-1) and species diversity index ( λ, cell∙mL
-1) during 2008~2009.
Sampling Site S N H ′ λ
S1 9 111 0.4106 1.169
Jul. 2008. S2 5 8 0.3038 1.139
S3 3 100 0.5079 1.892
S4 1 3 1 0
S1 17 345 0.2197 2.022
Sep. 2008. S2 16 205 0.2849 1.935
S3 23 415 0.3264 1.892
S4 25 450 0.2229 2.243
S1 8 710 0.8008 0.518
Oct. 2008. S2 5 520 0.7980 0.441
S3 8 855 0.7076 0.658
S4 8 310 0.6791 0.767
S1 6 50 0.2857 1.498
Nov. 2008. S2 4 95 0.4401 1.056
S3 4 50 0.3469 1.168
S4 9 80 0.3544 1.449
S1 3 30 0.3678 1.011
Dec. 2008. S2 6 100 0.3232 1.373
S3 5 85 0.2997 1.365
S4 3 40 0.5833 0.736
S1 5 30 0.1954 1.561
Jan. 2009. S2 4 80 0.5807 0.822
S3 5 55 0.2424 1.468
S4 5 40 0.2308 1.494
S1 7 200 0.1734 1.821
Feb. 2009. S2 6 135 0.1791 1.738
S3 7 385 0.6760 0.771
S4 4 290 0.6701 0.674
S1 6 30 0.1379 1.792
Mar. 2009. S2 11 170 0.2079 1.929
S3 6 55 0.3266 1.421
S4 9 150 0.1812 1.887
S1 7 70 0.2340 1.673
Apr. 2009. S2 5 1030 0.9428 0.168
S3 9 145 0.2098 1.784
S4 6 115 0.2334 1.560
S1 15 490 0.1636 2.140
May 2009. S2 7 115 0.2143 1.678
S3 5 30 0.1954 1.561
S4 10 225 0.1905 1.889
S1 11 170 0.1107 2.262
Jun. 2009. S2 9 125 0.1871 1.881
S3 7 125 0.1452 1.981
S4 9 355 0.1880 1.833
the frequency of diatom dominance was ¤83.0%
during January~March and ¤66.0% during April
~June along with 75.0% during October~Decem- ber. In the period of June and September, cyano- phyta of Anabaena flos-aquae and Microcystis aer- uginosa dominated by 75.0% the phytoplankton community. In the analysis of class-level taxa, diatoms were most dominant taxa, and Aulacose- ria of the datum taxa was 32% in the analysis.
And the second dominant taxa were Asterionella which is a diatom, and followed by Oscillatoria (13.6%) along with Microcystis aeruginosa, Anabae- na flos-aquae, Cyclotella and Staurastrum in the order of abundance. We found that Aulacoserea dominated the community in all four sites during October~November and Asterionella dominated the community during January~April. These re- sults indicate that the texa dominated appeared during the cold season, so the dominance may be regulated by low temperature. According to analy- sis of Simpson’s dominance index, site 4 (S4) show- ed highest (1.0) in July, while site 2 (S2) also show- ed value (0.9428) in June. In the meantime, spe- cies diversity index had inverse correlation with the dominance index; species diversity index was 0.0 in the site 4 during July, while it was highest (2.262) in the site 1 during June (Table 1).
2. Monitoring of zooplankton fauna and abundance
A total of 25 species of zooplankton were identi- fied (20 rotifers, 3 cladocerans and 2 copepods) during the survey. The relative abundance of roti- fers (86.5%) was always greater than that of cla- docerans (6.3%) or copepods (5.1%) (Fig. 3). Among the rotifers, Brachionus calyciflorus, Keratella cochlearis, and Polyarthra spp. were the most com- mon species. Bosmina longirostris accounted for more than 63% of the total cladoceransabundance.
Copepods were dominated by cyclopoids. Adult cyclopoid abundances were low and the relative abundances of nauplii was more than 47% during study.
There were distinct spatial and inter-annual changes in abundance of zooplankton in the lake (Fig. 4), displaying similar patterns in three sites with the exception of S3 during study. Annual me- an of total zooplankton abundance in three sites (S1, S3, and S4) was much higher than in S2 for both years. High inter-annual variation of total zooplankton abundance was observed in three sites
of S1, S2, and S4, while low variation was observ- ed in S3 during the study.
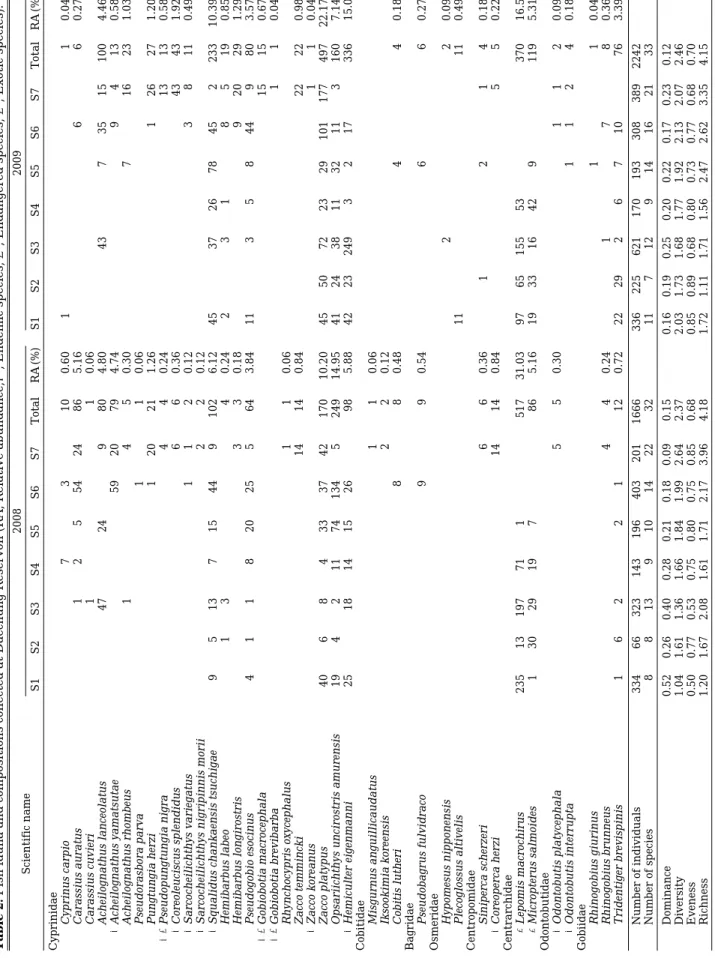
3. Fish fauna and compositions
According to fish surveys, based on 7 times col- lections, during 2008~2009, 8 families and 39 species (3,908 individuals) were observed in Dae- chung Reservoir. Cyprinidae was the most domi- nant with 67.3%, showing the highest appearance ratio and exotic Centrarchidae also showed a high appearance with 27.9%. Among the Cyprinidae, it was dominant for Squalidus chankaensis tsuchi- gae, Zacco platypus, Opsariichthys uncirostris amurensis, and Hemiculter eigenmanni which species usually prefer lentic region and inhabit
0 20 40 60 80 100
Rotifers Cladocerans Nauplius Copepodids
S1 S2 S3 S4
Relative abundance of major zooplankton community (%)
Fig. 3. Relative abundance of major zooplankton communi- ty sampled during 2008~2009.
0 500 1000 1500 2000 2500 3000 3500
Annual average of total zooplankton abundance (Ind. L
-1)
S1 S2 S3 S4
2008 2009 2008~2009
Fig. 4. The spatial variation of total zooplankton abundan-
ce, based on annual averages.
Table 2. Fish fauna and compositions collected at Daechung Reservoir (RA, Relative abundance; ※ , Endemic species; ★ , Endangered species; ▲ , Exotic species). Scientific name 2008 2009 S1 S2 S3 S4 S5 S6 S7 Total RA (%) S1 S2 S3 S4 S5 S6 S7 Total RA (%) Cyprinidae Cyprinus carpio 7 3 10 0.60 1 1 0.04 Carassius auratus 1 2 5 5 4 2 4 8 6 5.16 6 6 0.27 Carassius cuvieri 1 1 0.06 Acheilognathus lanceolatus 47 24 9 8 0 4.80 43 7 3 5 1 5 1 00 4.46
※Acheilognathus yamatsutae 59 20 79 4.74 9 4 13 0.58 Acheilognathus rhombeus 1 4 5 0.30 7 1 6 2 3 1.03 Pseudorasbora parva 1 1 0.06 Pungtungia herzi 1 2 0 2 1 1.26 1 2 6 2 7 1.20
※★Pseudopungtungia nigra 4 4 0.24 13 13 0.58
※Coreoleuciscus splendidus 6 6 0.36 43 43 1.92
※Sarcocheilichthys variegatus 1 1 2 0.12 3 8 11 0.49
※Sarcocheilichthys nigripinnis morii 2 2 0.12
※Squalidus chankaensis tsuchigae 9 5 13 7 1 5 4 4 9 102 6.12 45 37 26 78 45 2 2 33 10.39 Hemibarbus labeo 1 3 4 0.24 2 3 1 8 5 1 9 0.85 Hemibarbus longirostris 3 3 0.18 9 2 0 2 9 1.29 Pseudogobio esocinus 4 1 1 8 20 25 5 6 4 3.84 11 3 5 8 4 4 9 80 3.57
※★Gobiobotia macrocephala 15 15 0.67
※★Gobiobotia brevibarba 1 1 0.04 Rhynchocypris oxycephalus 1 1 0.06 Zacco temmincki 14 14 0.84 22 22 0.98
※Zacco koreanus 1 1 0.04 Zacco platypus 40 6 8 4 3 3 3 7 4 2 170 10.20 45 50 72 23 29 101 177 497 22.17 Opsariichthys uncirostris amurensis 19 4 2 11 74 134 5 249 14.95 41 24 38 11 32 11 3 1 60 7.14
※Hemiculter eigenmanni 25 18 14 15 26 98 5.88 42 23 249 3 2 1 7 3 36 15.0 Cobitidae Misgurnus anguillicaudatus 1 1 0.06 Iksookimia koreensis 2 2 0.12 Cobitis lutheri 8 8 0.48 4 4 0.18 Bagridae Pseudobagrus fulvidraco 9 9 0.54 6 6 0.27 Osmeridae Hypomesus nipponensis 2 2 0.09 Plecoglossus altivelis 11 11 0.49 Centropomidae Siniperca scherzeri 6 6 0.36 1 2 1 4 0.18
※Coreoperca herzi 14 14 0.84 5 5 0.22 Centrarchidae
▲Lepomis macrochirus 235 1 3 197 71 1 517 31.03 97 65 155 5 3 3 70 16.5
▲Micropterus salmoides 1 3 0 2 9 1 9 7 86 5.16 19 33 16 42 9 1 19 5.31 Odontobutidae
※Odontobutis platycephala 5 5 0.30 1 1 2 0.09
※Odontobutis interrupta 1 1 2 4 0.18 Gobiidae Rhinogobius giurinus 1 1 0.04 Rhinogobius brunneus 4 4 0.24 1 7 8 0.36 Tridentiger brevispinis 1 6 2 2 1 1 2 0.72 22 29 2 6 7 1 0 7 6 3.39 Number of individuals 334 6 6 323 143 196 403 201 1666 336 225 621 1 70 193 308 389 2242 Number of species 8 8 13 9 1 0 1 4 2 2 3 2 1 1 7 12 9 1 4 1 6 2 1 3 3 Dominance 0.52 0.26 0.40 0.28 0.21 0.18 0.09 0.15 0.16 0.19 0.25 0.20 0.22 0.17 0.23 0.12 Diversity 1.04 1.61 1.36 1.66 1.84 1.99 2.64 2.37 2.03 1.73 1.68 1.77 1.92 2.13 2.07 2.46 Eveness 0.50 0.77 0.53 0.75 0.80 0.75 0.85 0.68 0.85 0.89 0.68 0.80 0.73 0.77 0.68 0.70 Richness 1.20 1.67 2.08 1.61 1.71 2.17 3.96 4.18 1.72 1.11 1.71 1.56 2.47 2.62 3.35 4.15
withour any preference for lotic or lentic region. In addition, some species, such as Gobiobotia macro- cephala, Gobiobotia brevibarba, and Zacco tem- minckii were only appeared in a inflow stream site (S7) remained lotic status over year. The most dominant species in the study was Lepomis mac- rochirus with 22.7%, relative abundance (RA) and subdominant species were Zacco platypus (17.1%
RA), Hemiculter eigenmanni (11.1% RA) and Opsa- riichthys uncirostris amurensis (10.5% RA), respec- tively. In addition, bluegill sunfish (Lepomis mac- rochirus) was appeared all survey sites except S6 and S7 where maintain the lotic condition.
According to fish survey result of 2008, 32 fish species and 1,666 individuals were sampled and dominant familes were Cyprinidae (60.1%) and Centrarchidae (36.2%) as similar as the entire survey results. It was dominated in the order of RA as Lepomis macrochirus (31.0% RA) Opsariic- hthys uncirostris amurensis (14.9% RA), and Zacco platypus (10.2% RA). In 2009, 33 speceis and 2,242 individuals were sampled and Cyprinidae (72.7%) and Centrarchidae (21.8%) were dominant as same as other year with slight difference of percentage.
Zacco platypus was the most dominant species with 22.2% RA and Lepomis macrochirus (16.5%
RA) and Hemiculter eigenmanni (15.0% RA) were subdominant, respectively. From the annual an- alysis, Comparison of RA with top 10 species in the appearance showed the similar pattern with just slight ratio differences. It was almost same order in appearance but showed a little placing changes in annual analysis. This order change was occurred only in species showing relatively lower RA. Endemic and endangered species were increased in 2009 than in 2008. In case of endem- ic speceis, it was appeared. total 13 species for en- demic fish. According to the annual variation of endemic species, 9 species was presented in 2008 and 12 species was in 2009. It was added 4 more new species in 2009 but disappeared 1 species previously sampled. In case of endangered species, 1 species, Pseudopungtungia nigra was sampled in 2008 and 2 more species, Gobiobotia macroce- phala and Gobiobotia brevibarba were added in 2009. Though species diversity and richness was not showing an wide annual variation, these two indices were slightly increased in 2009. In domi- nance index, It was appeared higher in inside of the dam in 2008 but decreased in 2009. Also, diver- sity and richness were presented higher in inflow stream than inside of the dam but dominance in-
dex was showing low (Table 2).
Now, most of survey were limited in short-term research on specific sites from necessity in Korea.
These short term study could respond the condi- tion on some specific sites on certain period. How- ever, it could hardly speak for a long-term respon- se in aquatic ecosystem. According to environmen- tal variations, ecosystem change was appeared with long term response instead of short term ex- cept some specific case (e.g. direct inflow of toxi- cants and pollutants). Also, cause and effect in this change were occurred in a time lag (Magnuson, 1990). Therefore, it should cause some serious problems to manage and conserve environment if we didn’t care for the long-term respose in resear- ch (Magnuson, 1990). Variation analysis of fish fauna in Daechung Reservoir should require this long term study to understand its ecosystem. It have study background for fish fauna in Daechung Resercoir previously conducted (Choi et al., 1977;
Choi et al., 1997) However, most of them was res-
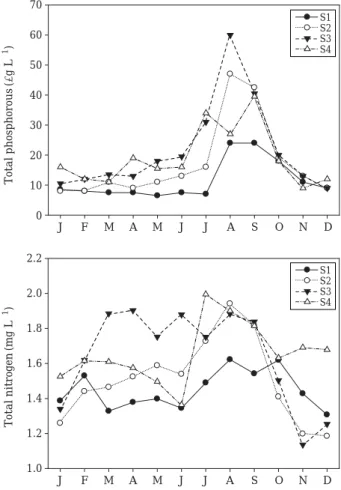
J F M A M J J A S O N D
Total phosphorous (μ g L
-1) Total nitrogen (mg L
-1)
0 10 20 30 40 50 60 70
J F M A M J J A S O N D
1.0 1.2 1.4 1.6 1.8 2.0 2.2
S1 S2 S3 S4
S1 S2 S3 S4